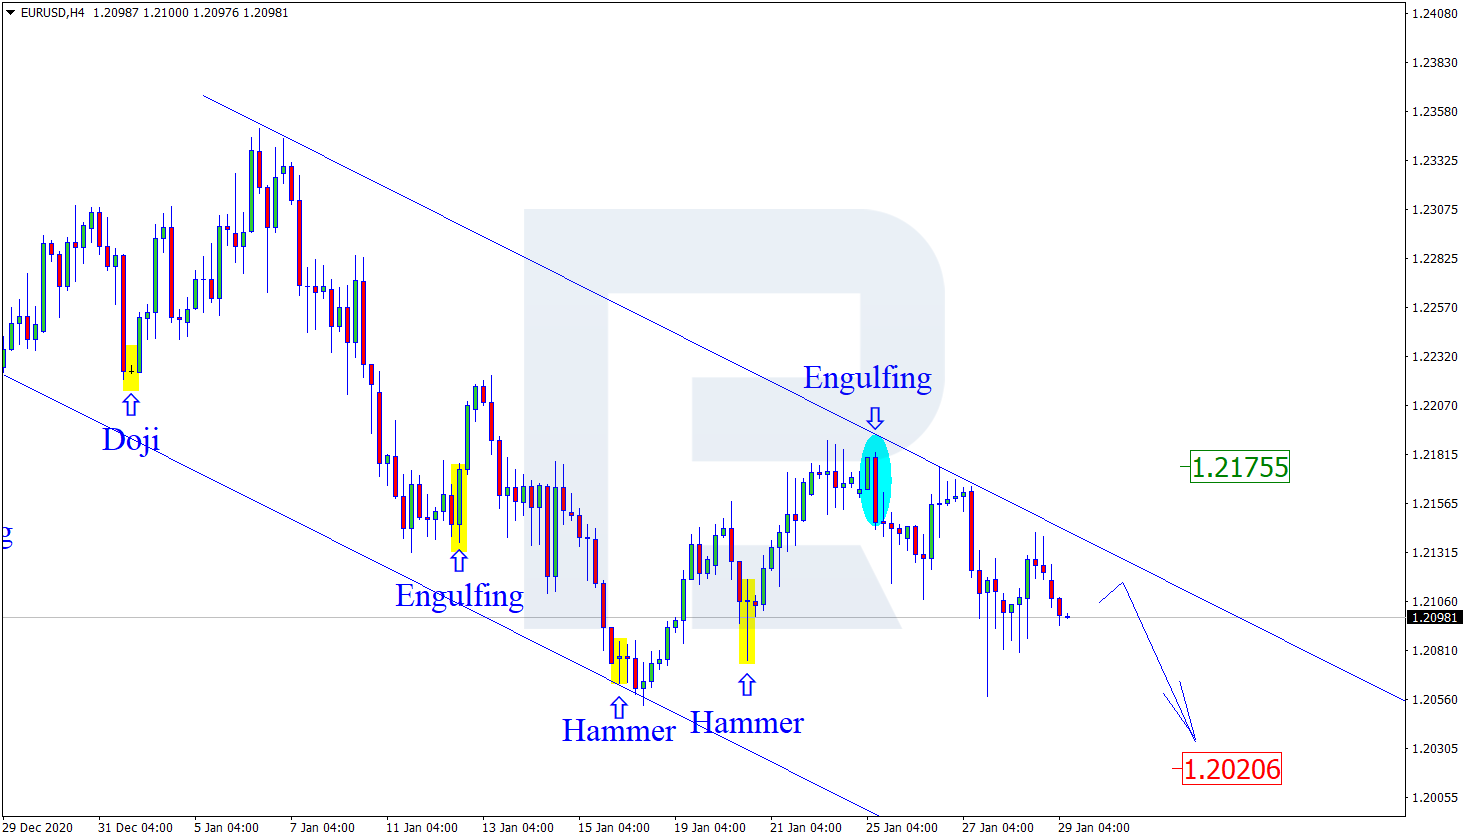
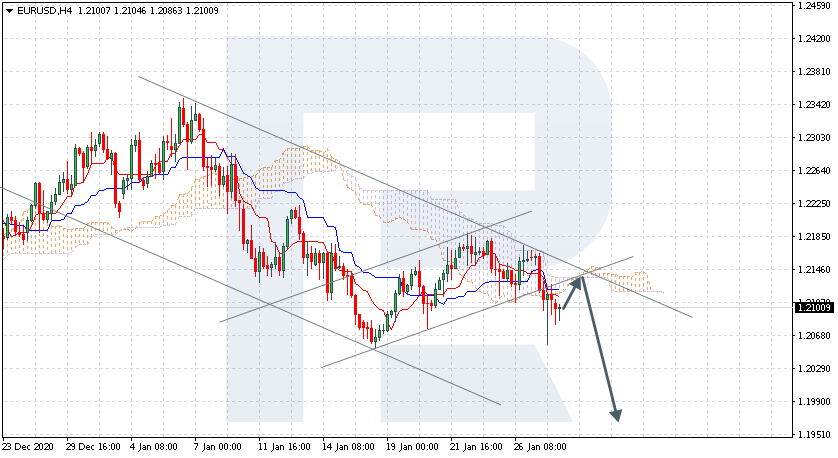
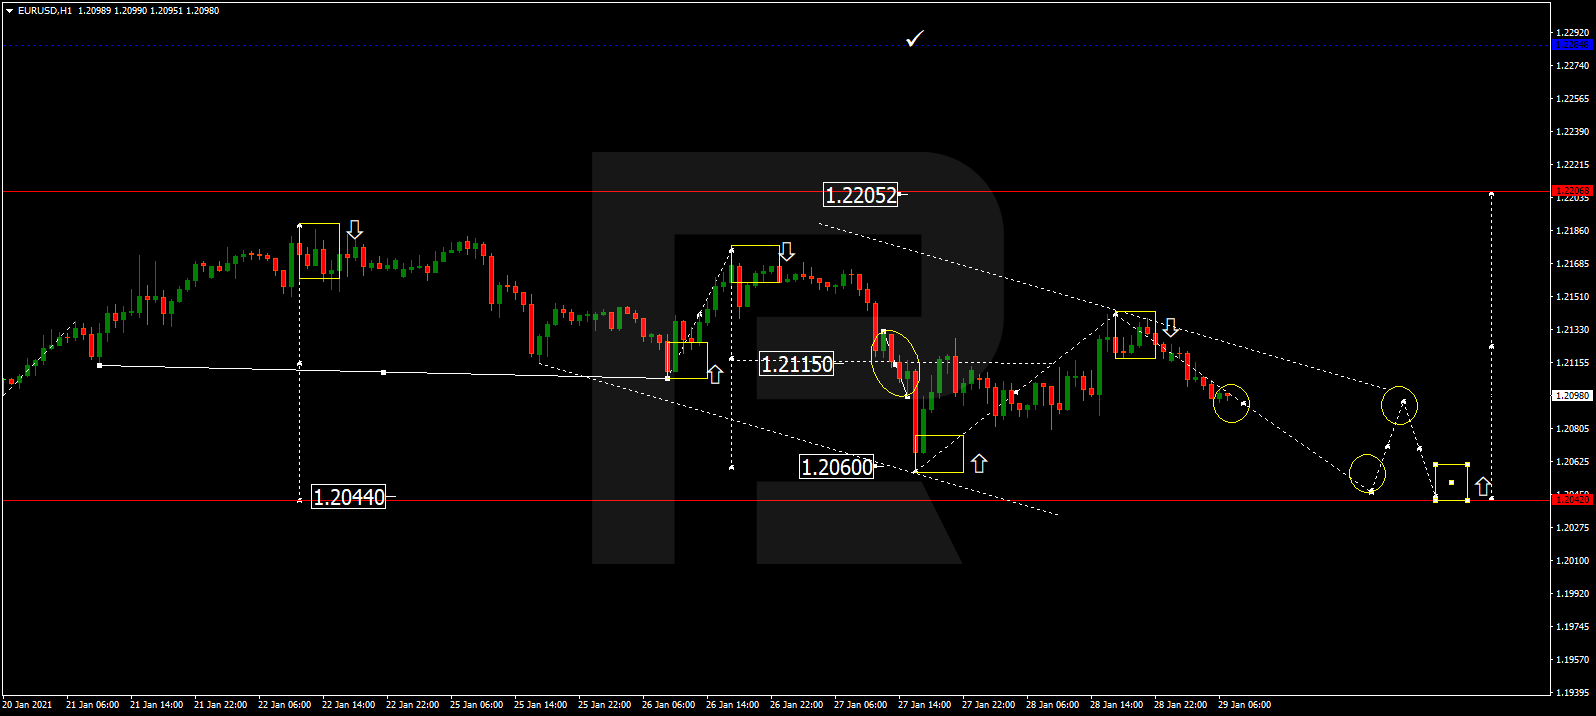
EURUSD, “Euro vs US Dollar”
After finishing the ascending wave at 1.2130, EURUSD is moving downwards. Possibly, today the pair may break 1.2100 and then continue falling with the target at 1.2044. Later, the market may start a new growth to break 1.2100 and then continue trading upwards to reach 1.2200.

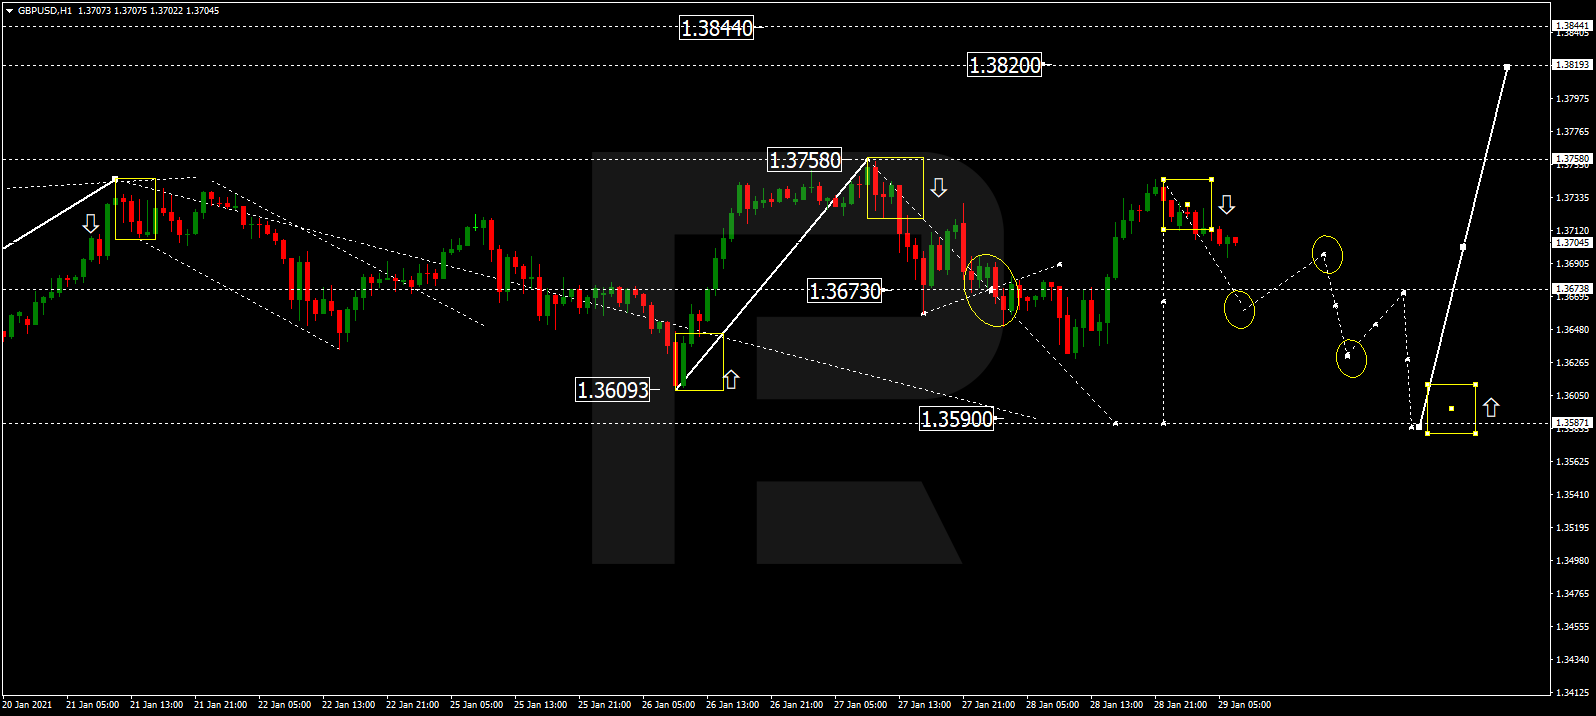
GBPUSD, “Great Britain Pound vs US Dollar”
After completing the ascending wave at 1.3740, EURUSD is expected to fall and break 1.3673. After that, the instrument may continue falling and finish the correction at 1.3590. Later, the market may form one more ascending structure to break 1.3740 and then continue trading within the uptrend with the target at 1.3820.
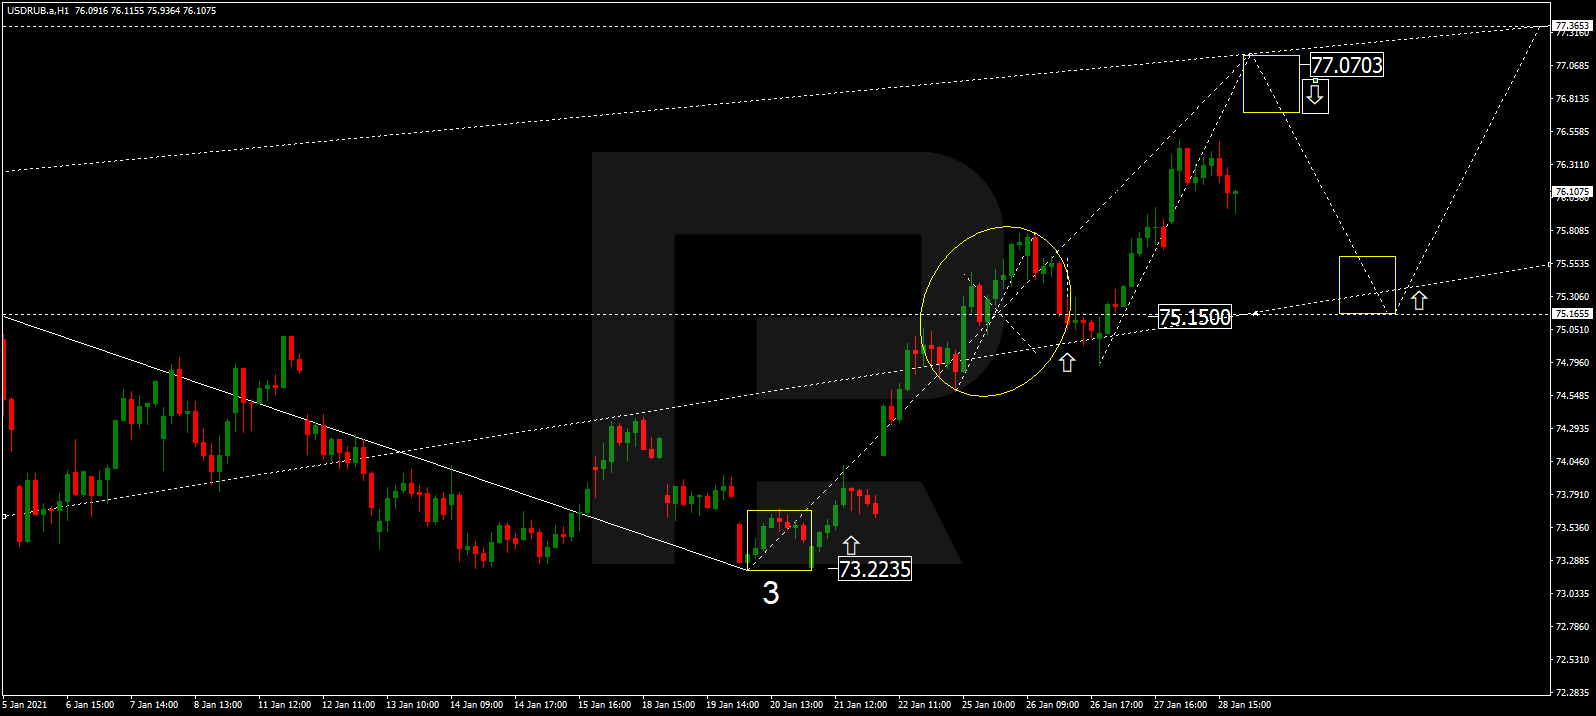
USDRUB, “US Dollar vs Russian Ruble”
After breaking 74.50, USDRUB is still correcting towards 77.07. After that, the instrument may form a new descending structure to test 75.15 from above and then resume trading upwards with the target at 77.40.
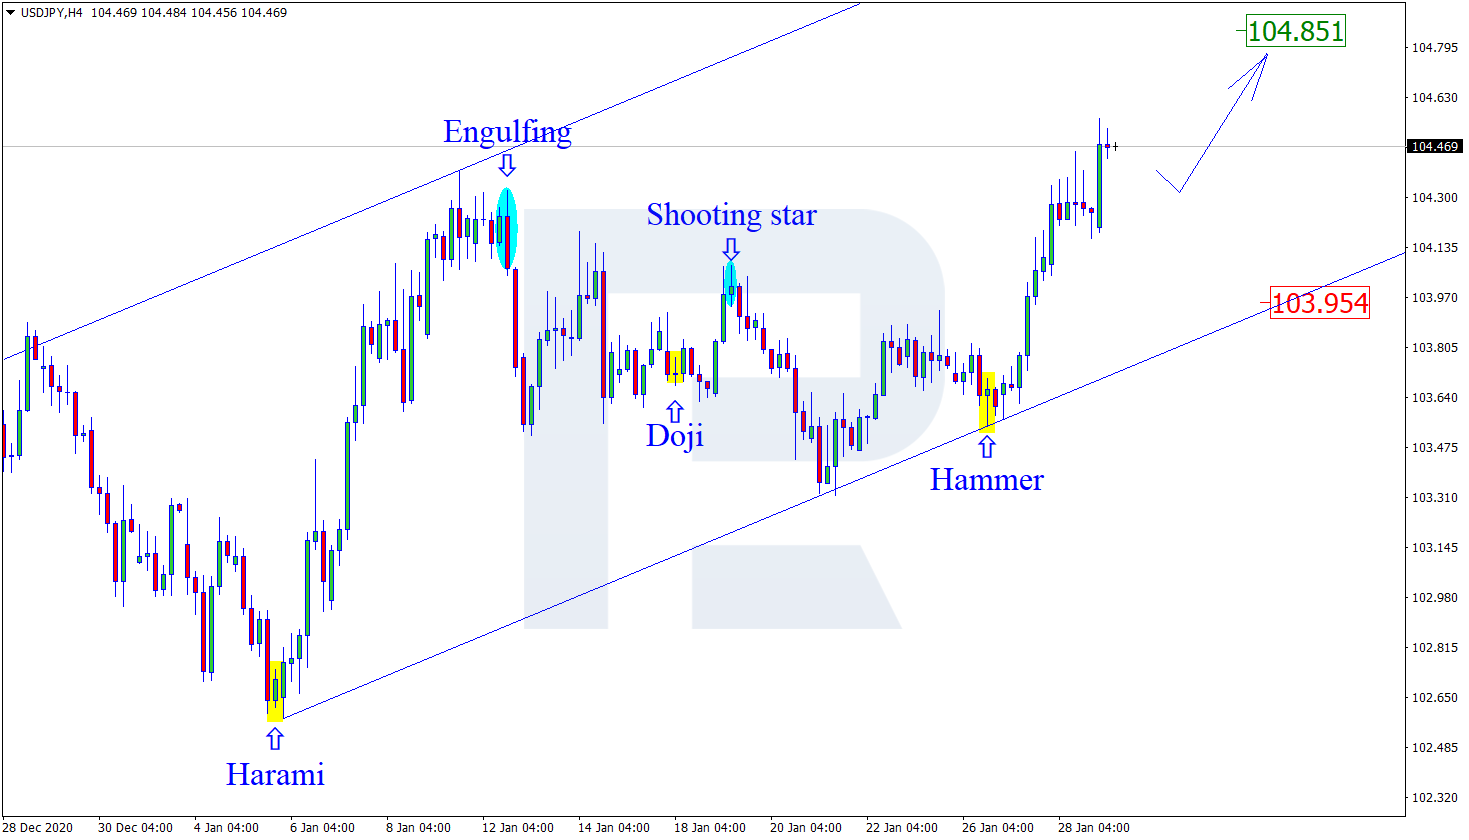
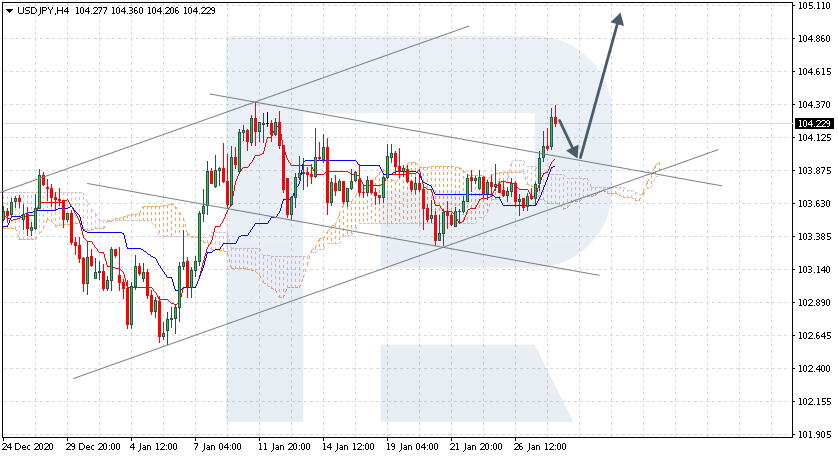
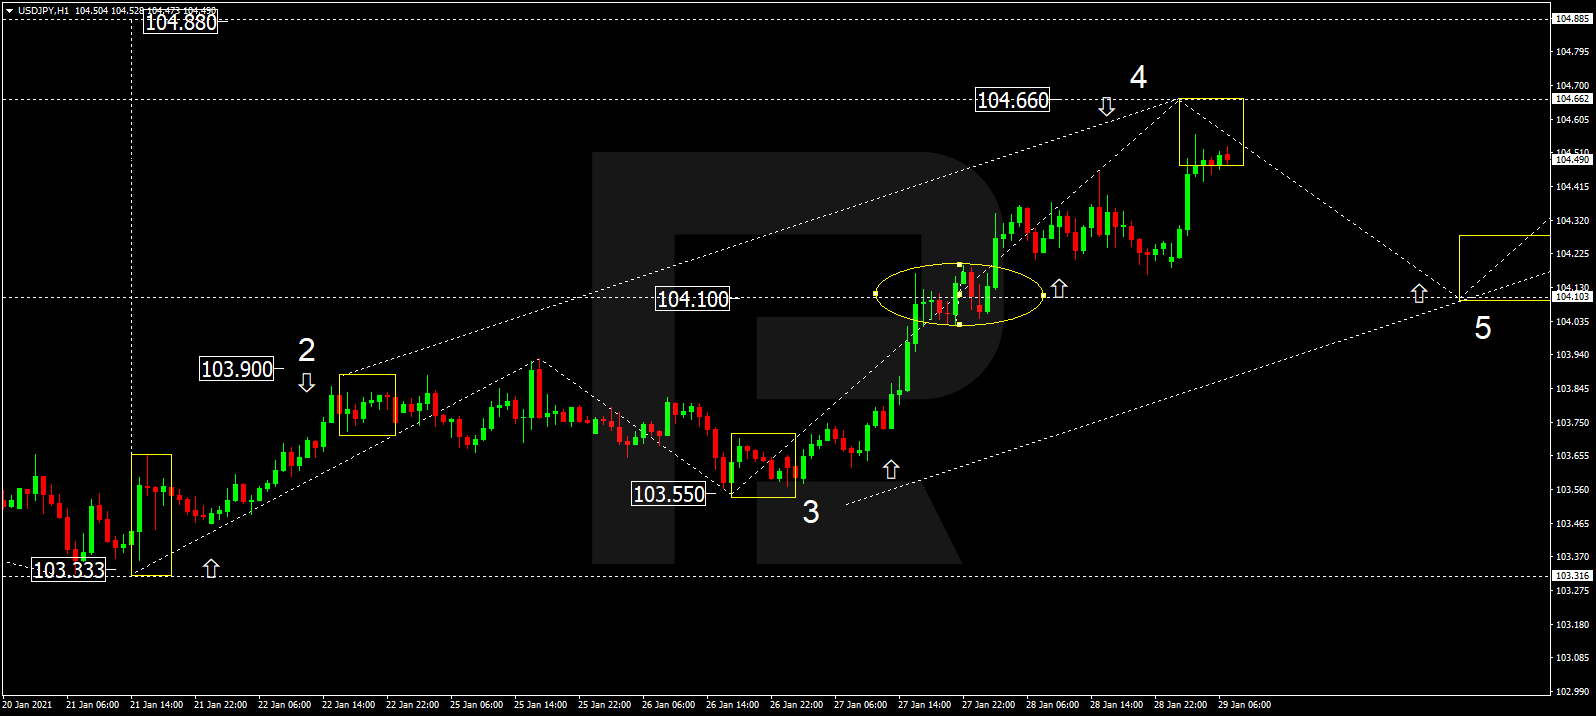
USDJPY, “US Dollar vs Japanese Yen”
USDJPY continues forming the ascending wave towards 104.66. After that, the instrument may form a new descending structure to reach 104.10 at least and then resume trading upwards with the target at 104.88.
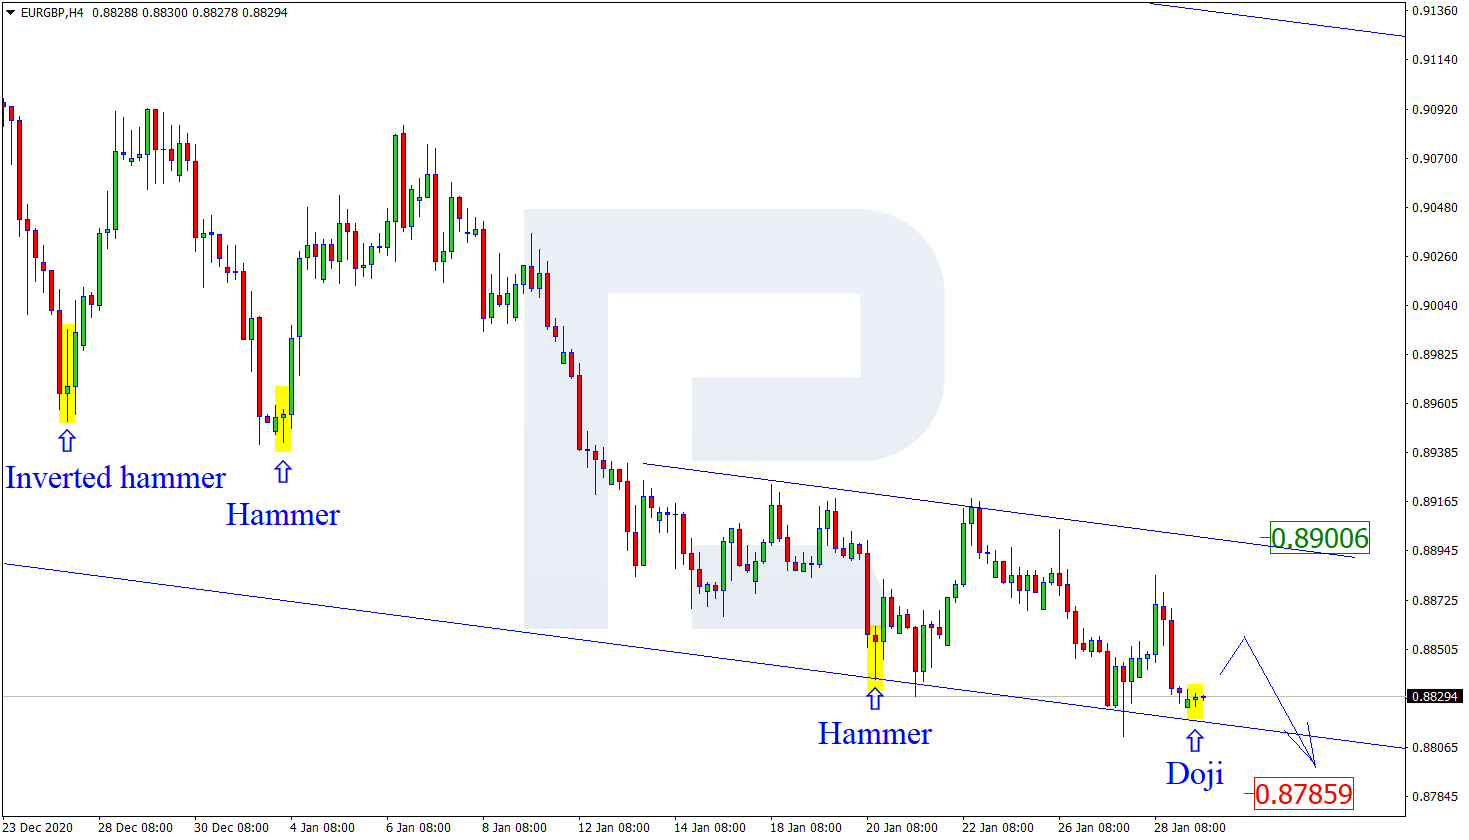
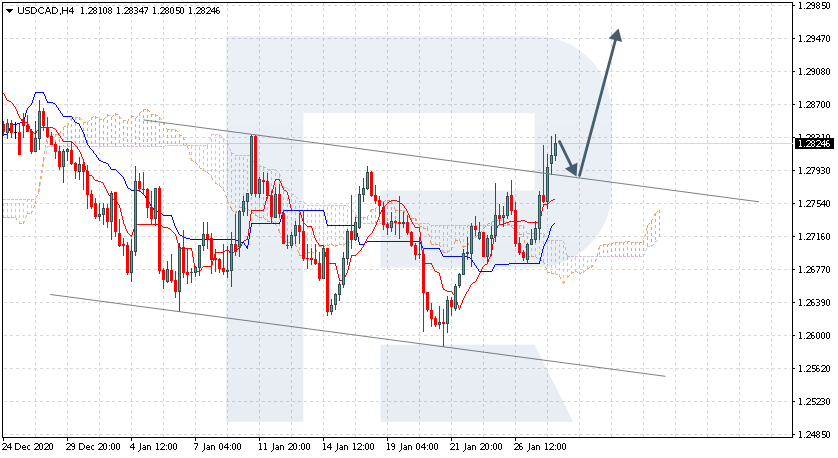
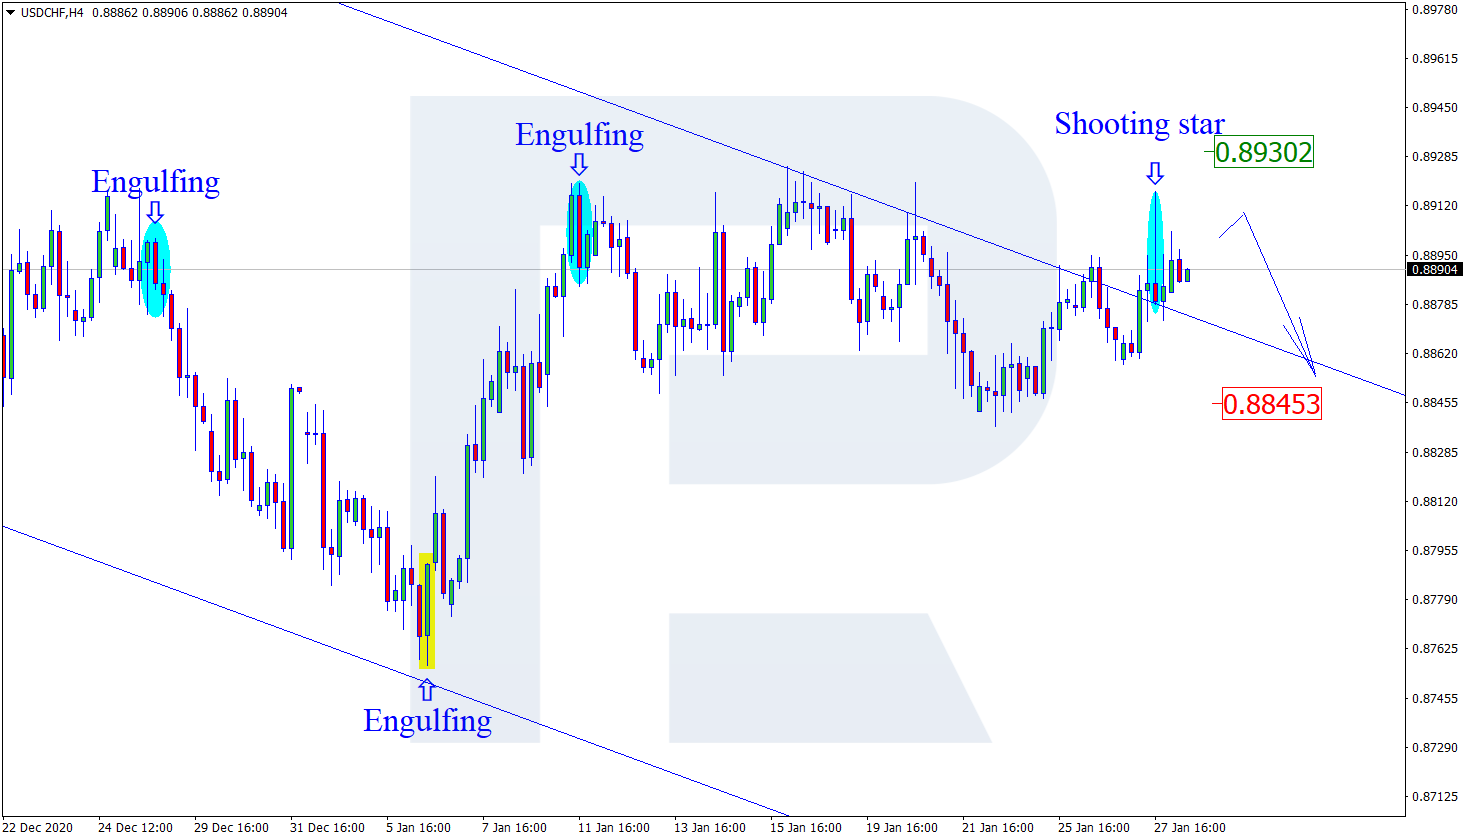
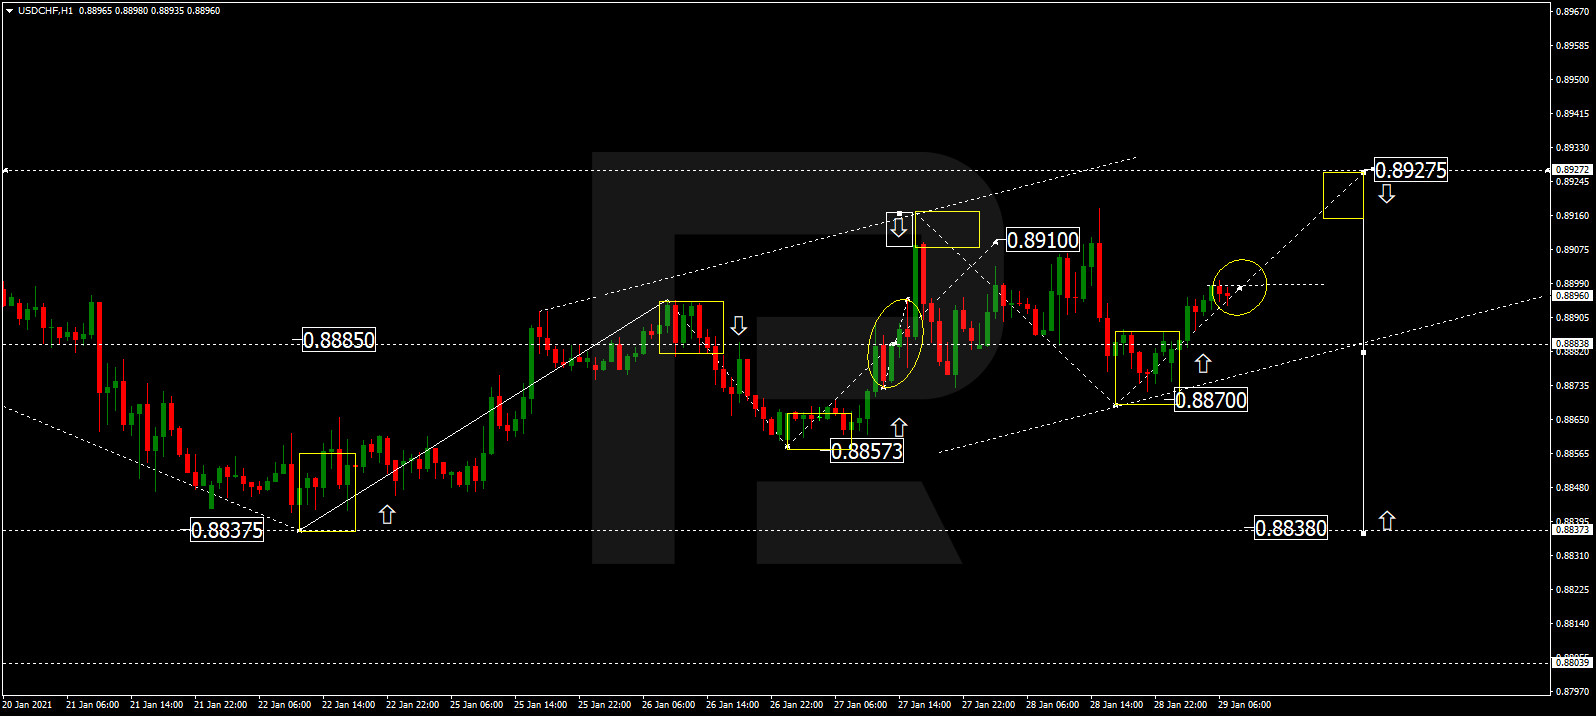
USDCHF, “US Dollar vs Swiss Franc”
After completing the descending wave at 0.8870 and forming a new consolidation range above this level, USDCHF has broken it to the upside; right now, it is growing towards 0.8927. Later, the market may form a new descending structure to break 0.8870 and then continue trading downwards with the target at 0.8838.
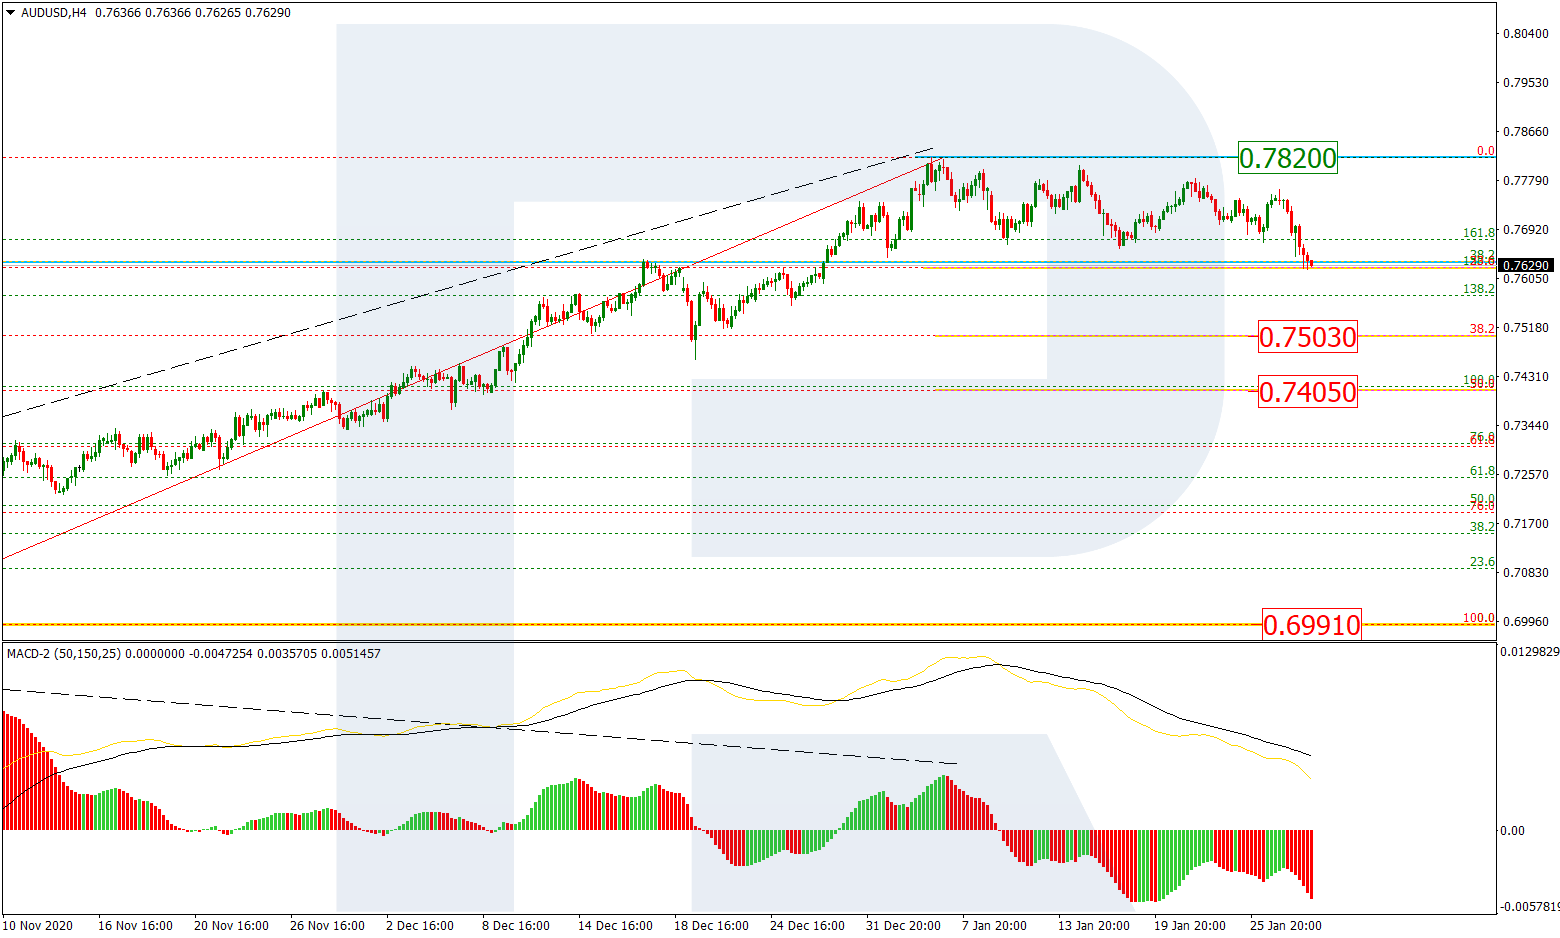
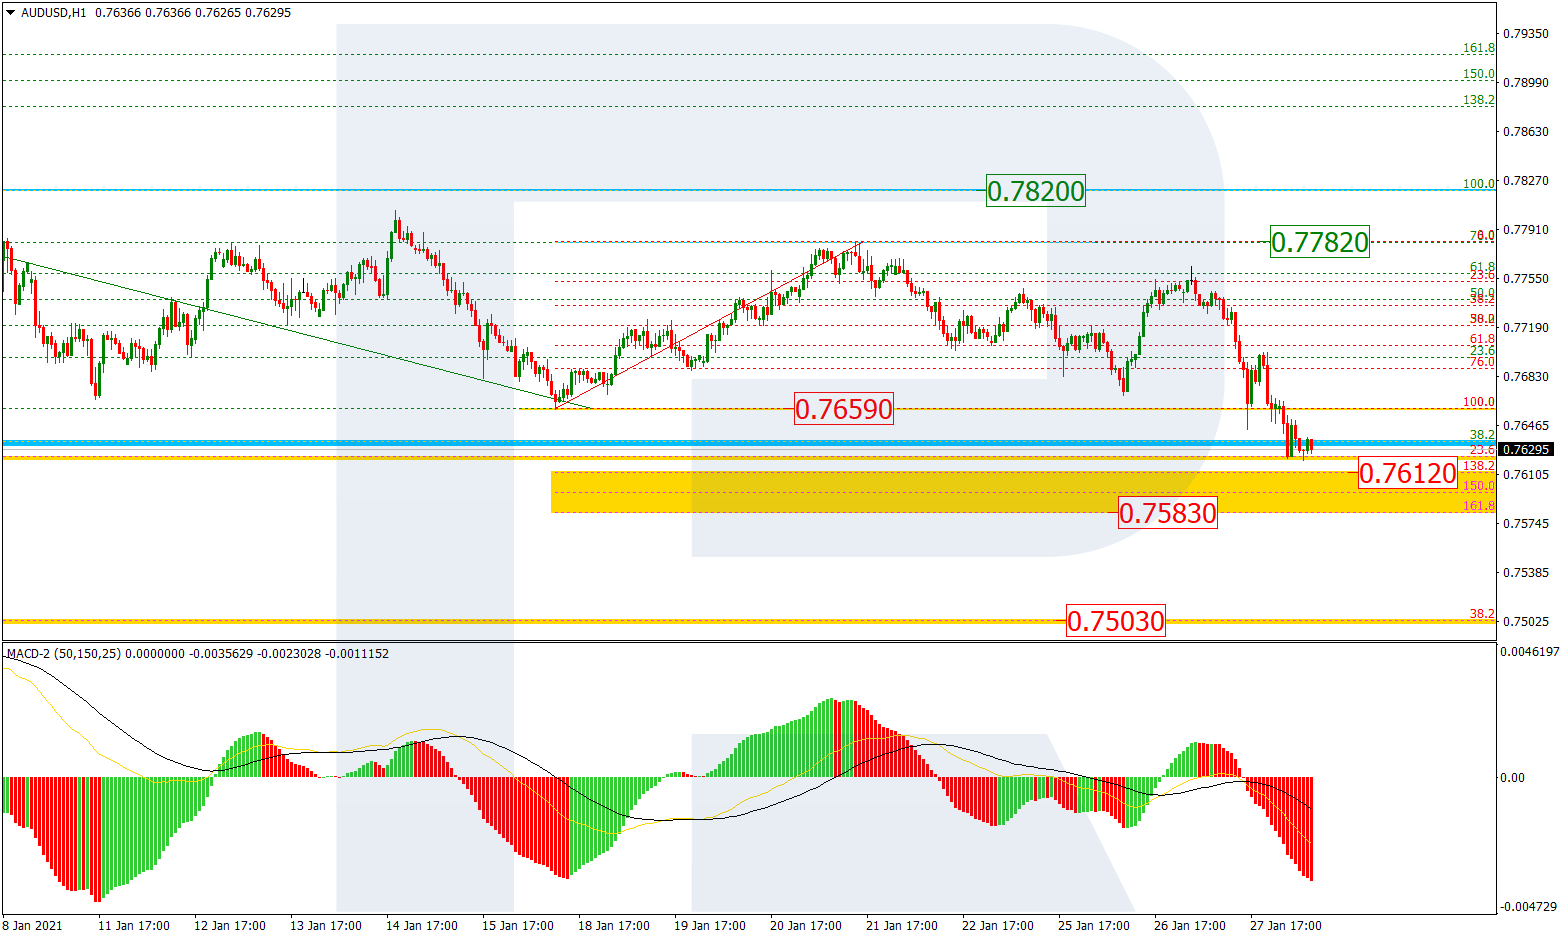
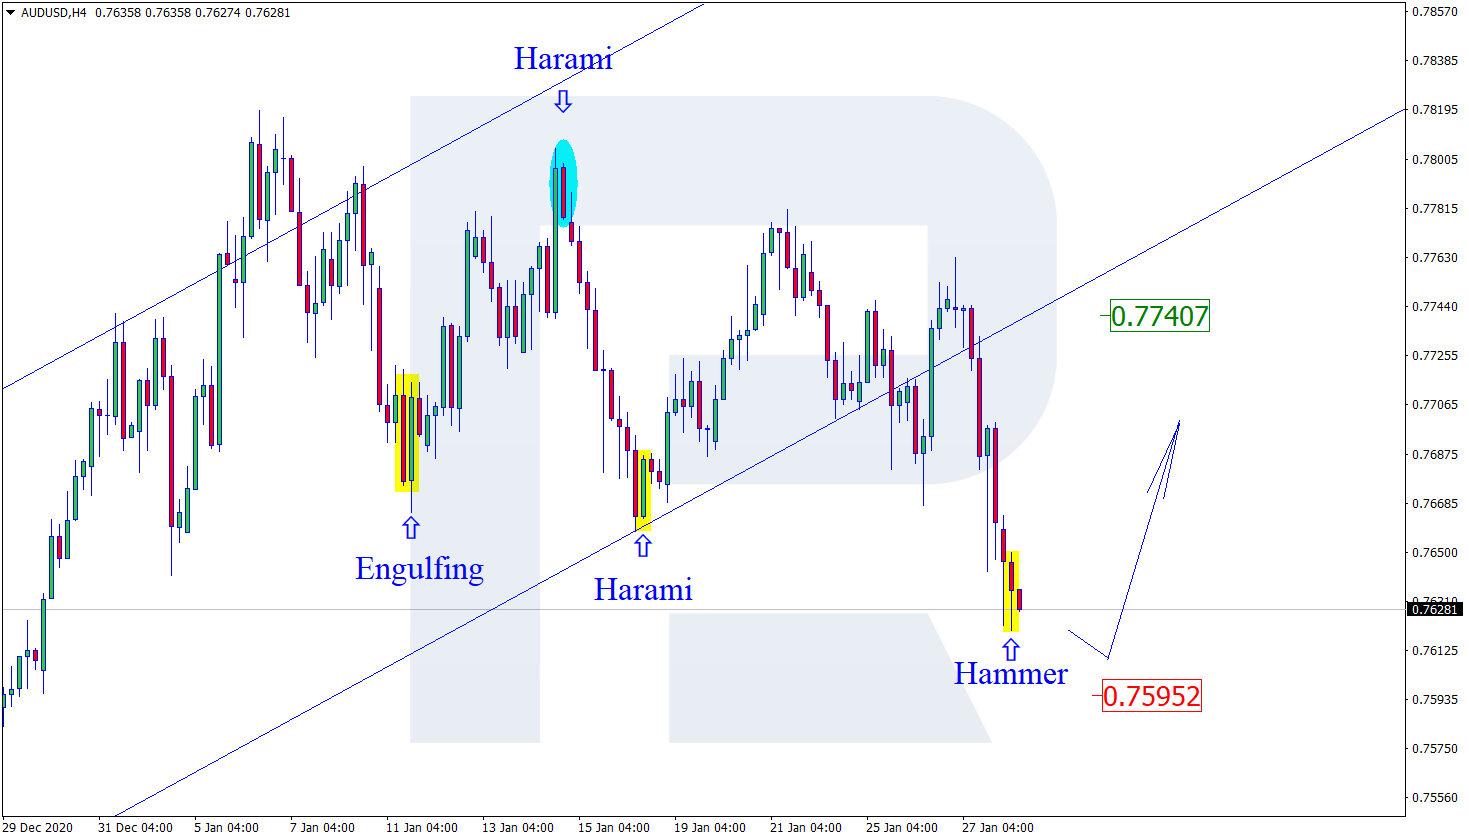
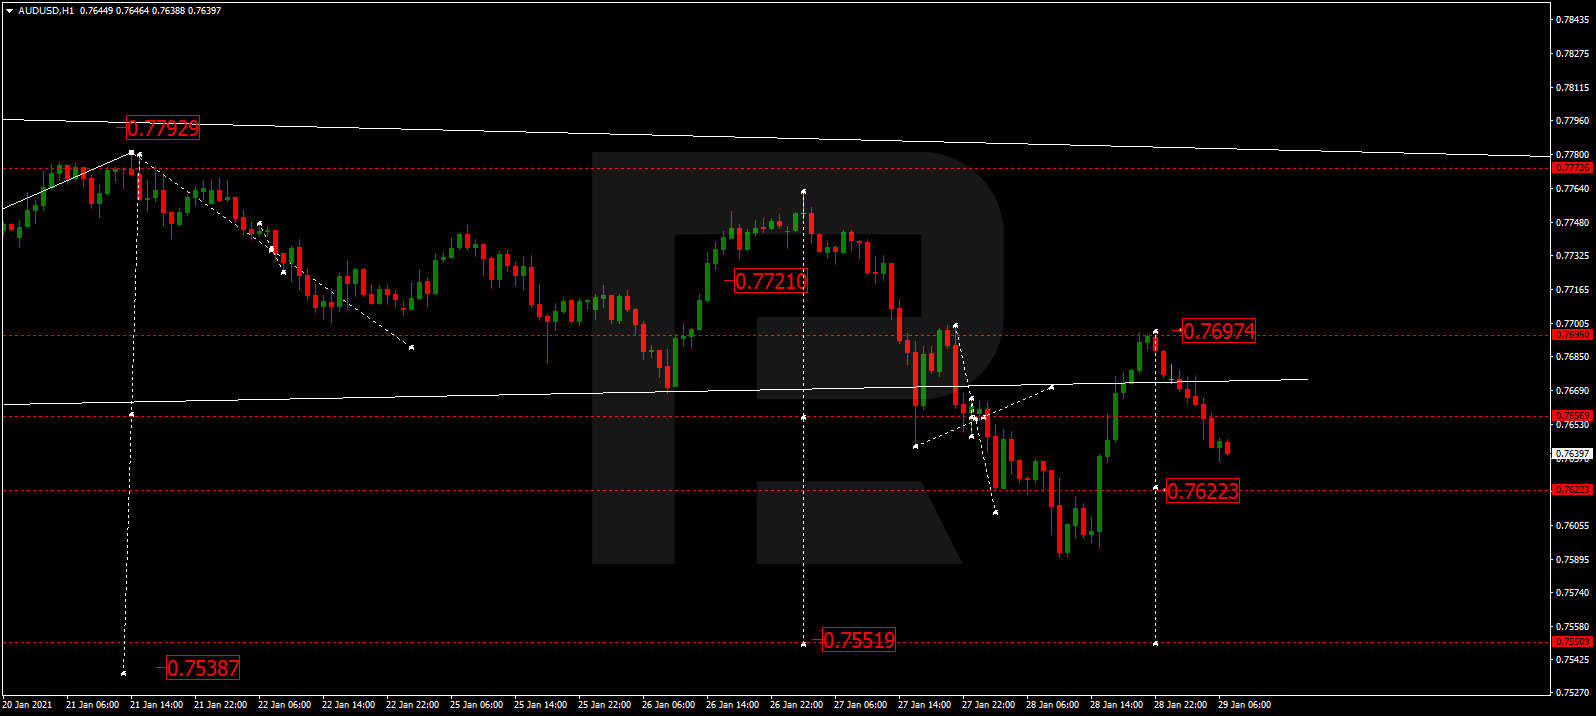
AUDUSD, “Australian Dollar vs US Dollar”
After finishing the descending wave at 0.7628, AUDUSD is growing towards 0.7694. Today, the pair may continue trading downwards with the target at 0.7552.
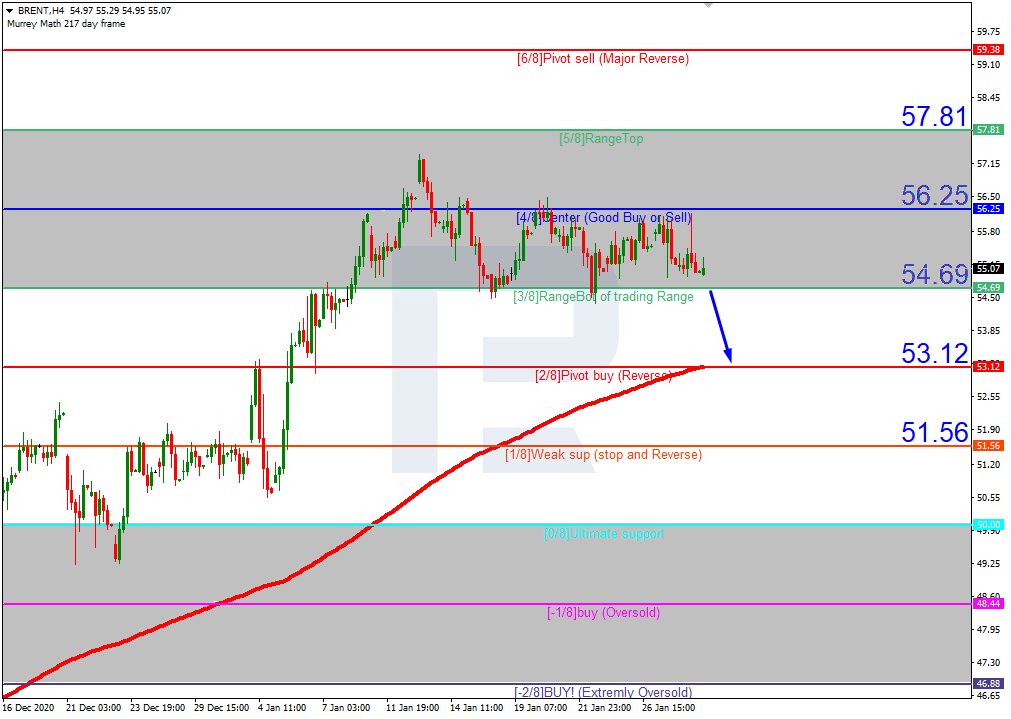
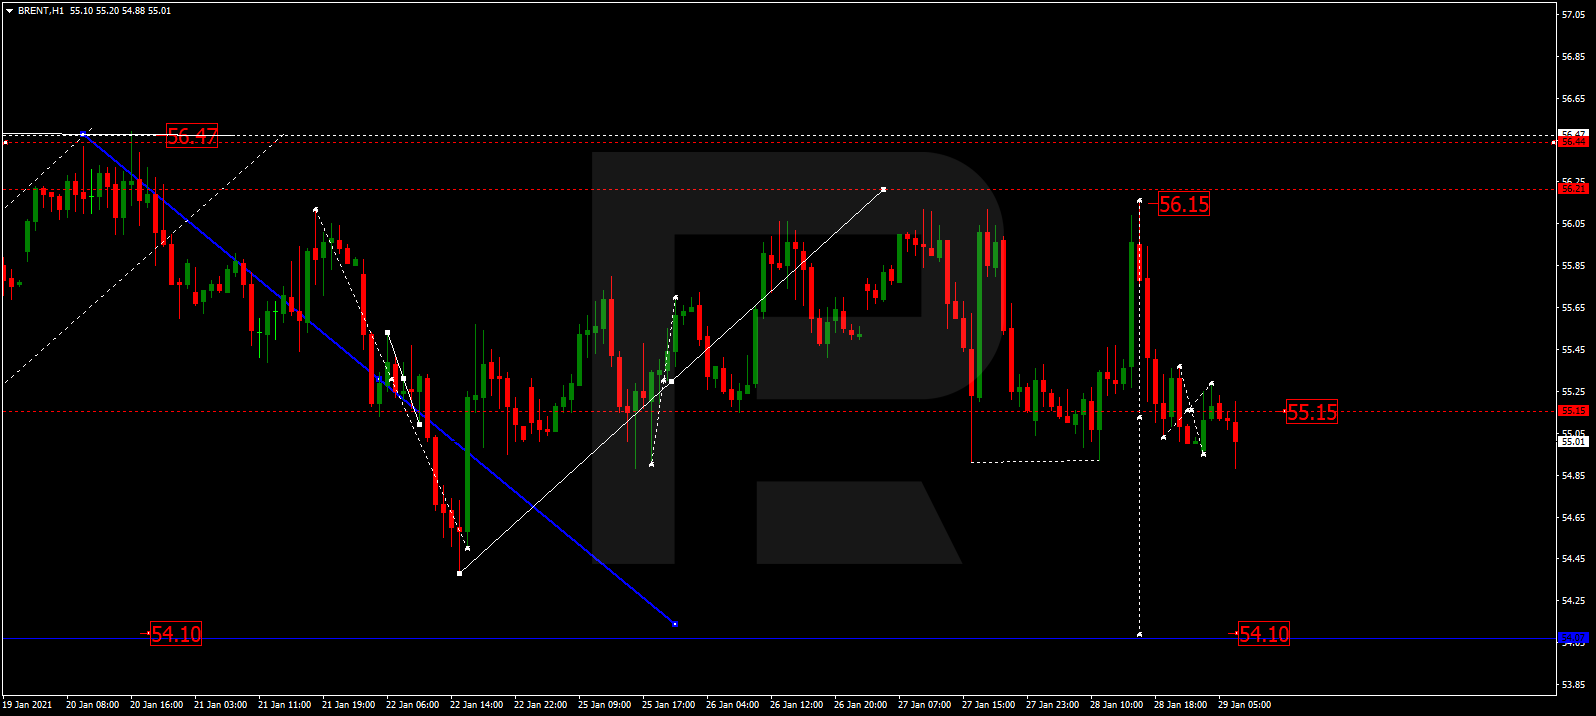
BRENT
After finishing the ascending structure at 56.15 and rebounding from this level to the downside, Brent has completed the descending wave at 55.15; right now, it is still consolidating around the latter level and this range may be considered as a downside continuation pattern. If later the price breaks this range to the downside, the market may fall to complete the correction at 54.10 and then form one more ascending structure with the target at 56.20.
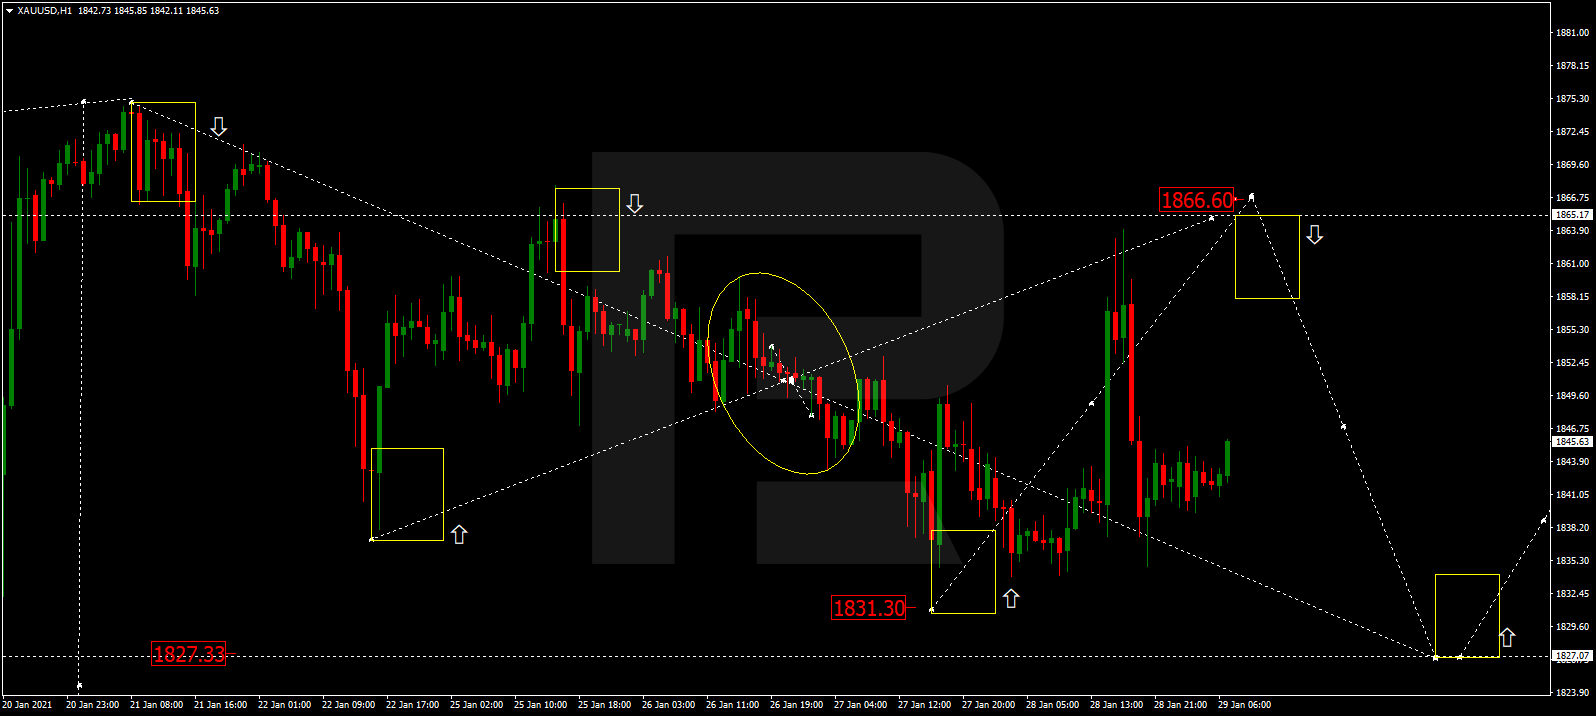
XAUUSD, “Gold vs US Dollar”
Gold is still consolidating around 1850.50. Possibly, the metal may start another growth to reach 1866.60 and then resume trading downwards with the target at 1827.87.
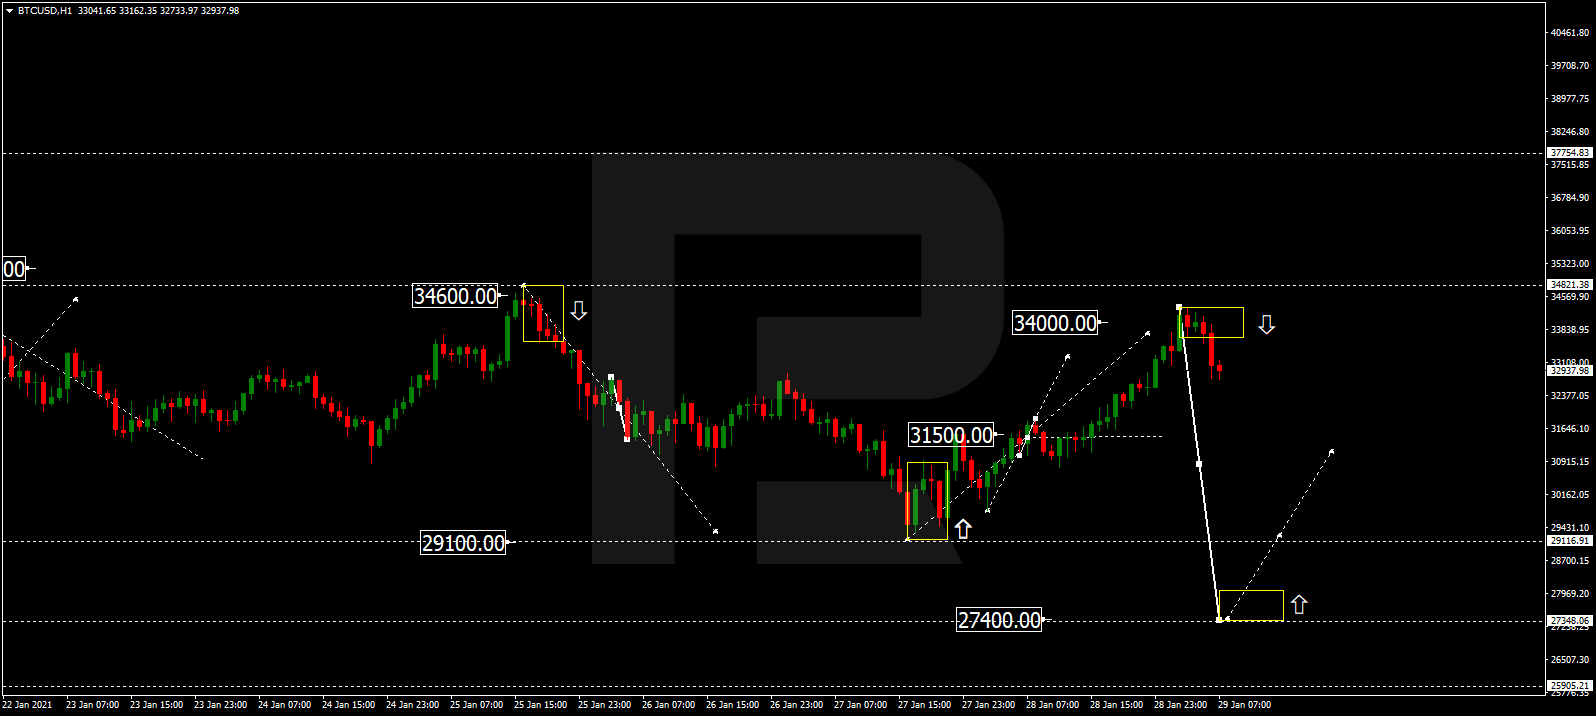
BTCUSD, “Bitcoin vs US Dollar”
After completing the ascending wave at 32000.00 and forming an upside continuation pattern, BTCUSD has extended this growth up to 34000.00; right now, it is falling to return to 32000.00. Later, the market may break this level and start another decline with the target at 27400.00.
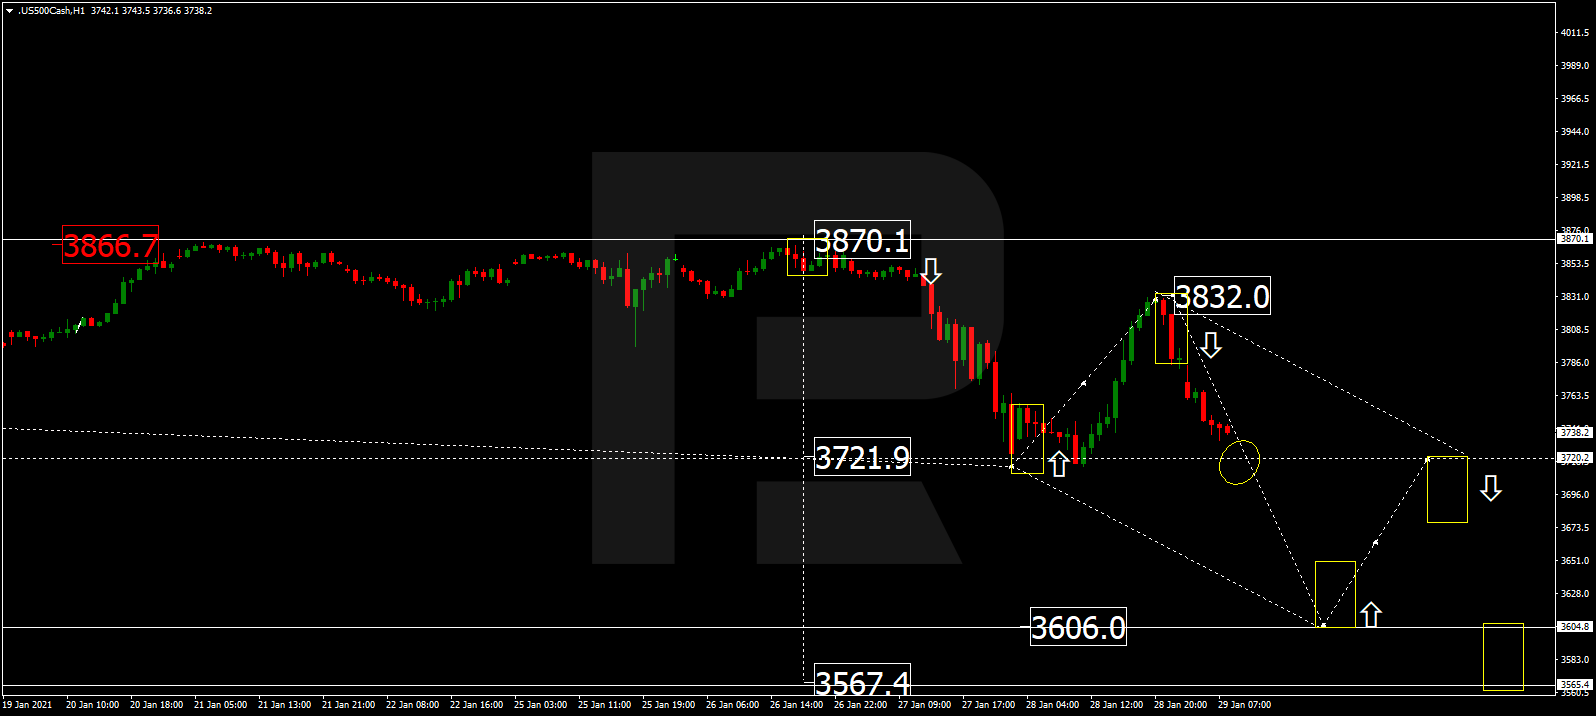
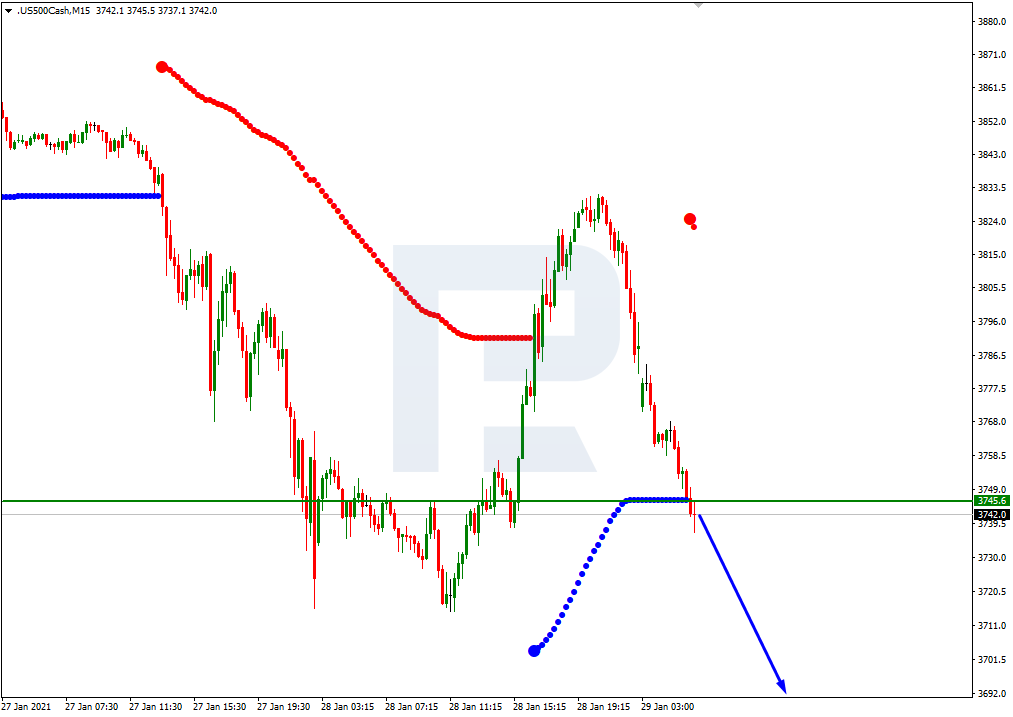
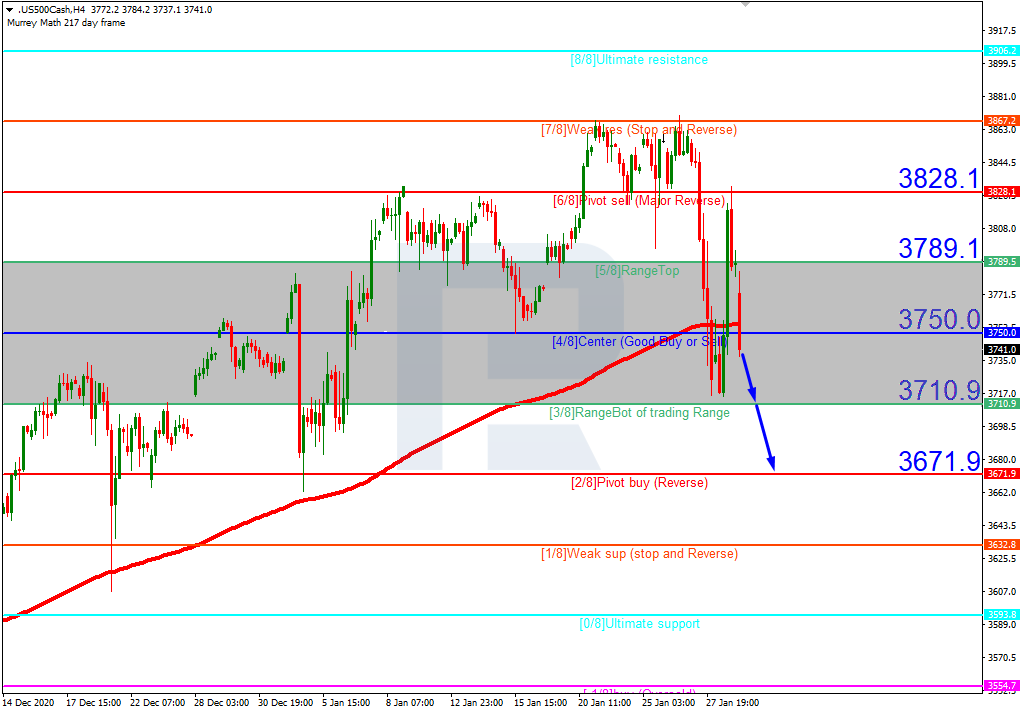
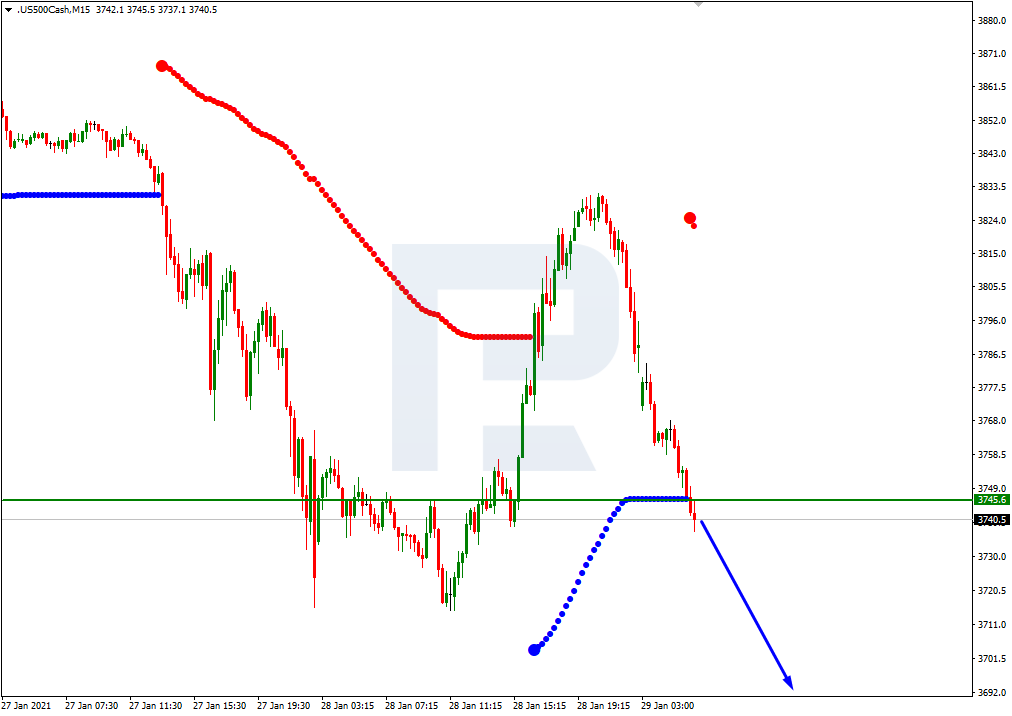
S&P 500
After finishing the correction at 3832.0, the S&P index is falling to break 3720.2. After that, the instrument may continue trading downwards with the short-term target at target at 3606.0.