rfxsignals February 15, 2021 No Comments

Daily Free Forex Signals For 15/02/2021

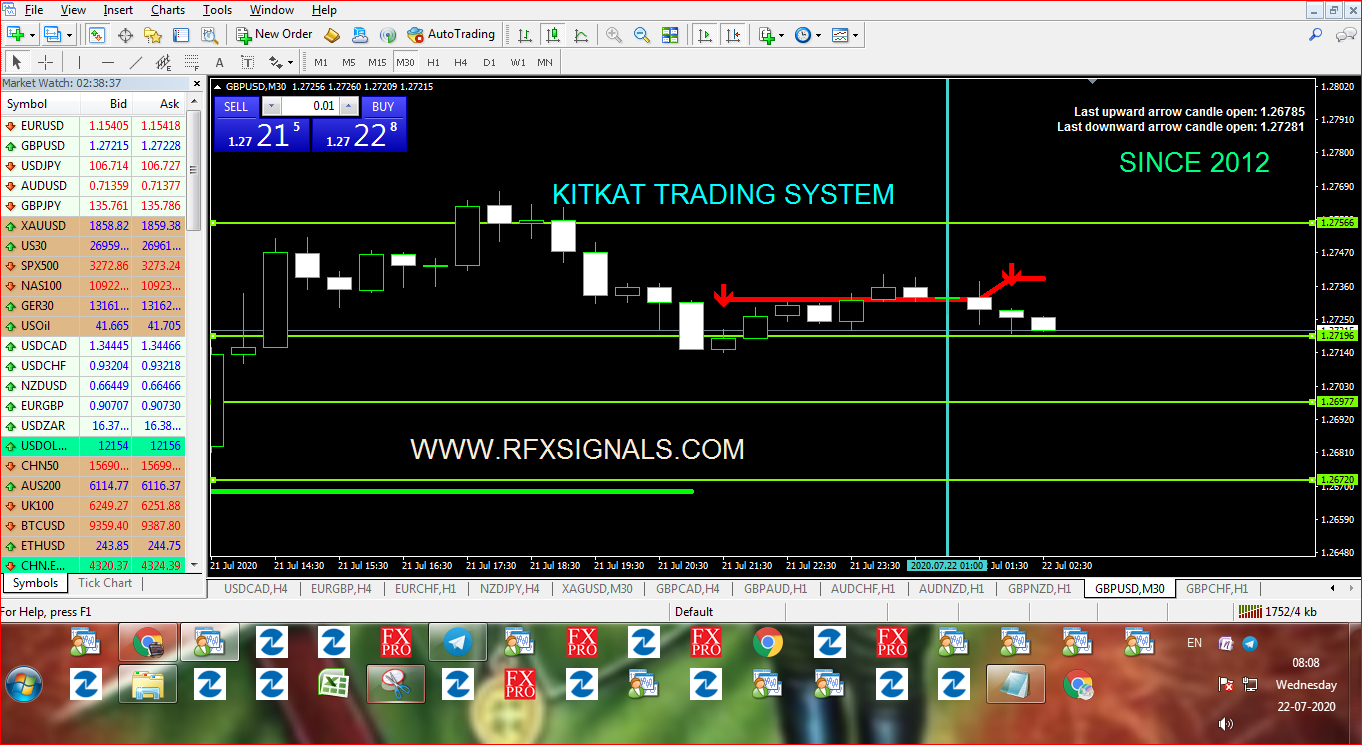
Here your going to see Daily Free Forex Signals For 15/02/2021 to free forex signal alert from our kitkat trading system and other trading logic’s .we provide like this free forex signals from 2012 on wards with more than 50,000 traders around the world .The free forex signals have 70 to 85% quality always .we give for you a note as maximum focus take profit 1 as your target and must use stop loss values .if you have any other query’s please visit our live chat or email option


EURUSD BUY – 1.21410
SL-1.20833
TP1-1.21606
TP2-1.21915

USDCAD SELL-1.26589
SL-1.27085
TP1-1.26196
TP2-1.25823

USDCHF SELL-0.89063
SL-0.89458
TP1-0.88809
TP2-0.88568

AUDNZD SELL-1.07360
SL-1.07954
TP1-1.07159
TP2-1.06892

GBPCAD SELL-1.75912
SL-1.76549
TP1-1.75634
TP2-1.75411

GBPAUD SELL-1.78513
SL-1.78840
TP1-1.78317
TP2-1.78134

GBPCHF SELL-1.23730
SL-1.24096
TP1-1.23554
TP2-1.23317

rfxsignals February 12, 2021 No Comments

EURUSD is planning to consolidate. Overview for 12.02.2021

EURUSD is planning to consolidate. Overview for 12.02.2021

12.02.2021

EURUSD has significantly grown over the second February week and may consolidate on Friday.

The major currency pair has strengthened enough to take a break and look around. The current quote for the instrument is 1.2124.

The weekly report on the Unemployment Claims in the USA showed 793K after being 812K the week before and against the expected reading of 755K. The labor market statistics remain rather mixed, although one should admit that the numbers are getting better.

The monthly report from the European Commission says that the short-term economic outlook for the Euro Area is worse than expected earlier. According to the revised data, the region’s GDP in 2021 might add 3.8% after the first estimate of 4.2%. At the same time, long-term expectations have improved: the indicator may expand by 3.8% in 2022 against the previous estimate of 3.0%.

Inflation in Europe, as per the European Commission, may show 1.4% in 2021, which is worse than the first estimate of 1.1%. For 2022, the expected reading remains the same, 1.3%.

Later today, there will be several reports that market players may find interesting. For example, the Euro Area is scheduled to publish the Industrial Production for December, which might be quite useful for understanding what to expect from the economy at the beginning of 2021. Also, the USA is planning to report on the UoM Inflation Expectations, which may reach 80.8 points in February after being 79.0 points the month before.

rfxsignals February 12, 2021 No Comments

Forex Technical Analysis & Forecast 12.02.2021

Forex Technical Analysis & Forecast 12.02.2021

12.02.2021

EURUSD, “Euro vs US Dollar”

EURUSD continues consolidating around 1.2120. Possibly, today the pair may expand the range down to 1.2114 and then start another growth to return to 1.2135. If later the price breaks this range to the upside, the market may form one more ascending structure to reach 1.2155; if to the downside – resume trading downwards with the target at 1.2088.

EURUSD
Risk Warning: the result of previous trading operations do not guarantee the same results in the future

GBPUSD, “Great Britain Pound vs US Dollar”

After breaking 1.3810, GBPUSD is still moving downwards to reach 1.3770. After that, the instrument may grow to test 1.3820 from below and then resume falling with the target at 1.3760.

GBPUSD
Risk Warning: the result of previous trading operations do not guarantee the same results in the future

USDRUB, “US Dollar vs Russian Ruble”

USDRUB is falling towards 73.40. After that, the instrument may correct to reach 74.48 and then resume falling with the target at 72.52.

USDRUB
Risk Warning: the result of previous trading operations do not guarantee the same results in the future

USDJPY, “US Dollar vs Japanese Yen”

USDJPY is growing towards 105.30 and may later start a new decline, thus forming a new consolidation range between these two levels. If the price breaks this range to the downside, the market may continue the correction towards 103.30; if to the upside – form one more ascending structure with the target at 105.90.

USDJPY
Risk Warning: the result of previous trading operations do not guarantee the same results in the future

USDCHF, “US Dollar vs Swiss Franc”

USDCHF is consolidating around 0.8903. Today, the pair may break the range to the upside and then form one more ascending structure to break 0.8975. Later, the market may continue growing with the target at 0.9070.

USDCHF
Risk Warning: the result of previous trading operations do not guarantee the same results in the future

AUDUSD, “Australian Dollar vs US Dollar”

AUDUSD is falling towards 0.7730 and may later start a new growth to reach 0.7750, thus forming a new consolidation range around the latter level. After that, the instrument may break the range to the downside and resume trading downwards with the target at 0.7666.

AUDUSD
Risk Warning: the result of previous trading operations do not guarantee the same results in the future

BRENT

Brent is falling towards 60.00 and may later grow to reach 60.70. If the price breaks the latter level to the upside, the market may continue growing towards 61.00. After that, the instrument may break this level as well and form one more ascending structure with the target at 62.50.

BRENT
Risk Warning: the result of previous trading operations do not guarantee the same results in the future

XAUUSD, “Gold vs US Dollar”

After breaking 1834.42, Gold has finished the descending wave at 1821.60. Today, the metal may break start another growth to test 1834.40 from below and then resume falling to reach 1812.00. Later, the market may form one more ascending structure with the target at 1861.30.

GOLD
Risk Warning: the result of previous trading operations do not guarantee the same results in the future

BTCUSD, “Bitcoin vs US Dollar”

After completing another ascending wave at 48800.00, BTCUSD is expected to fall towards 43666.00. After that, the instrument may grow to reach 45700.00 and form a reversal pattern there. The first downside target is at 38800.00.

BITCOIN
Risk Warning: the result of previous trading operations do not guarantee the same results in the future

S&P 500

The S&P index is still consolidating around 3917.0. Possibly, today the asset may grow to reach 3940.0 and then fall to test 3917.0 from above. Later, the market may start a new growth to complete this ascending wave at 3950.2.

S&P 500
Risk Warning: the result of previous trading operations do not guarantee the same results in the future

rfxsignals February 12, 2021 No Comments

Murrey Math Lines 12.02.2021 (Brent, S&P 500)

Murrey Math Lines 12.02.2021 (Brent, S&P 500)

12.02.2021

BRENT

In the H4 chart, Brent is trading above the 200-day Moving Average, thus indicating an ascending tendency. However, the asset has failed to fix above 7/8. In this case, the pair is expected to continue the correction to reach the closest support at 6/8. However, this scenario may no longer be valid if the price breaks the resistance at 7/8 to the upside again. After that, the instrument may continue growing towards 8/8.

BRENT_H4
Risk Warning: the result of previous trading operations do not guarantee the same results in the future

As we can see in the M15 chart, the price has broken the downside line of the VoltyChannel indicator and, as a result, may continue the descending tendency.

BRENT_M15
Risk Warning: the result of previous trading operations do not guarantee the same results in the future

S&P 500

As we can see in the H4, the S&P Index is trading above the 200-day Moving Average and has already fixed above 2/8. In this case, the asset is expected to continue growing towards the next resistance at 3/8. However, this scenario may no longer be valid if the price break 2/8 to the downside. After that, the instrument may fall to reach the support at 1/8.

S&P 500_H4
Risk Warning: the result of previous trading operations do not guarantee the same results in the future

In the M15 chart, the price may break the upside line of the VoltyChannel indicator and, as a result, continue its growth.

S&P 500_M15
Risk Warning: the result of previous trading operations do not guarantee the same results in the future

rfxsignals February 12, 2021 No Comments

Japanese Candlesticks Analysis 12.02.2021 (GOLD, NZDUSD, GBPUSD)

Japanese Candlesticks Analysis 12.02.2021 (GOLD, NZDUSD, GBPUSD)

12.02.2021

XAUUSD, “Gold vs US Dollar”

As we can see in the H4 chart, the metal is about to finish the correctional impulse. Right now, after forming several reversal patterns, such as Harami and Doji, close to the support level, XAUUSD is reversing and may resume growing towards the resistance area. In this case, the upside target will be at 1874.50. At the same time, an opposite scenario implies that the price may continue its decline towards 1800.00 before further growth.

XAUUSD
Risk Warning: the result of previous trading operations do not guarantee the same results in the future

NZDUSD, “New Zealand vs. US Dollar”

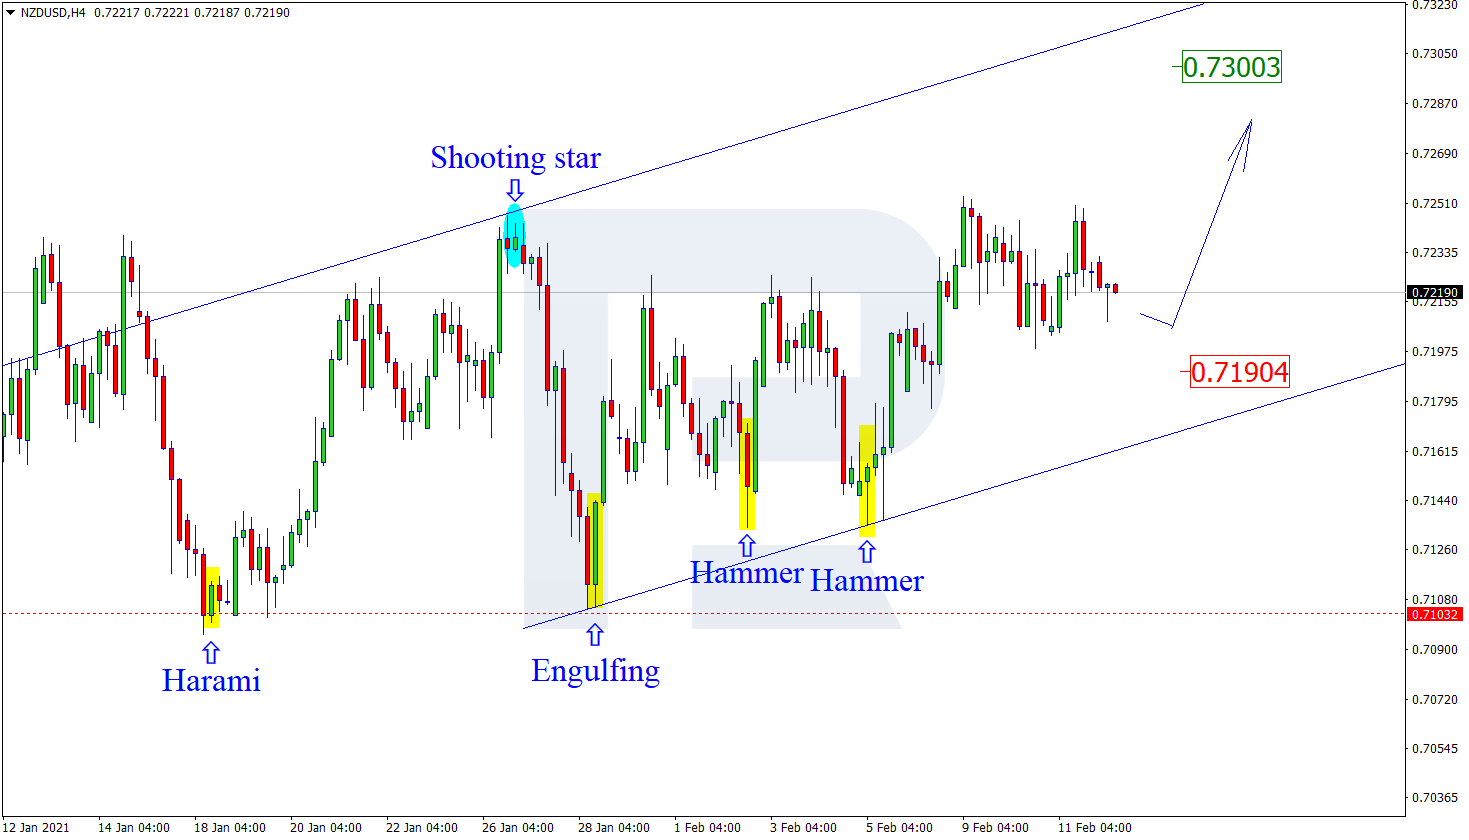
As we can see in the H4 chart, the pair is still moving upwards. Right now, after forming several reversal patterns, such as Hammer, close to the support level, NZDUSD is reversing. The upside target is the resistance area at 0.7300. However, an alternative scenario implies that the price may continue the correction towards 0.7190 before resuming the ascending impulse.

NZDUSD
Risk Warning: the result of previous trading operations do not guarantee the same results in the future

GBPUSD, “Great Britain Pound vs US Dollar”

As we can see in the H4 chart, the correction within the uptrend continues. Right now, after forming several reversal patterns, such as Shooting Star and Hanging Man, not far from the resistance area, GBPUSD is reversing. In this case, the correctional target is the support level at 1.3730. After that, the instrument may rebound and resume moving upwards to reach the upside target at 1.3910.

GBPUSD

rfxsignals February 12, 2021 No Comments

Ichimoku Cloud Analysis 12.02.2021 (LTCUSD, BRENT, USDRUB)

Ichimoku Cloud Analysis 12.02.2021 (LTCUSD, BRENT, USDRUB)

12.02.2021

LTCUSD, “Litecoin vs US Dollar”

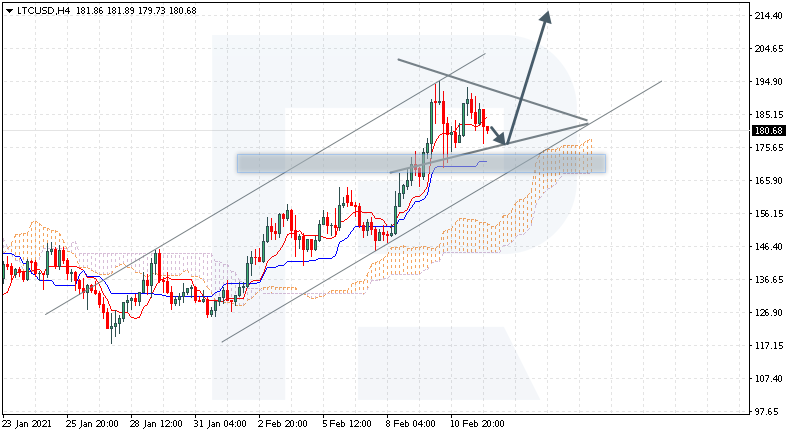
LTCUSD is trading at 180.68; the instrument is moving above Ichimoku Cloud, thus indicating an ascending tendency. The markets could indicate that the price may test Tenkan-Sen and Kijun-Sen at 176.75 and then resume moving upwards to reach 214.50. Another signal in favor of a further uptrend is a rebound from the downside border of the Triangle pattern. However, the bullish scenario may no longer be valid if the price breaks the cloud’s downside border and fixes below 135.55. In this case, the pair may continue falling towards 125.05. To confirm further growth, the asset must break the pattern’s upside border and fix above 195.05.

LTCUSD
Risk Warning: the result of previous trading operations do not guarantee the same results in the future

BRENT

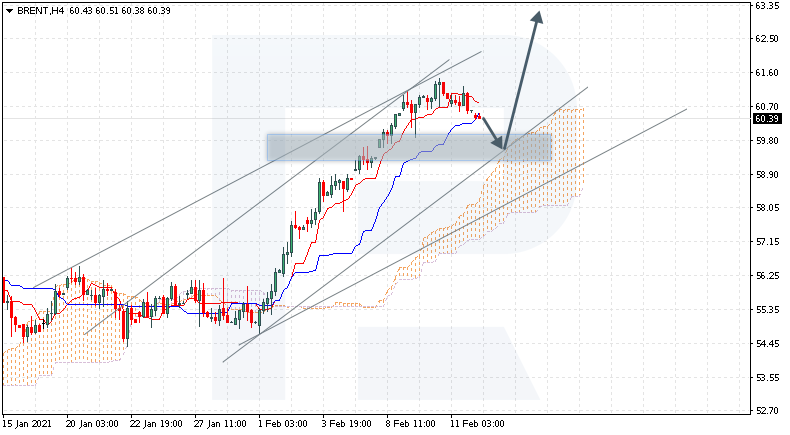
Brent is trading at 60.39; the instrument is moving above Ichimoku Cloud, thus indicating an ascending tendency. The markets could indicate that the price may test the cloud’s upside border at 58.05 and then resume moving upwards to reach 63.15. Another signal in favor of a further uptrend will be a rebound from the rising channel’s downside border. However, the bullish scenario may no longer be valid if the price breaks the cloud’s downside border and fixes below 57.05. In this case, the pair may continue falling towards 56.35.

BRENT
Risk Warning: the result of previous trading operations do not guarantee the same results in the future

USDRUB, “US Dollar vs Russian Ruble”

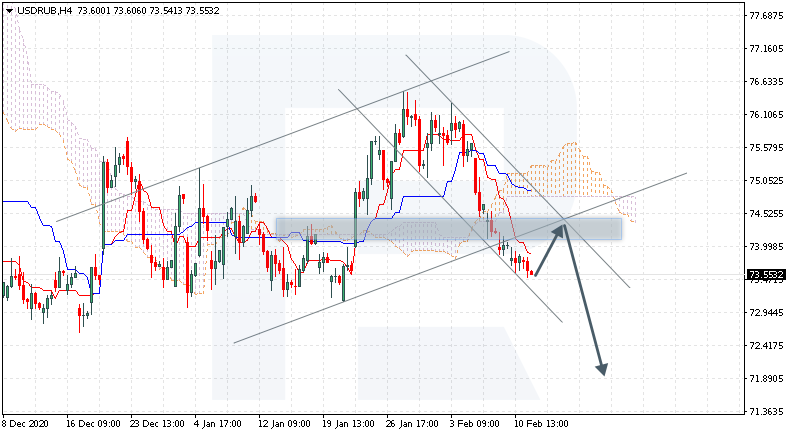
USDRUB is trading at 73.55; the instrument is moving below Ichimoku Cloud, thus indicating a descending tendency. The markets could indicate that the price may test Tenkan-Sen and Kijun-Sen at 74.05 and then resume moving downwards to reach 71.95. Another signal in favor of a further downtrend will be a rebound from the descending channel’s upside border. However, the bearish scenario may be canceled if the price breaks the cloud’s upside border and fixes above 75.75. In this case, the pair may continue growing towards 76.65. To confirm further decline, the asset must break the support area and fix below 72.75. As one can see, the price has already rebounded from this level three times.

USDRUB

rfxsignals February 12, 2021 No Comments

Fibonacci Retracements Analysis 12.02.2021 (BITCOIN, ETHEREUM)

Fibonacci Retracements Analysis 12.02.2021 (BITCOIN, ETHEREUM)

12.02.2021

BTCUSD, “Bitcoin vs US Dollar”

As we can see in the H4 chart, after failing to reach 38.2%, the descending correction transformed into a new rising wave, which, after breaking the previous high, has already entered the post-correctional extension area between 138.2% and 161.8% fibo at 47080.00 and 50213.00 respectively. At the same time, there is a divergence on MACD, which may hint at a new pullback to the downside.

BTCUSD
Risk Warning: the result of previous trading operations do not guarantee the same results in the future

The H1 chart shows a local divergence within the post-correctional extension area between 138.2% and 161.8% fibo at 47080.00 and 50213.00 respectively. The correctional downtrend may reach the previous high at 42017.50 or even 76.0% fibo at 38890.00.

BITCOIN
Risk Warning: the result of previous trading operations do not guarantee the same results in the future

ETHUSD, “Ethereum vs. US Dollar”

The H4 chart shows a stable uptrend, which may break the high at 1840.04 and then reach the post-correctional extension area between 138.2% and 161.8% fibo at 1930.90 and 2248.70 respectively. However, there is a divergence on MACD, which may hint at a new short-term correction to reach 23.6%, 38.2%, 50.0%, and 61.8% fibo at 1424.17, 1168.68, 960.19, and 753.75 respectively.

ETHEREUM
Risk Warning: the result of previous trading operations do not guarantee the same results in the future

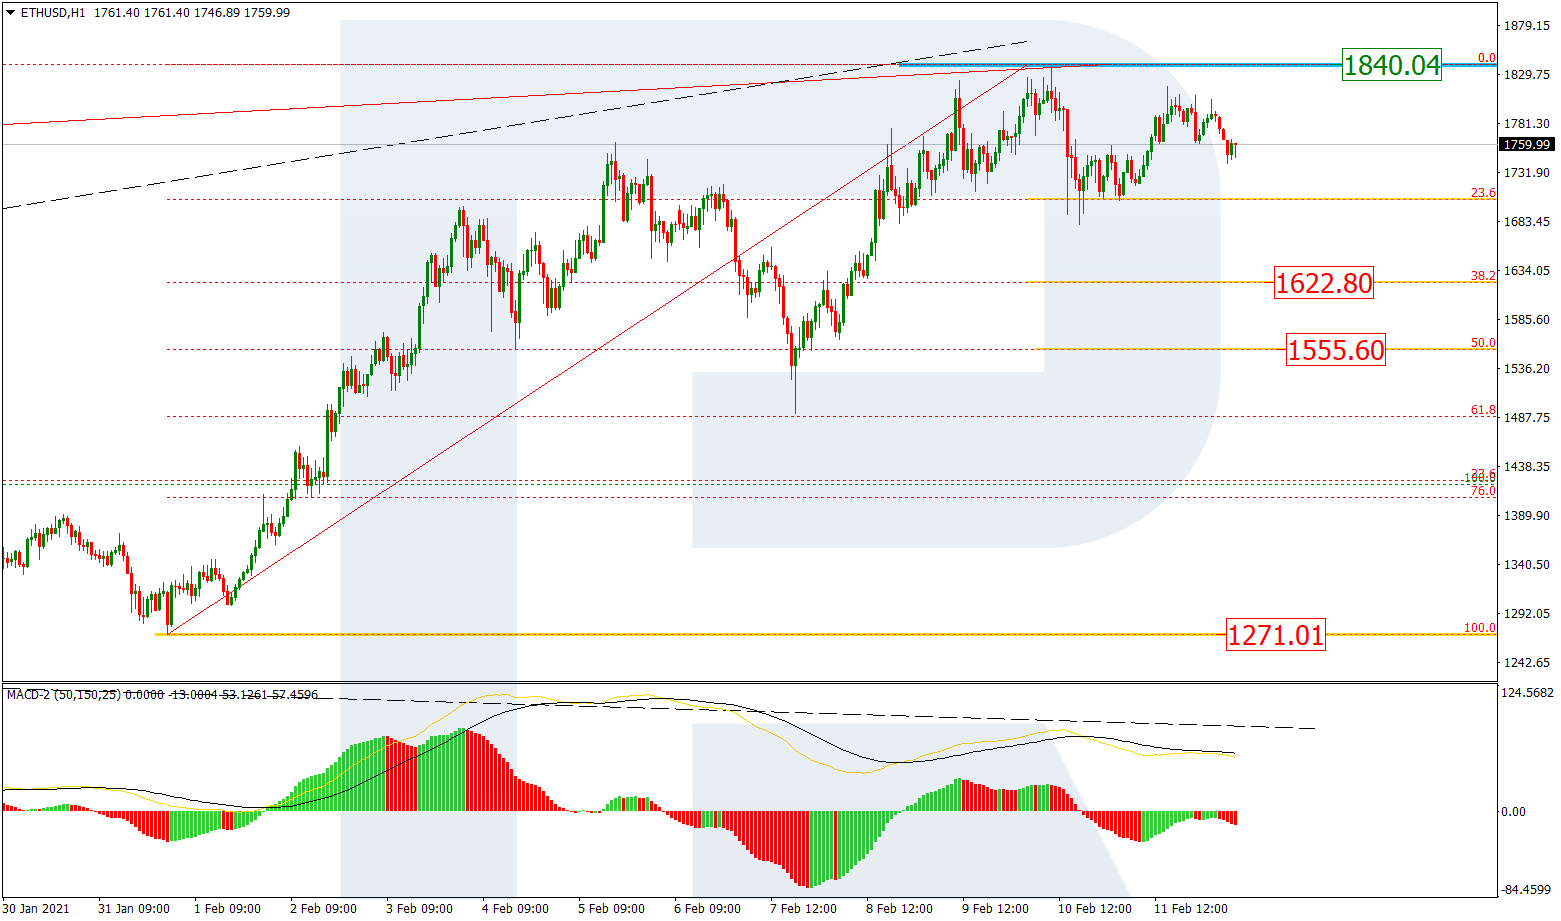
As we can see in the H1 chart, the pair is correcting after completing the ascending wave and has already reached 23.6% fibo. Later, the price may continue falling towards 38.2% and 50.0% fibo at 1622.80 and 1555.60 respectively. At the same time, a breakout of the local low at 1207.60 may hint at a further mid-term downtrend.

ETHUSD

Daily Free Forex Signals For 11/02/2021

Here your going to see Daily Free Forex Signals For 11/02/2021 to free forex signal alert from our kitkat trading system and other trading logic’s .we provide like this free forex signals from 2012 on wards with more than 50,000 traders around the world .The free forex signals have 70 to 85% quality always .we give for you a note as maximum focus take profit 1 as your target and must use stop loss values .if you have any other query’s please visit our live chat or email option

EURUSD BUY -1.21301
SL-1.20946
TP1-1.21516
TP2-1.21689

USDCHF SELL-0.88984
SL-0.89377
TP1-0.88788
TP2-0.88625

AUDUSD BUY -0.77507
SL-0.77191
TP1-0.77736
TP2-0.77929

NZDUSD BUY -0.72305
SL-0.72050
TP1-0.72492
TP2-0.72664

EURGBP BUY -0.87723
SL-0.87278
TP1-0.87930
TP2-0.88116

EURAUD SELL-1.56459
SL-1.56810
TP1-1.56293
TP2-1.56108

GBPCHF SELL-1.23039
SL-1.23584
TP1-1.22842
TP2-1.22637

AUDCAD BUY-0.98275
SL-0.97943
TP1-0.98493
TP2-0.98646

#mt4 #forex #forextrader #trading #forextrading #bitcoin #trader #cryptocurrency #forexlifestyle #entrepreneur #crypto #forexsignal #investment #business #binaryoption #passiveincome #daytrader #btc

rfxsignals February 11, 2021 No Comments

The Euro has reached its two-week highs. Overview for 11.02.2021

The Euro has reached its two-week highs. Overview for 11.02.2021

11.02.2021

EURUSD keeps its positive momentum and intends to continue rising.
The major currency pair remains optimistic on Thursday. the current quote for the instrument is 1.2120.

The Consumer Price Index in the USA showed 0.3% m/m in January, the same as expected, after being 0.4% m/m in December. On YoY, the indicator was 1.4% against 1.5% over the same period of time. The Core CPI remained unchanged, although it was expected to show 0.2% m/m.

Market players had been waiting for the statistics on inflation for a long time: the report might have been another reason for US Congress to approve the stimulus plan for the country’s economy. The plan will be approved anyway but more reasons in favor of it will only help. In the next several months, there might be a local increase in the price pressure but it should influence Congress’ stance. There are other factors, such as the weak employment sector, which prevents salaries and wages from growing.

In this speech last night, the US Federal Reserve Chairman Jerome Powell said that the regulator’s attitude towards the global stimulus plan remained unchanged – it would stay the same until the economy recovered completely, which means that the Fed’s interest rates have nothing to worry about for quite some time. Apart from everything else, the regulator signaled on several occasions in the past that inflation might exceed the target level of 2% but it was okay because the country’s economy should try to recover by itself.

It was no news for the “greenback”, that’s why EURUSD continued moving towards balancing.

Later in the evening, the USA is scheduled to report on the Unemployment Claims for the previous week, which may support the USD

rfxsignals February 11, 2021 No Comments

Forex Technical Analysis & Forecast 11.02.2021

Forex Technical Analysis & Forecast 11.02.2021

11.02.2021

EURUSD, “Euro vs US Dollar”

EURUSD continues consolidating. Possibly, today the pair may break the range to reach 1.2088 and then start another growth towards 1.2155. Later, the market may form a new descending structure to break 1.2055 and then continue trading downwards with the target at 1.1944.

EURUSD
Risk Warning: the result of previous trading operations do not guarantee the same results in the future

GBPUSD, “Great Britain Pound vs US Dollar”

GBPUSD is still consolidating around 1.3820. Possibly, the pair may break the range to reach 1.3760 and then start another growth towards 1.3810, thus forming a reversal pattern there. After that, the instrument may break 1.3760 to the downside and then continue trading downwards with the target at 1.3500.

GBPUSD
Risk Warning: the result of previous trading operations do not guarantee the same results in the future

USDRUB, “US Dollar vs Russian Ruble”

USDRUB has completed the descending wave at 73.63. Today, the pair may consolidate not far from this level. If later the price breaks this range to the downside, the market may resume falling with the short-term target at 71.50; if to the upside – start a new correction to reach 75.00.

USDRUB
Risk Warning: the result of previous trading operations do not guarantee the same results in the future

USDJPY, “US Dollar vs Japanese Yen”

USDJPY has completed the descending wave at 104.40; right now, it is consolidating around this level. If later the price breaks this range to the downside, the market may start a new decline towards 103.30; if to the upside – form one more ascending structure with the target at 105.00.

USDJPY
Risk Warning: the result of previous trading operations do not guarantee the same results in the future

USDCHF, “US Dollar vs Swiss Franc”

USDCHF has reached its downside target at 0.8903. Today, the pair may consolidate around this level. After that, the instrument may break the range to the upside and then form one more ascending structure with the target at 0.8970.

USDCHF
Risk Warning: the result of previous trading operations do not guarantee the same results in the future

AUDUSD, “Australian Dollar vs US Dollar”

AUDUSD has finished the ascending wave at 0.7755; right now, it is consolidating below this level. Possibly, the pair may break the range to the downside and then resume trading downwards with the target at 0.7655.

AUDUSD
Risk Warning: the result of previous trading operations do not guarantee the same results in the future

BRENT

Brent is still consolidating around 61.00. Today, the asset may grow to reach 61.77 and then start a new correction towards 60.00. Later, the market may form one more ascending structure with the target at 62.50.

BRENT
Risk Warning: the result of previous trading operations do not guarantee the same results in the future

XAUUSD, “Gold vs US Dollar”

Gold is still consolidating around 1840.00. Today, the metal may break the range to the downside and start a new correction towards 1823.50. Later, the market may form one more ascending structure to reach 1860.70 and then resume falling with the target at 1823.00.

GOLD
Risk Warning: the result of previous trading operations do not guarantee the same results in the future

BTCUSD, “Bitcoin vs US Dollar”

After breaking 45100.00 to the downside, BTCUSD is expected to continue falling towards 38800.00. After that, the instrument may return to 45100.00 and test it from below.

BITCOIN
Risk Warning: the result of previous trading operations do not guarantee the same results in the future

S&P 500

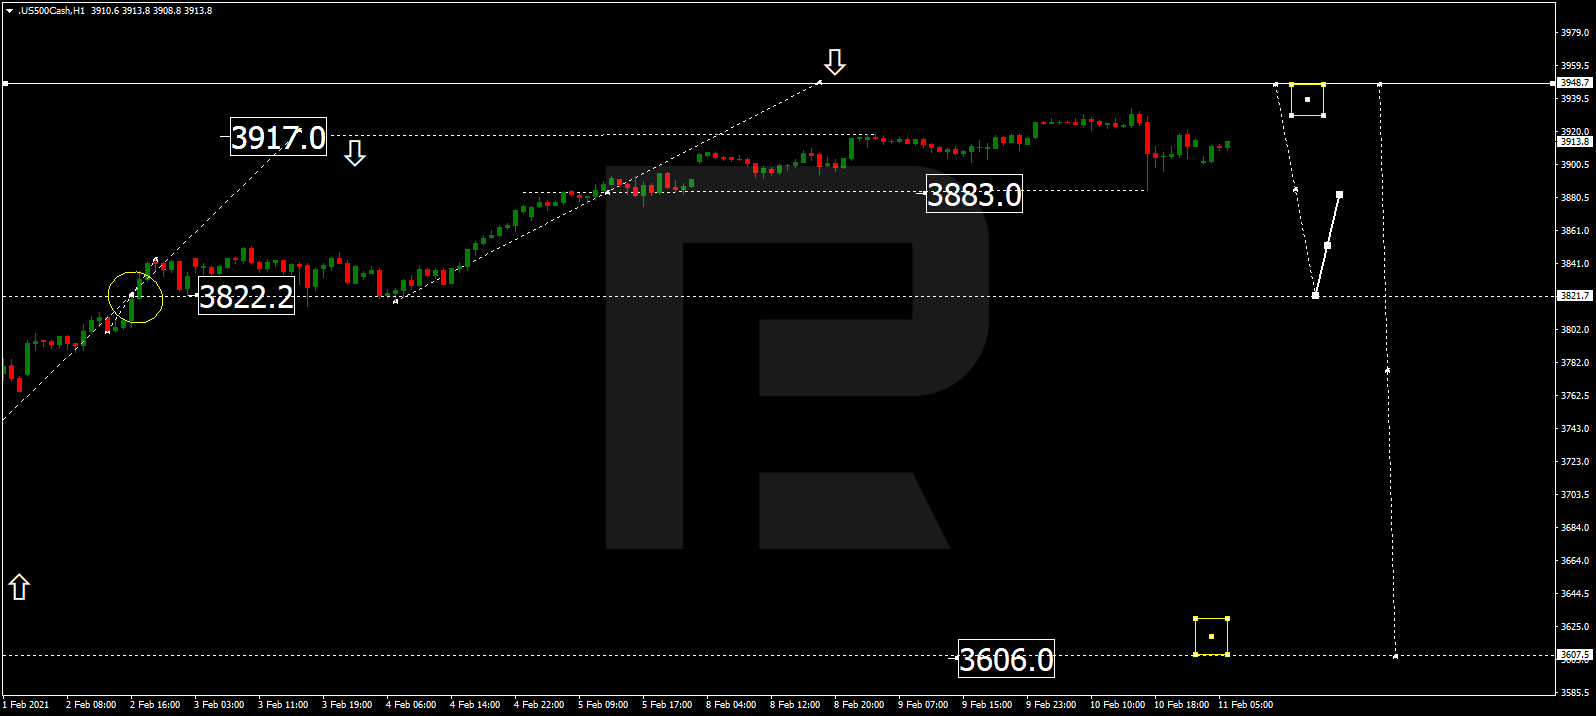
After completing the correctional structure at 3883.0, the S&P index is consolidating above it. If later the price breaks this range to the downside, the market may start a new correction towards 3822.0; if to the upside – form one more ascending structure with the target at 3950.2.
S&P 500