rfxsignals February 11, 2021 No Comments

Murrey Math Lines 11.02.2021 (USDCHF, GOLD)

Murrey Math Lines 11.02.2021 (USDCHF, GOLD)

11.02.2021

USDCHF, “US Dollar vs Swiss Franc”

In the H4 chart, after breaking the 200-day Moving Average, USDCHF is trading below it, thus indicating a tendency reversal and a further decline. In this case, the price is expected to break 3/8 and then continue falling to reach the support at 2/8. Still, this scenario may no longer be valid if the price breaks 4/8 to the upside. After that, the instrument may grow to reach the resistance at 5/8.

USDCHF_H4
Risk Warning: the result of previous trading operations do not guarantee the same results in the future

As we can see in the M15 chart, the pair has broken the downside line of the VoltyChannel indicator and, as a result, may continue the descending tendency.

USDCHF_M15
Risk Warning: the result of previous trading operations do not guarantee the same results in the future

XAUUSD, “Gold vs US Dollar”

As we can see in the H4 chart, XAUUSD has rebounded from the 200-day Moving Average once again. In this case, the price is expected to break 1/8 and then continue falling to reach the support at 0/8. However, this scenario may no longer be valid if the price breaks the resistance at 3/8 to the upside. After that, the instrument may continue growing towards 5/8.

XAUUSD_H4
Risk Warning: the result of previous trading operations do not guarantee the same results in the future

In the M15 chart, the price may break the downside line of the VoltyChannel indicator and, as a result, continue falling.

XAUUSD_M15

rfxsignals February 11, 2021 No Comments

Japanese Candlesticks Analysis 11.02.2021 (EURUSD, USDJPY, EURGBP)

Japanese Candlesticks Analysis 11.02.2021 (EURUSD, USDJPY, EURGBP)

11.02.2021

EURUSD, “Euro vs. US Dollar”

As we can see in the H4 chart, the ascending tendency continues. Right now, after forming several reversal patterns, including Harami, close to the support level, EURUSD may reverse and start a new growth. In this case, the upside target may be at 1.2210. However, an alternative scenario implies that the price may correct to reach 1.2050 before testing 1.2210.

EURUSD
Risk Warning: the result of previous trading operations do not guarantee the same results in the future

USDJPY, “US Dollar vs. Japanese Yen”

As we can see in the H4 chart, USDJPY is testing the channel’s downside border; earlier, it formed a Hammer reversal pattern. Judging by the previous movements, one may assume that the asset may reverse and resume trading upwards. In this case, the upside target is the resistance area at 105.55. At the same time, an opposite scenario implies that the price may continue its decline to return to 104.00 before resuming its ascending movement.

USDJPY
Risk Warning: the result of previous trading operations do not guarantee the same results in the future

EURGBP, “Euro vs. Great Britain Pound”

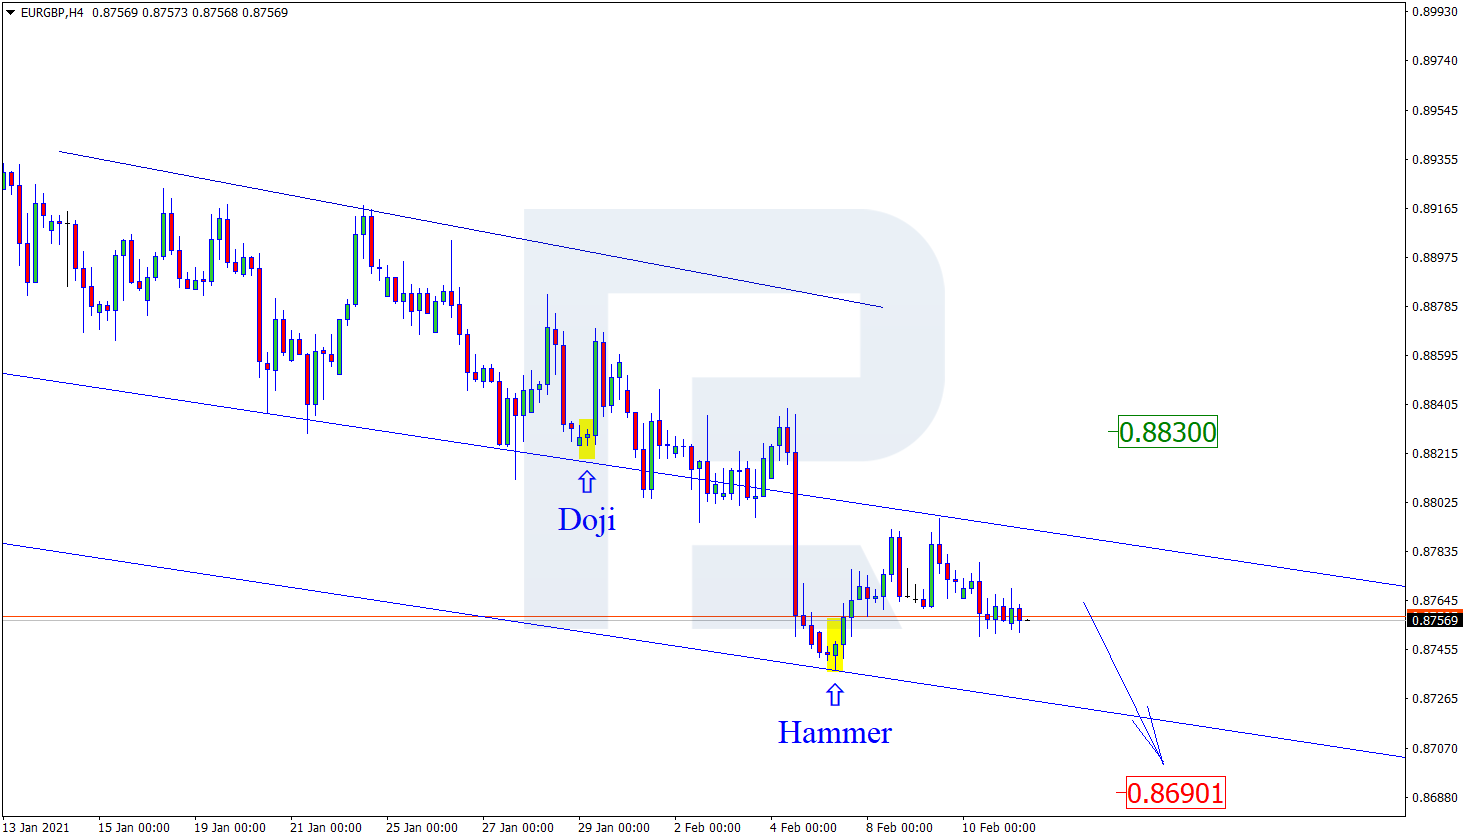
As we can see in the H4 chart, after forming several reversal patterns, such as Hammer, not far from the support level, EURGBP is reversing and forming another pullback. In this case, the upside target remains at the resistance area at 0.8830. However, judging by previous movements, the pair may yet continue its decline to reach 0.8690 without correcting towards the resistance area.

EURGBP
Risk Warning: the result of previous trading operations do not guarantee the same results in the future

rfxsignals February 11, 2021 No Comments

Ichimoku Cloud Analysis 11.02.2021 (AUDUSD, EURGBP, USDCAD)

Ichimoku Cloud Analysis 11.02.2021 (AUDUSD, EURGBP, USDCAD)

11.02.2021

AUDUSD, “Australian Dollar vs US Dollar”

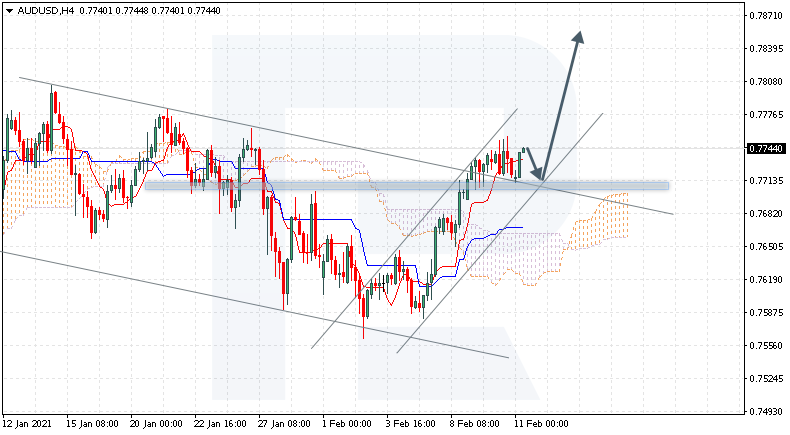
AUDUSD is trading at 0.7744; the instrument is moving above Ichimoku Cloud, thus indicating an ascending tendency. The markets could indicate that the price may test Tenkan-Sen and Kijun-Sen at 0.7715 and then resume moving upwards to reach 0.7845. Another signal in favor of a further uptrend will be a rebound from the descending channel’s upside border. However, the bullish scenario may no longer be valid if the price breaks the cloud’s downside border and fixes below 0.7585. In this case, the pair may continue falling towards 0.7525.

AUDUSD
Risk Warning: the result of previous trading operations do not guarantee the same results in the future

EURGBP, “Euro vs Great Britain Pound”

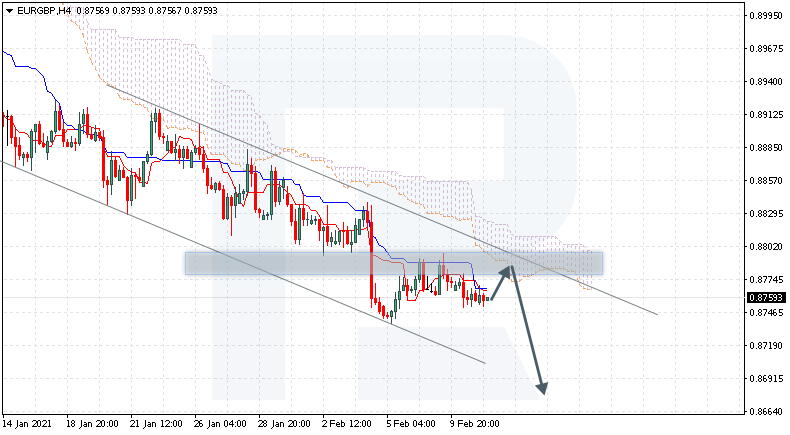
EURGBP is trading at 0.8759; the instrument is moving below Ichimoku Cloud, thus indicating a descending tendency. The markets could indicate that the price may test the cloud’s downside border at 0.8755 and then resume moving downwards to reach 0.8675. Another signal in favor of a further downtrend will be a rebound from the descending channel’s upside border. However, the bearish scenario may be canceled if the price breaks the cloud’s upside border and fixes above 0.8825. In this case, the pair may continue growing towards 0.9095.

EURGBP
Risk Warning: the result of previous trading operations do not guarantee the same results in the future

USDCAD, “US Dollar vs Canadian Dollar”

USDCAD is trading at 1.2686; the instrument is moving below Ichimoku Cloud, thus indicating a descending tendency. The markets could indicate that the price may test the cloud’s downside border at 1.2705 and then resume moving downwards to reach 1.2605. Another signal in favor of a further downtrend will be a rebound from the resistance level. However, the bearish scenario may no longer be valid if the price breaks the cloud’s upside border and fixes above 1.2745. In this case, the pair may continue growing towards 1.2835.

USDCAD

rfxsignals February 11, 2021 No Comments

Fibonacci Retracements Analysis 11.02.2021 (AUDUSD, USDCAD)

Fibonacci Retracements Analysis 11.02.2021 (AUDUSD, USDCAD)

11.02.2021

AUDUSD, “Australian Dollar vs US Dollar”

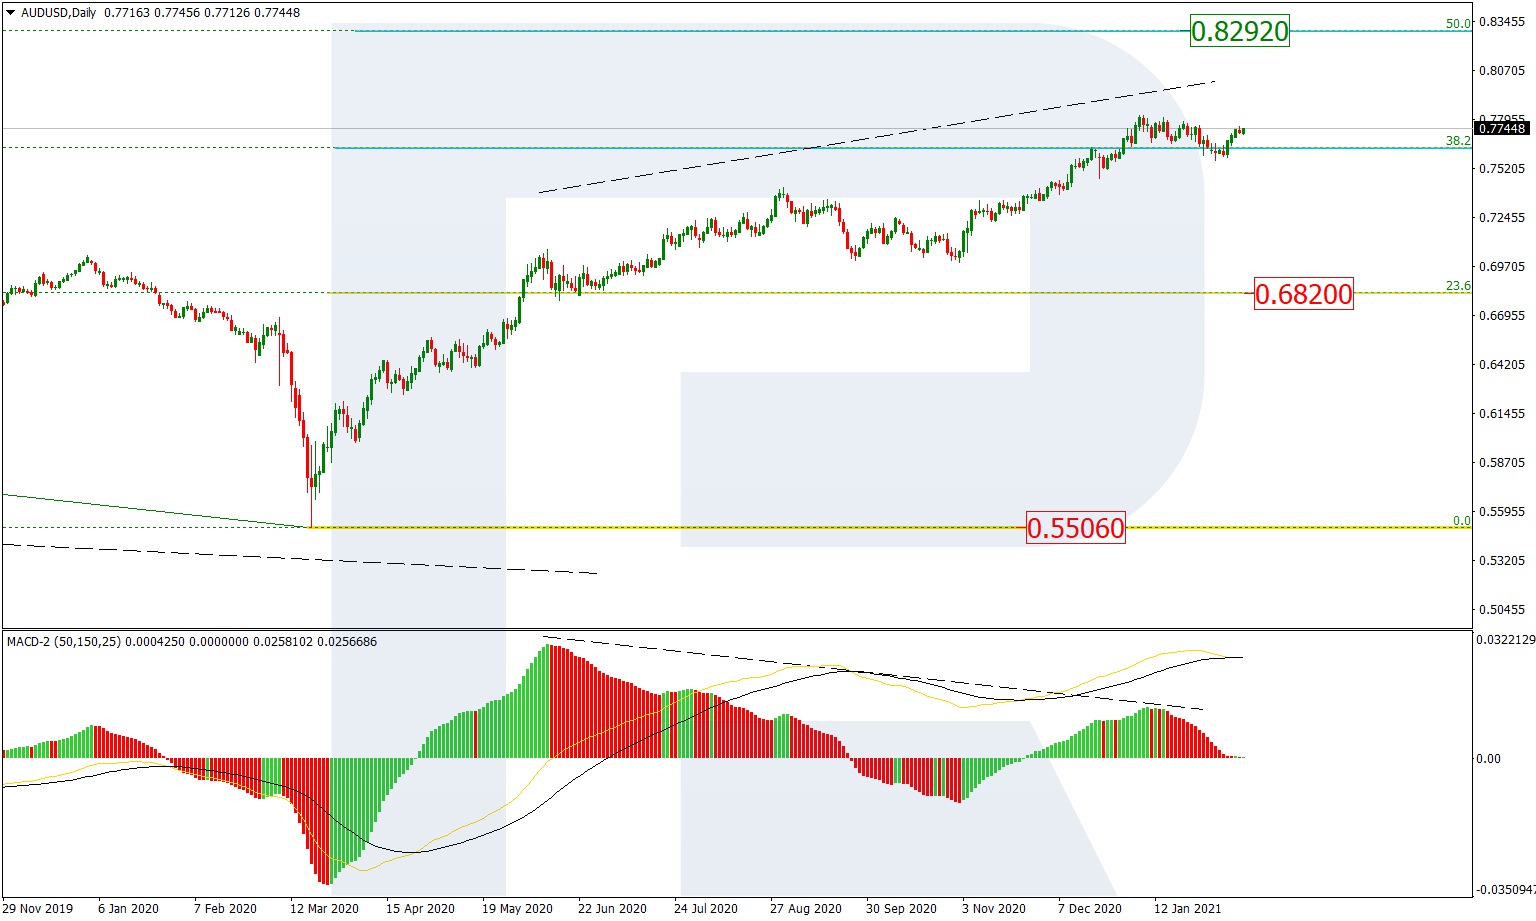
As we can see in the daily chart, after testing 38.2% fibo, AUDUSD is starting a new impulse to the upside. The next important upside target is 50.0% fibo at 0.8292, while the support is at 23.6% fibo at 0.6820. At the same time, there might be a divergence on MACD, which implies a new correction to the downside after the asset reaches the target.

AUDUSD_D1
Risk Warning: the result of previous trading operations do not guarantee the same results in the future

The H1 chart shows that after breaking 23.6% fibo but then failing to reach 38.2% fibo at 0.7503, the pair has started a new rising wave towards 76.0% fibo at 0.7759 due to convergence on MACD. Despite a local divergence, the pair is expected to continue growing towards the high at 0.7820. Later, the market may rebound from the high and resume falling towards the mid-term 38.2% and 50.0% fibo at 0.7503 and 0.7405 respectively.

AUDUSD_H1
Risk Warning: the result of previous trading operations do not guarantee the same results in the future

USDCAD, “US Dollar vs Canadian Dollar”

As we can see in the H4 chart, after breaking the consolidation range, USDCAD is falling. Despite a convergence on MACD, the pair may fall to break the low at 1.2589 and then continue trading downwards to reach the post-correctional extension area between 138.2% and 161.8% fibo at 1.2478 and 1.2408 respectively. However, as long as the asset is moving above the low, it may yet grow to break the local high at 1.2881 and then reach the long-term 23.6% fibo at 1.2985.

USDCAD_H4
Risk Warning: the result of previous trading operations do not guarantee the same results in the future

The H1 chart shows that the descending wave is approaching 76.0% fibo at 1.2659. At the same time, there is a convergence on MACD, which may indicate a possible reversal soon. A breakout of the resistance at 50.0% fibo (1.2735) will lead to a new mid-term wave to the upside.

USDCAD_H1

rfxsignals February 10, 2021 No Comments

The Aussie intends to rise. Overview for 10.02.2021

The Aussie intends to rise. Overview for 10.02.2021

10.02.2021

AUDUSD is keeping its positive momentum and planning to go higher.

The Australian Dollar is rising against the “greenback” on Wednesday morning. The current quote for the instrument is 0.7737.

The statistics published by Australia yesterday were pretty good. The NAB Business Confidence went up to 10 points in January after being 5 points the month before. Signals that businesses are ready to emerge and get back to normal are very important for the country’s economic outlook.

The Westpac Consumer Sentiment showed 1.9% in February after being -4.5% in January. This slight improvement is also quite favorable for the Australian economy. Of course, all these “rays of hope” require confirmation but they are still pretty good.

The key positive factor for the Aussie right now is the “greenback” behavior, which is now correcting after completing a bullish rally. Market players are keeping a close on Joe Biden’s office, which is working on approval of an additional stimulus package for the American economy. Everything is going well – the final draft of the plan has to go through all stages of approval and voting before being passed but the situation is quite stable.

rfxsignals February 10, 2021 No Comments

Forex Technical Analysis & Forecast 10.02.2021

Forex Technical Analysis & Forecast 10.02.2021

10.02.2021

EURUSD, “Euro vs US Dollar”

EURUSD continues moving upwards. Possibly, today the pair may reach 1.2133 and then consolidate there. Later, the market may break the range to the downside and form a new descending structure with the target at 1.2050.

EURUSD
Risk Warning: the result of previous trading operations do not guarantee the same results in the future

GBPUSD, “Great Britain Pound vs US Dollar”

GBPUSD is extending the ascending wave towards 1.3820 and may later consolidate there. After that, the instrument may break the range to the downside and then resume trading downwards with the target at 1.3696.

GBPUSD
Risk Warning: the result of previous trading operations do not guarantee the same results in the future

USDRUB, “US Dollar vs Russian Ruble”

USDRUB continues falling towards 73.63. Later, the market form one more ascending structure to reach 74.90 and then resume trading downwards with the target at 73.40.

USDRUB
Risk Warning: the result of previous trading operations do not guarantee the same results in the future

USDJPY, “US Dollar vs Japanese Yen”

USDJPY has completed the descending wave at 104.50; right now, it is consolidating around this level. Possibly, the pair may grow to test 105.00 from below and then start a new decline towards 104.40. Later, the market may resume growing with the target at 105.90.

USDJPY
Risk Warning: the result of previous trading operations do not guarantee the same results in the future

USDCHF, “US Dollar vs Swiss Franc”

USDCHF is still moving downwards. Today, the pair may reach 0.8906 and then consolidate there. After that, the instrument may break the range to the upside and then form one more ascending structure with the target at 0.8975.

USDCHF
Risk Warning: the result of previous trading operations do not guarantee the same results in the future

AUDUSD, “Australian Dollar vs US Dollar”

AUDUSD is still consolidating around 0.7720. possibly, today the pair may expand the range up to 0.7755 and then fall to break 0.7710. After that, the instrument may continue trading downwards with the target at 0.7650.

AUDUSD
Risk Warning: the result of previous trading operations do not guarantee the same results in the future

BRENT

After completing the correction at 60.00, Brent is moving upwards to reach 61.00, thus forming a new consolidation range around 60.50. If later the price breaks this range to the downside, the market may continue the correction towards 59.00; if to the upside – form one more ascending structure with the target at 62.50.

BRENT
Risk Warning: the result of previous trading operations do not guarantee the same results in the future

XAUUSD, “Gold vs US Dollar”

Gold is still consolidating around 1842.22. Today, the metal may break the range to the downside and resume trading downwards to break 1813.50. Later, the market may continue falling with the target at 1780.66.

GOLD
Risk Warning: the result of previous trading operations do not guarantee the same results in the future

BTCUSD, “Bitcoin vs US Dollar”

After finishing the ascending wave at 48130.00, BTCUSD is consolidating below it. Possibly, the asset may break the range to the downside and resume falling with the target at 38800.00.

BITCOIN
Risk Warning: the result of previous trading operations do not guarantee the same results in the future

S&P 500

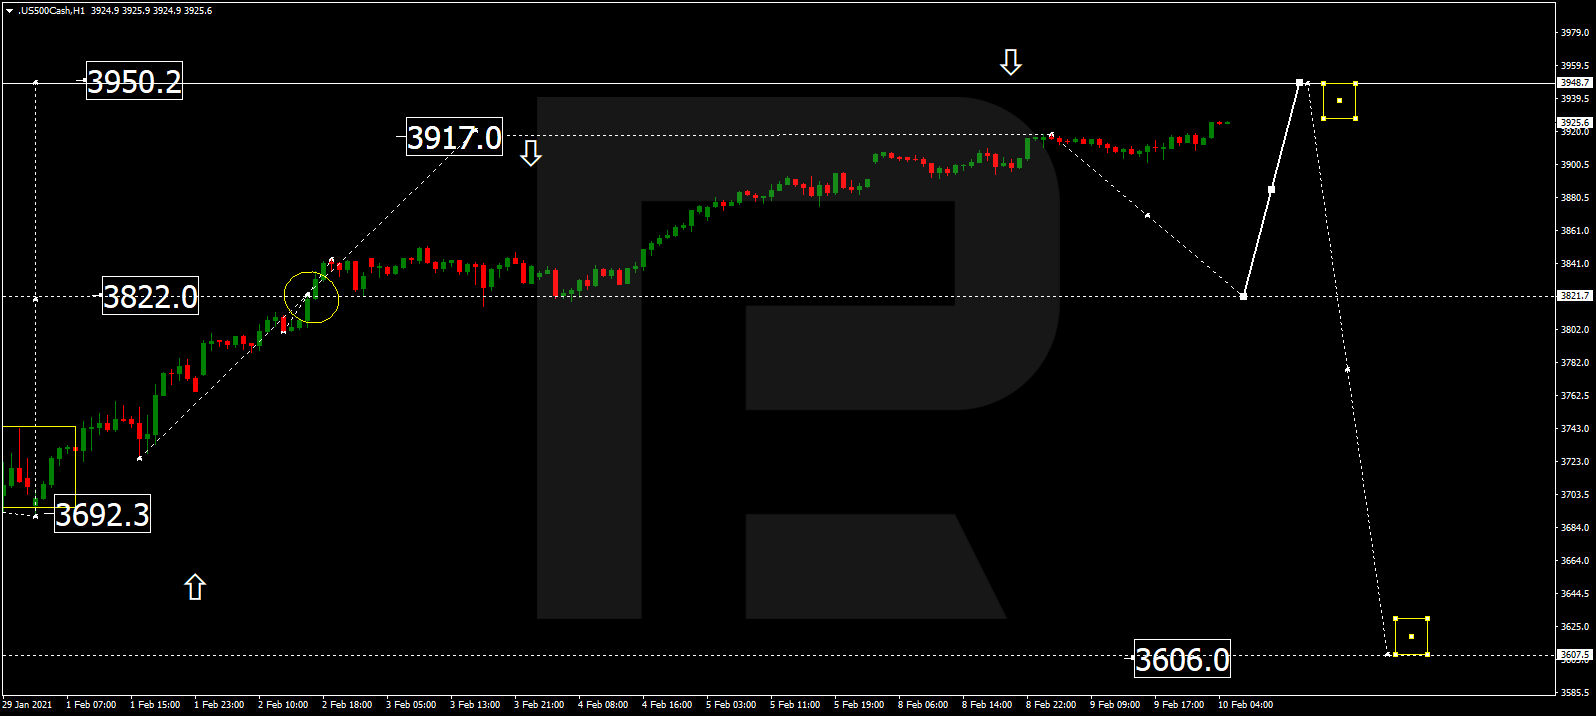
The S&P index continues forming the ascending wave with the key target at 3950.2. Later, the market may consolidate around this level. After breaking the range to the downside, the instrument may form a new descending wave with the target at 3821.7.
S&P 500
Risk Warning: the result of previous trading operations do not guarantee the same results in the future

rfxsignals February 10, 2021 No Comments

Murrey Math Lines 10.02.2021 (USDJPY, USDCAD)

Murrey Math Lines 10.02.2021 (USDJPY, USDCAD)

10.02.2021

USDJPY, “US Dollar vs. Japanese Yen”

As we can see in the H4 chart, USDJPY is consolidating between 3/8 and 5/8. In this case, the price is expected to test 3/8, rebound from it, and then resume growing towards the resistance at 5/8. However, this scenario may no longer be valid if the price breaks 3/8 to the downside. After that, the instrument may reverse and move downwards to reach the support at 2/8.

USDJPY_H4
Risk Warning: the result of previous trading operations do not guarantee the same results in the future

In the M15 chart, the pair may break the upside line of the VoltyChannel indicator and, as a result, continue moving upwards.

USDJPY_M15
Risk Warning: the result of previous trading operations do not guarantee the same results in the future

USDCAD, “US Dollar vs Canadian Dollar”

In the H4 chart, USDCAD is trading below the 200-day Moving Average, thus indicating a descending tendency. In this case, the price is expected to break 0/8 and then continue falling towards the support at -1/8. Still, this scenario may no longer be valid if the price breaks 1/8 to the upside. After that, the instrument may reverse and grow to reach the resistance at 2/8.

USDCAD_H4
Risk Warning: the result of previous trading operations do not guarantee the same results in the future

As we can see in the M15 chart, the pair has broken the downside line of the VoltyChannel indicator and, as a result, may continue trading downwards.

USDCAD_M15
Risk Warning: the result of previous trading operations do not guarantee the same results in the future

rfxsignals February 10, 2021 No Comments

Japanese Candlesticks Analysis 10.02.2021 (USDCAD, AUDUSD, USDCHF)

Japanese Candlesticks Analysis 10.02.2021 (USDCAD, AUDUSD, USDCHF)

10.02.2021

USDCAD, “US Dollar vs Canadian Dollar”

As we can see in the H4 chart, after forming a Harami reversal pattern not far from the resistance level, USDCAD is reversing and falling towards the support level. In this case, the downside target is at 1.2620. After that, the asset may continue forming the descending impulse. However, an alternative scenario implies a further pullback towards 1.2780 before the asset resumes the descending tendency.

USDCAD
Risk Warning: the result of previous trading operations do not guarantee the same results in the future

AUDUSD, “Australian Dollar vs US Dollar”

As we can see in the H4 chart, the uptrend continues. Right now, after forming several reversal patterns, such as Hammer, not far from the support area, the pair may reverse and resume growing to reach the resistance level at 0.7798. At the same time, an opposite scenario says that the price may correct towards 0.7650 before resuming its growth.

AUDUSD
Risk Warning: the result of previous trading operations do not guarantee the same results in the future

USDCHF, “US Dollar vs Swiss Franc”

As we can see in the H4 chart, the correction within the uptrend continues. At the moment, after forming several reversal patterns, such as Hanging Man, not far from the resistance area, USDCHF is reversing. The correctional target is the support level at 0.8855. Later, the asset may complete the correction and resume the ascending tendency. In this case, the upside target may be the resistance area at 0.9000.

USDCHF
Risk Warning: the result of previous trading operations do not guarantee the same results in the future

rfxsignals February 10, 2021 No Comments

Ichimoku Cloud Analysis 10.02.2021 (BTCUSD, EURUSD, NZDUSD)

Ichimoku Cloud Analysis 10.02.2021 (BTCUSD, EURUSD, NZDUSD)

10.02.2021

BTCUSD, “Bitcoin vs US Dollar”

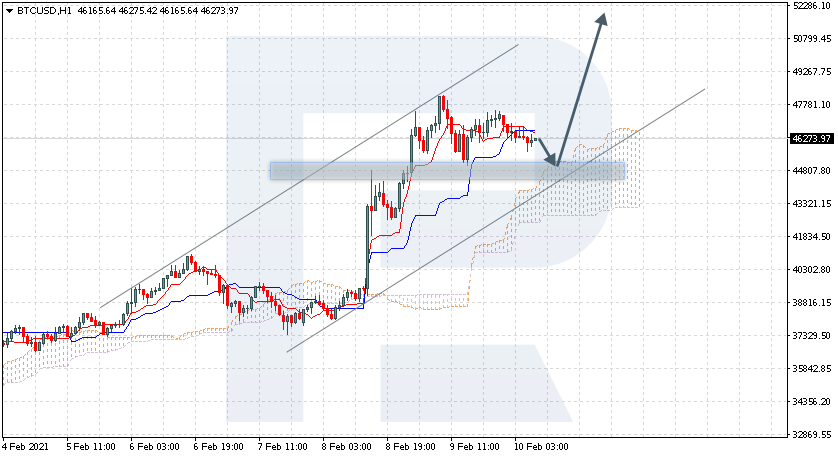
BTCUSD is trading at 46273.00; the instrument is moving above Ichimoku Cloud, thus indicating an ascending tendency. The markets could indicate that the price may test the cloud’s upside border at 44825.00 and then resume moving upwards to reach 52005.00. Another signal in favor of a further uptrend will be a rebound from the rising channel’s downside border. However, the bullish scenario may no longer be valid if the price breaks the cloud’s downside border and fixes below 41805.00. In this case, the pair may continue falling towards 37345.00.

BTCUSD
Risk Warning: the result of previous trading operations do not guarantee the same results in the future

EURUSD, “Euro vs US Dollar”

EURUSD is trading at 1.2125; the instrument is moving above Ichimoku Cloud, thus indicating an ascending tendency. The markets could indicate that the price may test the cloud’s upside border at 1.2090 and then resume moving upwards to reach 1.2195. Another signal in favor of a further uptrend will be a rebound from the descending channel’s upside border. However, the bullish scenario may be canceled if the price breaks the cloud’s downside border and fixes below 1.1975. In this case, the pair may continue falling towards 1.1905.

EURUSD
Risk Warning: the result of previous trading operations do not guarantee the same results in the future

NZDUSD, “New Zealand Dollar vs US Dollar”

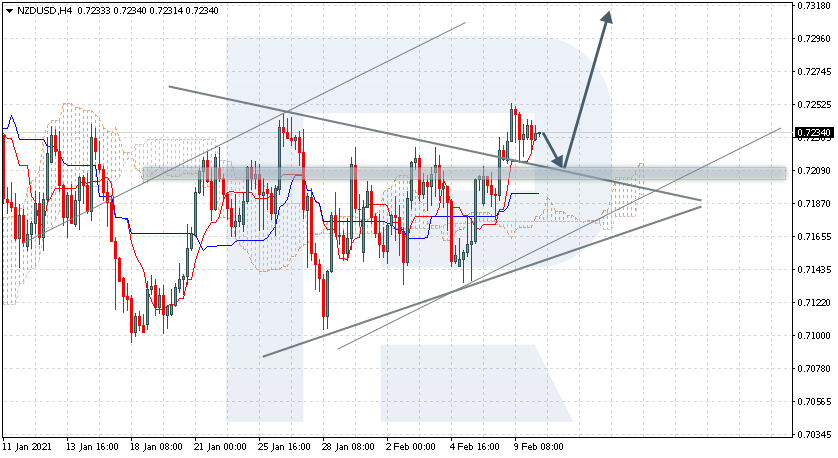
NZDUSD is trading at 0.7234; the instrument is moving above Ichimoku Cloud, thus indicating an ascending tendency. The markets could indicate that the price may test Tenkan-Sen and Kijun-Sen at 0.7205 and then resume moving upwards to reach 0.7310. Another signal in favor of a further uptrend will be a rebound from the upside border of the Triangle pattern. However, the bullish scenario may be canceled if the price breaks the cloud’s downside border and fixes below 0.7155. In this case, the pair may continue falling towards 0.7065.

NZDUSD
Risk Warning: the result of previous trading operations do not guarantee the same results in the future

rfxsignals February 10, 2021 No Comments

The Euro keeps its positive momentum. Overview for 10.02.2021

The Euro keeps its positive momentum. Overview for 10.02.2021

10.02.2021

EURUSD remains “in the black” and continues recovering.

The major currency pair is recovering at a very good pace and wants to keep the positive momentum. The current quote for the instrument is 1.2127.

There weren’t a lot of statistics from the Euro Area and the USA earlier this week. The report worth mentioning was the NFIB Small Business Index, which showed 95.0 points in January after being 95.9 points in December and against the expected reading of 96.6 points.

Today’s macroeconomic calendar is quite interesting. For example, the USA is scheduled to report on inflation in January, which is expected to attract a lot of attention because it may either help the White House to boost the approval of its new stimulus plan or stall it. In December, the CPI showed 0.4% m/m and is expected to be 0.3% m/m in January. If the actual reading matches the expected one, it may prevent the “greenback” from violent fluctuations.

The Core CPI may show 0.2% m/m in January after being 0.1% m/m the month before.

Later in the evening, the US Federal Reserve Chairman Jerome Powell is set to speak. He is very unlikely to talk about any controversial points in the regulator’s monetary policy, but his comments are still worth paying attention to. Among other things, Powell may share his opinion about the statistics on inflation.