Fibonacci Retracements Analysis 10.02.2021 (GBPUSD, EURJPY)

Fibonacci Retracements Analysis 10.02.2021 (GBPUSD, EURJPY)

10.02.2021

GBPUSD, “Great Britain Pound vs US Dollar”

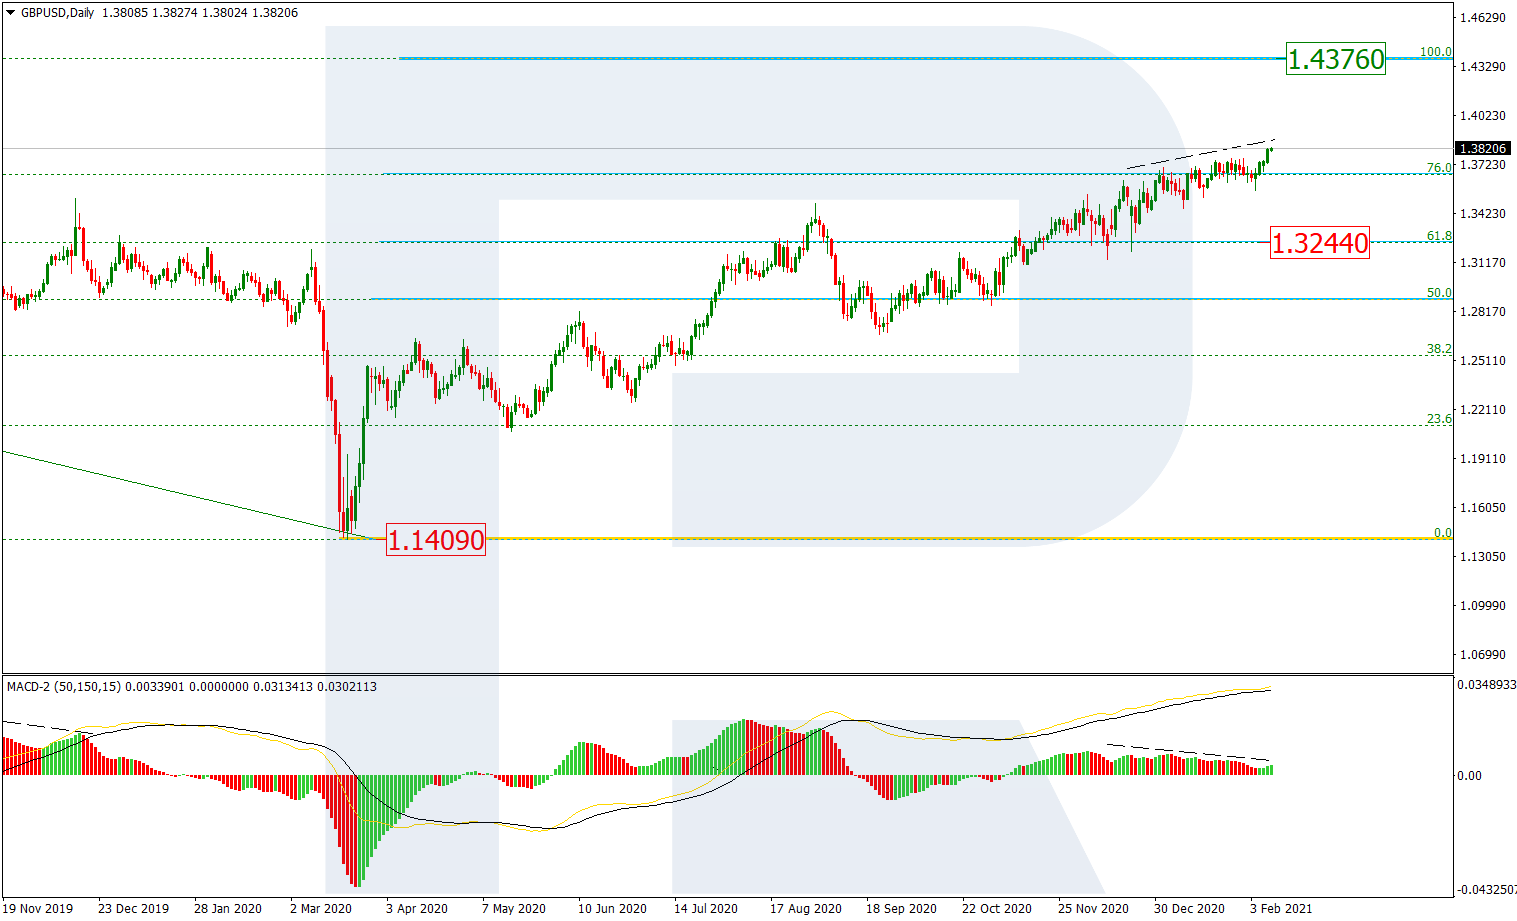
As we can see in the daily chart, after testing 76.0% fibo, GBPUSD has finally broken it and may later continue growing to reach the long-term high at 1.4376. The support here is at 61.8% fibo at 1.3244. At the same time, a divergence on MACD may hint at a new pullback soon.

GBPUSD_D1
Risk Warning: the result of previous trading operations do not guarantee the same results in the future

In the H1 chart, after finishing the previous correctional wave at 38.2% fibo (1.3541), GBPUSD is forming a new rising structure, which has already broken the previous high and may soon enter the post-correctional extension area between 138.2% and 161.8% fibo at 1.3790 and 1.3980 respectively.

GBPUSD_H1
Risk Warning: the result of previous trading operations do not guarantee the same results in the future

EURJPY, “Euro vs. Japanese Yen”

In the H4 chart, EURJPY continues testing the high at 127.07 and trying to break it. If the price breaks the high and fixes above it, the asset may grow to break the mid-term 61.8% fibo at 128.65 and then continue moving to reach the post-correctional extension area between 138.2% and 161.8% fibo at 129.16 and 130.43 respectively.

EURJPY_H4
Risk Warning: the result of previous trading operations do not guarantee the same results in the future

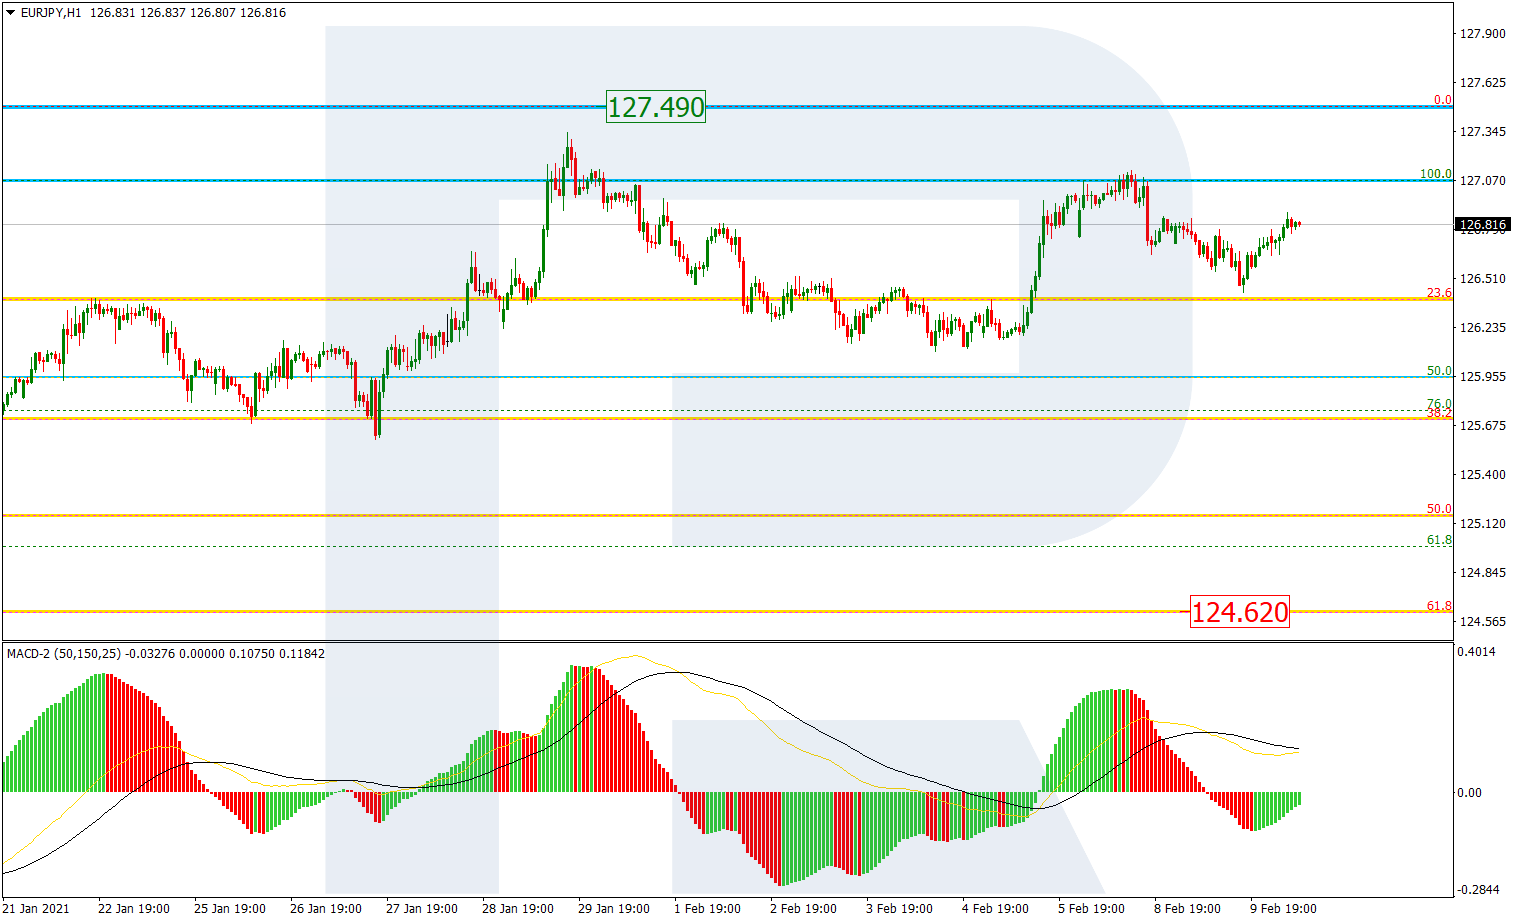
As we can see In the H1 chart, the current trading range is getting narrower after the price has re-tested the high. The key resistance is the high at 127.49. The previous decline reached 50.0% fibo, so the next one may be heading towards 61.8% fibo at 124.62. Still, this scenario may no longer be valid if the asset breaks the high.

EURJPY_H1

rfxsignals February 9, 2021 No Comments

Forex Technical Analysis & Forecast 09.02.2021

Forex Technical Analysis & Forecast 09.02.2021

09.02.2021

EURUSD, “Euro vs US Dollar”

After forming another consolidation range around 1.2050, EURUSD has expanded it up to 1.2080. Later, the market may form a new descending structure to break 1.2015 and then continue falling with the target at 1.1944.

EURUSD
Risk Warning: the result of previous trading operations do not guarantee the same results in the future

GBPUSD, “Great Britain Pound vs US Dollar”

GBPUSD has expanded its consolidation range up to 1.3782. Possibly, today the pair may fall to reach 1.3740 and then form one more ascending structure towards 1.3820. 1.3671. After that, the instrument may start another decline to break 1.3672 and then continue trading downwards with the target at 1.3600.

GBPUSD
Risk Warning: the result of previous trading operations do not guarantee the same results in the future

USDRUB, “US Dollar vs Russian Ruble”

USDRUB has completed the descending wave at 74.24; right now, it is consolidating around this level. Possibly, the pair may break the range to the downside and then resume trading downwards with the short-term target at 73.63.

USDRUB
Risk Warning: the result of previous trading operations do not guarantee the same results in the future

USDJPY, “US Dollar vs Japanese Yen”

USDJPY is still falling towards 104.64. Later, the market may resume growing with the target at 105.10 and then form a new descending structure to reach 104.50.

USDJPY
Risk Warning: the result of previous trading operations do not guarantee the same results in the future

USDCHF, “US Dollar vs Swiss Franc”

USDCHF has reached the key correctional target at 0.8969; right now, it is consolidating there. Possibly, the pair may expand the range down to 0.8955 and then form one more ascending structure with the target at 0.9070.

USDCHF
Risk Warning: the result of previous trading operations do not guarantee the same results in the future

AUDUSD, “Australian Dollar vs US Dollar”

After reaching the short-term upside target at 0.7720, AUDUSD is expected to consolidate there. Later, the market may break the range to the downside and correct towards 0.7651. After that, the instrument may start another growth with the target at 0.7739.

AUDUSD
Risk Warning: the result of previous trading operations do not guarantee the same results in the future

BRENT

After reaching 60.00 and forming a new consolidation range there, Brent has broken it to the upside to reach 61.00. After that, the instrument may correct to return to 60.00. and then form one more ascending structure with the key target at 62.50.

BRENT
Risk Warning: the result of previous trading operations do not guarantee the same results in the future

XAUUSD, “Gold vs US Dollar”

After forming another consolidation range around 1813.50 and breaking it to the upside, Gold has completed this ascending wave at 1842.22. Today, the metal may start consolidating around the latter level. Later, the market may break the range to the downside and resume trading downwards with the target at 1780.70.

GOLD
Risk Warning: the result of previous trading operations do not guarantee the same results in the future

BTCUSD, “Bitcoin vs US Dollar”

After forming a new consolidation range around38800.00 and breaking it to the upside, BTCUSD continues extending the current ascending wave with the target at 48100.00. After that, the instrument may resume falling with the target at 38800.00.

BITCOIN
Risk Warning: the result of previous trading operations do not guarantee the same results in the future

S&P 500

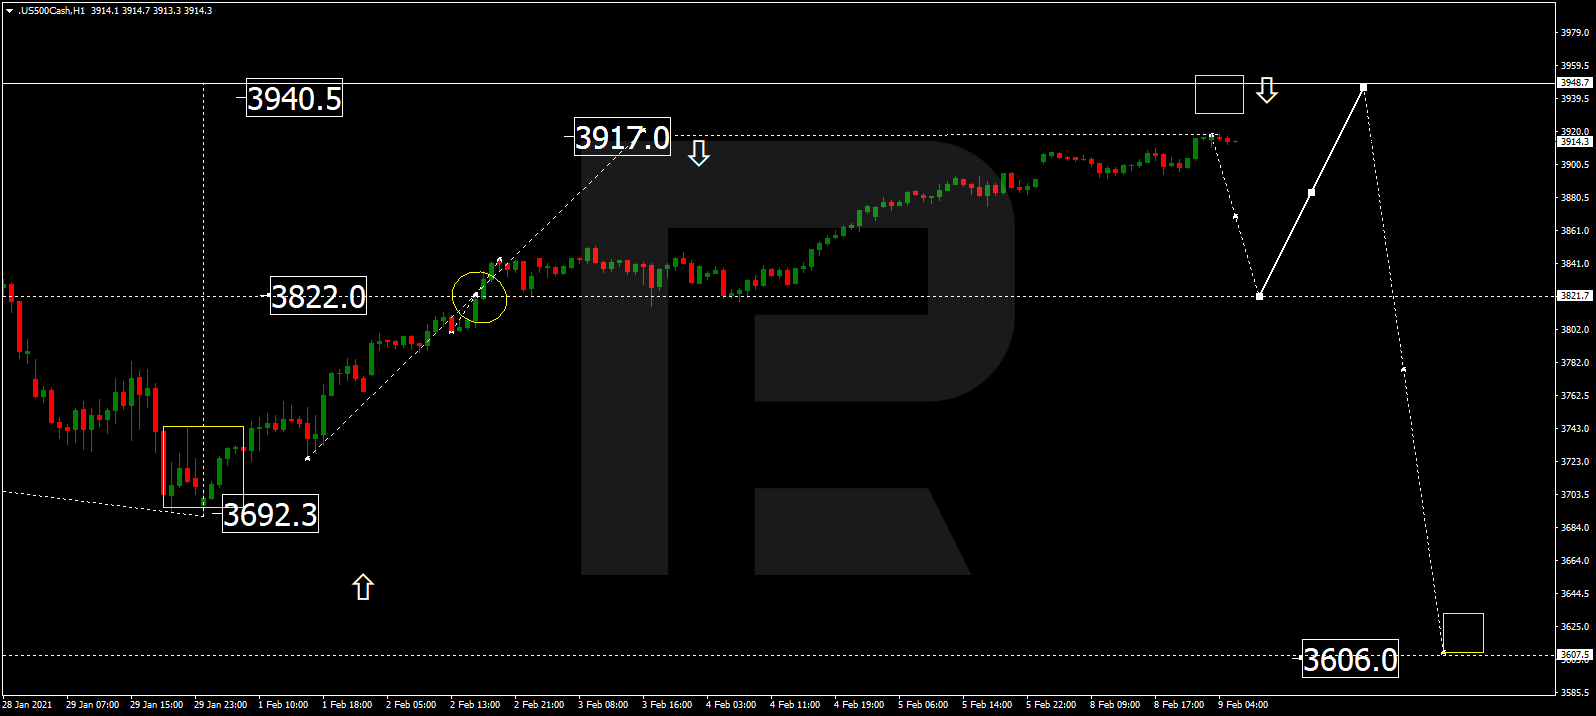
The S&P index has completed the ascending wave with the short-term target at 3917.0. Today, the asset may consolidate around this level. After breaking the range to the downside, the instrument may correct towards 3821.7 and then form one more ascending wave with the target at 3940.5.
S&P 500

rfxsignals February 9, 2021 No Comments

Murrey Math Lines 09.02.2021 (AUDUSD, NZDUSD)

Murrey Math Lines 09.02.2021 (AUDUSD, NZDUSD)

09.02.2021

AUDUSD, “Australian Dollar vs US Dollar”

In the H4 chart, AUDUSD is trading above the 200-day Moving Average, thus indicating an ascending tendency. In this case, the price is expected to break 7/8 and then continue growing to reach the resistance at 8/8. However, this scenario may be canceled if the price breaks 6/8 to the downside. After that, the instrument may reverse and fall towards the support at 5/8.

AUDUSD_H4
Risk Warning: the result of previous trading operations do not guarantee the same results in the future

As we can see in the M15 chart, the pair has broken the upside line of the VoltyChannel indicator and, as a result, may continue trading upwards.

AUDUSD_M15
Risk Warning: the result of previous trading operations do not guarantee the same results in the future

NZDUSD, “New Zealand Dollar vs US Dollar”

In the H4 chart, NZDUSD is also trading above the 200-day Moving Average, thus indicating an ascending tendency. downwards. In this case, the price is expected to break 7/8 and then continue growing towards the resistance at 8/8. However, this scenario may no longer be valid if the price breaks 6/8 to the downside. In this case, the instrument may continue falling to reach the support at 5/8.

NZDUSD_H4
Risk Warning: the result of previous trading operations do not guarantee the same results in the future

As we can see in the M15 chart, the price has broken the upside line of the VoltyChannel indicator and, as a result, may continue growing towards 8/8 from the H4 chart.

NZDUSD_M15

rfxsignals February 9, 2021 No Comments

Japanese Candlesticks Analysis 09.02.2021 (GOLD, NZDUSD, GBPUSD)

Japanese Candlesticks Analysis 09.02.2021 (GOLD, NZDUSD, GBPUSD)

09.02.2021

XAUUSD, “Gold vs US Dollar”

As we can see in the H4 chart, the metal is still trading upwards. Right now, after forming several reversal patterns, such as Harami, close to the horizontal support level, XAUUSD is reversing and may resume growing towards the resistance area. In this case, the upside target will be at 1874.50. At the same time, an opposite scenario implies that the price may continue its decline towards 1800.00 before further growth.

XAUUSD
Risk Warning: the result of previous trading operations do not guarantee the same results in the future

NZDUSD, “New Zealand vs. US Dollar”

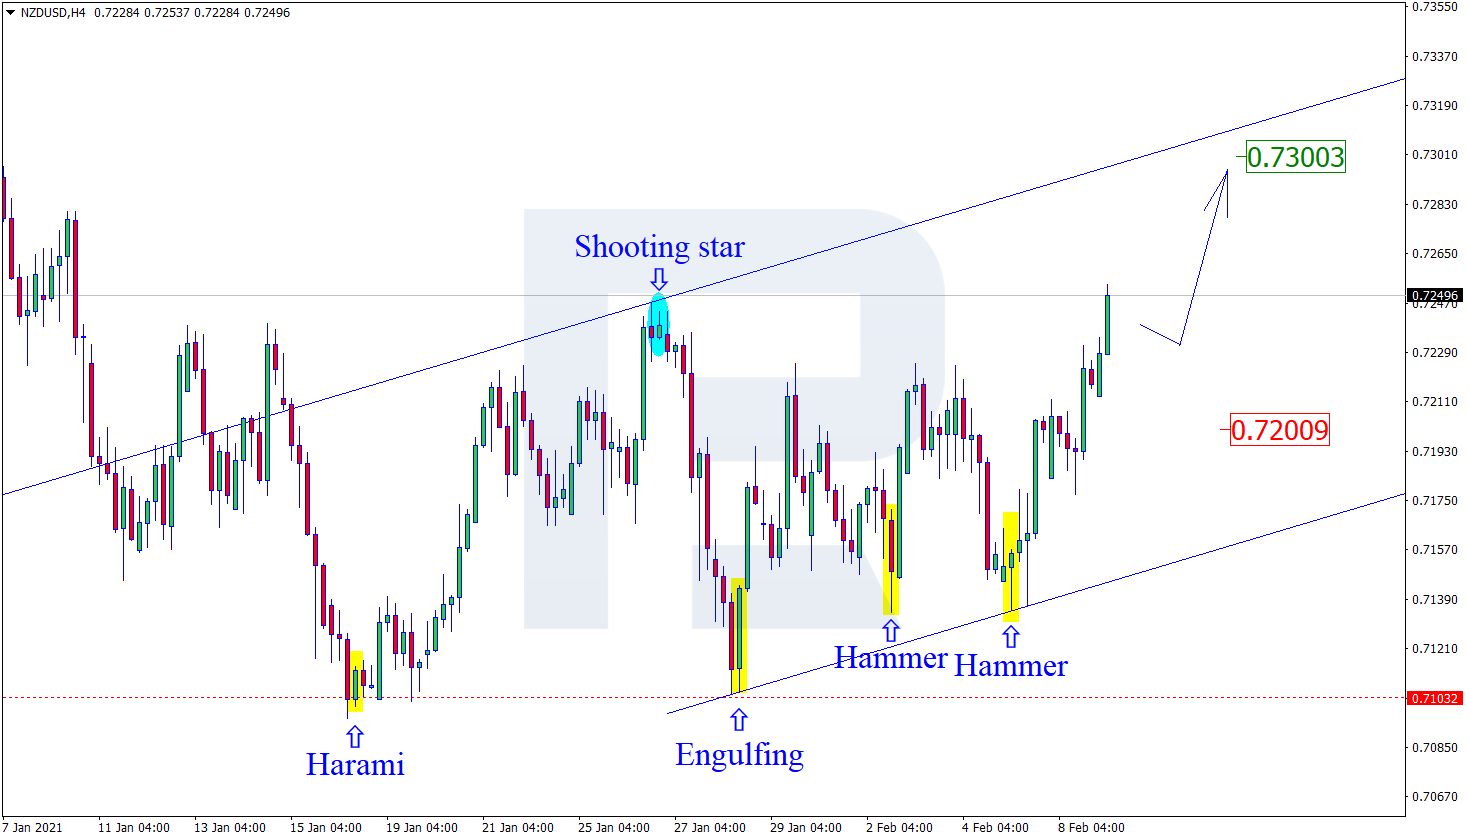
As we can see in the H4 chart, the pair is still moving upwards. Right now, after forming several reversal patterns, such as Hammer, close to the support level, NZDUSD is reversing. The upside target is the resistance area at 0.7300. However, an alternative scenario implies that the price may continue falling towards 0.7200 before resuming the ascending impulse.

NZDUSD
Risk Warning: the result of previous trading operations do not guarantee the same results in the future

GBPUSD

As we can see in the H4 chart, the uptrend continues. Right now, after forming an Engulfing pattern not far from the support area, GBPUSD is still reversing. In this case, the upside target is the resistance level at 1.3825. After that, the instrument may correct to the downside from the resistance area and then resume moving upwards. Still, there might be an alternative scenario, according to which the asset may correct to reach 1.3680 before resuming its growth.

GBPUSD

rfxsignals February 9, 2021 No Comments

Ichimoku Cloud Analysis 09.02.2021 (GBPUSD, USDCAD, AUDUSD)

Ichimoku Cloud Analysis 09.02.2021 (GBPUSD, USDCAD, AUDUSD)

09.02.2021

GBPUSD, “Great Britain Pound vs US Dollar”

GBPUSD is trading at 1.3785; the instrument is moving above Ichimoku Cloud, thus indicating an ascending tendency. The markets could indicate that the price may test Tenkan-Sen and Kijun-Sen at 1.3705 and then resume moving upwards to reach 1.3885. Another signal in favor of a further uptrend will be a rebound from the descending channel’s upside border. However, the bullish scenario may no longer be valid if the price breaks the cloud’s downside border and fixes below 1.3645. In this case, the pair may continue falling towards 1.3585.

GBPUSD
Risk Warning: the result of previous trading operations do not guarantee the same results in the future

USDCAD, “US Dollar vs Canadian Dollar”

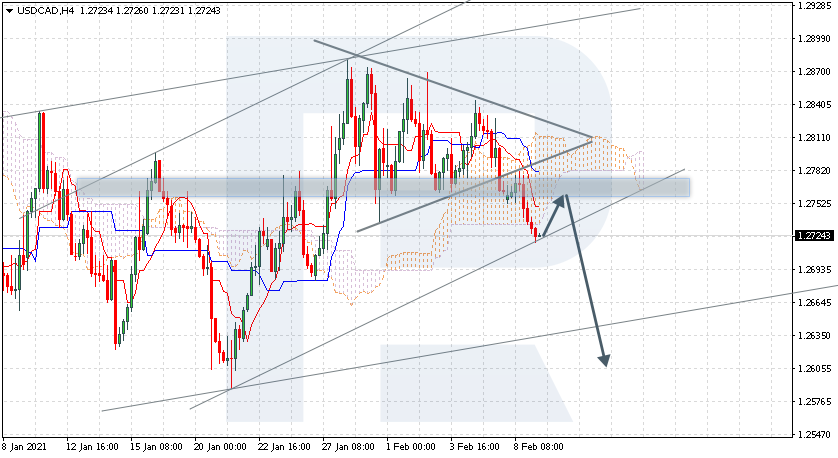
USDCAD is trading at 1.2724; the instrument is moving below Ichimoku Cloud, thus indicating a descending tendency. The markets could indicate that the price may test the cloud’s downside border at 1.2755 and then resume moving downwards to reach 1.2605. Another signal in favor of a further downtrend will be a rebound from the resistance level. However, the bearish scenario may no longer be valid if the price breaks the cloud’s upside border and fixes above 1.2825. In this case, the pair may continue growing towards 1.2965. To confirm further decline, the asset must break the rising channel’s downside border and fix below 1.2695.

USDCAD
Risk Warning: the result of previous trading operations do not guarantee the same results in the future

AUDUSD, “Australian Dollar vs US Dollar”

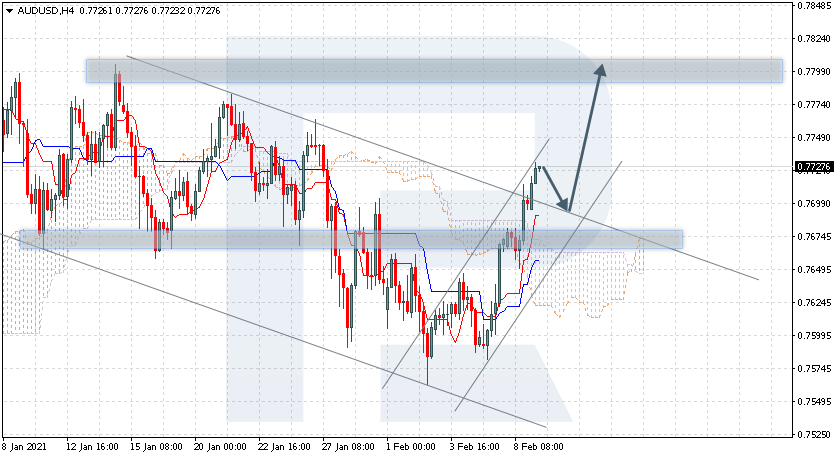
AUDUSD is trading at 0.7727; the instrument is moving above Ichimoku Cloud, thus indicating an ascending tendency. The markets could indicate that the price may test Tenkan-Sen and Kijun-Sen at 0.7685 and then resume moving upwards to reach 0.7795. Another signal in favor of a further uptrend will be a rebound from the descending channel’s upside border. However, the bullish scenario may no longer be valid if the price breaks the cloud’s downside border and fixes below 0.7585. In this case, the pair may continue falling towards 0.7525.

AUDUSD

rfxsignals February 9, 2021 No Comments

Fibonacci Retracements Analysis 09.02.2021 (EURUSD, USDJPY)

Fibonacci Retracements Analysis 09.02.2021 (EURUSD, USDJPY)

09.02.2021

EURUSD, “Euro vs US Dollar”

As we can see in the H4 chart, a convergence on MACD made the pair complete the correctional downtrend at 50.0% fibo. Possibly, the asset may be starting a new rising wave towards the high at 1.2350 and then the long-term fractal high at 1.2555. On the other hand, EURUSD may yet continue falling to reach 61.8% fibo at 1.1888 but this scenario is rather unlikely.

EURUSD_H4
Risk Warning: the result of previous trading operations do not guarantee the same results in the future

The H1 chart shows a more detailed structure of the current rising wave, which is heading to break 38.2% fibo at 1.2104 and may later then continue towards 50.0%, 61.8%, and 76.0% fibo at 1.2151, 1.2198, and 1.2254 respectively. A breakout of the local low at 1.1952 will hint at a further downtrend.

EURUSD_H1
Risk Warning: the result of previous trading operations do not guarantee the same results in the future

USDJPY, “US Dollar vs. Japanese Yen”

As we can see in the H4 chart, after breaking the mid-term 23.6% fibo, USDJPY has failed to reach 38.2% fibo at 106.07; right now, it is correcting to return to the former level. After the pullback, the price may continue growing towards 38.2% and 50.0% fibo at 106.07 107.15 respectively. On the other hand, if the asset breaks the low at 102.59, the instrument may continue falling to reach the fractal low at 101.18.

USDJPY_H4
Risk Warning: the result of previous trading operations do not guarantee the same results in the future

The H1 chart shows a more detailed structure of the current descending correction, which has already reached 38.2% fibo and may later continue towards 50.0%, 61.8%, and 76.0% fibo at 104.55, 104.26, and 103.91 respectively. However, a breakout of the local high at 105.77 will complete the correction.

USDJPY_H1

rfxsignals February 9, 2021 No Comments

The Euro is rising a little bit. Overview for 09.02.2021

The Euro is rising a little bit. Overview for 09.02.2021

09.02.2021

EURUSD has changed its direction; the asset is trying to recover.

The major currency pair is “in the black” on Tuesday. The current quote for the instrument is 1.2080.

Positive market sentiment about the upcoming stimulus measures from the US government is slowly fading away. it’s quite clear that the Democratic party will one way or another pass the $1.9 trillion COVID-19 stimulus plan but not earlier than the special unemployment benefits program expires. It means that the plan won’t get anywhere until at least March 15th. In this light, investors are correcting their USD positions.

The statistics published by the Euro Area yesterday were surprisingly weak. The Sentix Investor Confidence showed -0.2 points in February after being 1.3 points in January and against the expected reading of 4.1 points. However, where else can the confidence go when consumers in some European countries are restricted in their movements due to the lockdown?

The German Industrial Production report for December was pretty bad – the indicator showed no changes after adding 1.5% m/m the month before and against the expected increase by 0.1% m/m.

There are no European statistics in the macroeconomic calendar apart from the German Trade Balance. In the afternoon, the USA is scheduled to report on the NFIB Small Business Index, which is expected to rise in January. However, this indicator is minor and won’t have any significant influence on EURUSD.

rfxsignals February 8, 2021 No Comments

Forex Technical Analysis & Forecast 08.02.2021

Forex Technical Analysis & Forecast 08.02.2021

08.02.2021

EURUSD, “Euro vs US Dollar”

After finishing the correction at 1.2050 and testing this level from below, EURUSD is expected to form another consolidation range there. Later, the market may break the range to the downside and then resume falling with the target at 1.1944.

EURUSD
Risk Warning: the result of previous trading operations do not guarantee the same results in the future

GBPUSD, “Great Britain Pound vs US Dollar”

After completing the ascending wave at 1.3739, GBPUSD is expected to resume trading downwards and reach 1.3671. After that, the instrument may form one more ascending structure with the target at 1.3830.

GBPUSD
Risk Warning: the result of previous trading operations do not guarantee the same results in the future

USDRUB, “US Dollar vs Russian Ruble”

USDRUB is still falling towards 74.24 and may later start another growth to test 75.00 from below. After that, the instrument may resume trading downwards with the target at 73.63.

USDRUB
Risk Warning: the result of previous trading operations do not guarantee the same results in the future

USDJPY, “US Dollar vs Japanese Yen”

USDJPY is still consolidating around 105.55. Possibly, today the pair may break this range to the downside and start a new decline to reach 104.52. Later, the market may resume growing with the target at 105.91.

USDJPY
Risk Warning: the result of previous trading operations do not guarantee the same results in the future

USDCHF, “US Dollar vs Swiss Franc”

USDCHF has reached the short-term upside target at 0.9040; right now, it is correcting towards 0.8968. Later, the market may form one more ascending structure with the target at 0.9062.

USDCHF
Risk Warning: the result of previous trading operations do not guarantee the same results in the future

AUDUSD, “Australian Dollar vs US Dollar”

After breaking 0.7651, AUDUSD has reached 0.7680. Today, the pair may fall to test 0.7650 from above and then start another growth with the target at 0.7720.

AUDUSD
Risk Warning: the result of previous trading operations do not guarantee the same results in the future

BRENT

Brent is still growing towards 60.00. After that, the instrument may correct to reach 58.25 and then form one more ascending structure with the target at 61.77.

BRENT
Risk Warning: the result of previous trading operations do not guarantee the same results in the future

XAUUSD, “Gold vs US Dollar”

Gold has finished the ascending wave at 1818.60. Today, the metal may start consolidating around this level. Later, the market may break the range to the downside and resume trading upwards with the target at 1761.50.

GOLD
Risk Warning: the result of previous trading operations do not guarantee the same results in the future

BTCUSD, “Bitcoin vs US Dollar”

BTCUSD has completed the ascending wave at 40400.00; right now, it is consolidating around 38800.00. Later, the market may break the range to the downside and resume trading upwards to break 36200.00. After that, the instrument may continue falling with the target at 31700.00.

BITCOIN
Risk Warning: the result of previous trading operations do not guarantee the same results in the future

S&P 500

The S&P index is still growing towards 3917.0 and may later start a new correction to reach 3812.0. After that, the instrument may form one more ascending wave with the target at 3940.5.

S&P 500

rfxsignals February 8, 2021 No Comments

Murrey Math Lines 08.02.2021 (EURUSD, GBPUSD)

Murrey Math Lines 08.02.2021 (EURUSD, GBPUSD)

08.02.2021

EURUSD, “Euro vs. US Dollar”

In the H4 chart, after rebounding from 0/8, EURUSD is expected to correct upwards and reach 2/8. However, this scenario may no longer be valid if the price breaks 1/8 to the downside. After that, the instrument may continue falling towards the support at 0/8.

EURUSD_H4
Risk Warning: the result of previous trading operations do not guarantee the same results in the future

As we can see in the M15 chart, the pair has broken the upside line of the VoltyChannel indicator and, as a result, may continue its growth.

EURUSD_M15
Risk Warning: the result of previous trading operations do not guarantee the same results in the future

GBPUSD, “Great Britain Pound vs US Dollar”

In the H4 chart, GBPUSD is above the 200-day Moving Average within the “overbought area”, thus indicating an ascending tendency. In this case, the price is expected to break +1/8 and then continue growing towards the resistance at +2/8. However, this scenario may no longer be valid if the price breaks the support at 8/8 to the downside. After that, the instrument may continue falling and reach 7/8.

GBPUSD_H4
Risk Warning: the result of previous trading operations do not guarantee the same results in the future

As we can see in the M15 chart, the price has broken the upside line of the VoltyChannel indicator and, as a result, continue trading upwards to reach +2/8 from the H4 chart.

GBPUSD_M15

rfxsignals February 8, 2021 No Comments

Ichimoku Cloud Analysis 08.02.2021 (LTCUSD, EURUSD, USDJPY)

Ichimoku Cloud Analysis 08.02.2021 (LTCUSD, EURUSD, USDJPY)

08.02.2021

LTCUSD, “Litecoin vs US Dollar”

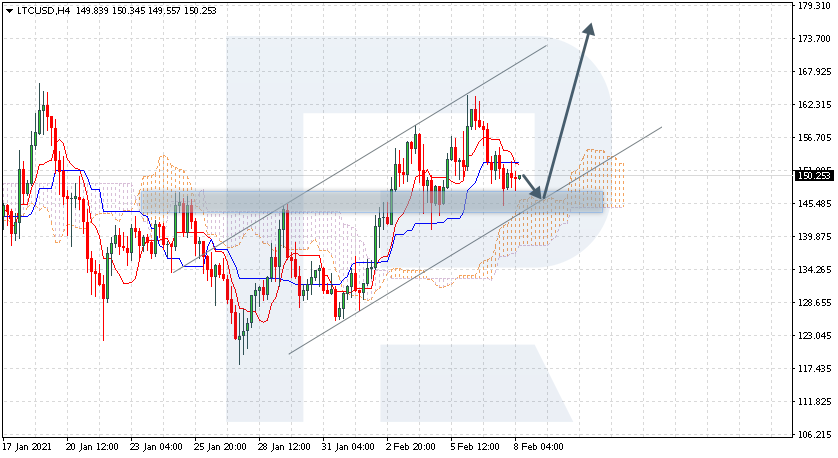
LTCUSD is trading at 150.25; the instrument is moving above Ichimoku Cloud, thus indicating an ascending tendency. The markets could indicate that the price may test the cloud’s upside border at 146.55 and then resume moving upwards to reach 175.05. Another signal in favor of a further uptrend is a rebound from the rising channel’s downside border. However, the bullish scenario may no longer be valid if the price breaks the cloud’s downside border and fixes below 135.05. In this case, the pair may continue falling towards 120.05.

LTCUSD
Risk Warning: the result of previous trading operations do not guarantee the same results in the future

EURUSD, “Euro vs US Dollar”

EURUSD is trading at 1.2037; the instrument is moving below Ichimoku Cloud, thus indicating a descending tendency. The markets could indicate that the price may test the cloud’s downside border at 1.2050 and then resume moving downwards to reach 1.1875. Another signal in favor of a further downtrend will be a rebound from the descending channel’s upside border. However, the bearish scenario may be canceled if the price breaks the cloud’s upside border and fixes above 1.2125. In this case, the pair may continue growing towards 1.2205.

EURUSD
Risk Warning: the result of previous trading operations do not guarantee the same results in the future

USDJPY, “US Dollar vs Japanese Yen”

USDJPY is trading at 105.50; the instrument is moving above Ichimoku Cloud, thus indicating an ascending tendency. The markets could indicate that the price may test Tenkan-Sen and Kijun-Sen at 105.15 and then resume moving upwards to reach 106.35. Another signal in favor of a further uptrend will be a rebound from the rising channel’s downside border. However, the bullish scenario may no longer be valid if the price breaks the cloud’s downside border and fixes below 103.95. In this case, the pair may continue falling towards 103.05.

USDJPY