rfxsignals February 8, 2021 No Comments

Japanese Candlesticks Analysis 08.02.2021 (EURUSD, USDJPY, EURGBP)

Japanese Candlesticks Analysis 08.02.2021 (EURUSD, USDJPY, EURGBP)

08.02.2021

EURUSD, “Euro vs. US Dollar”

As we can see in the H4 chart, the descending tendency continues. Right now, after forming several reversal patterns close to the resistance level, EURUSD may reverse and start a new decline. In this case, the correctional target may be at 1.1920. However, an alternative scenario implies that the price may grow to reach 1.2102 before testing 1.1920.

EURUSD
Risk Warning: the result of previous trading operations do not guarantee the same results in the future

USDJPY, “US Dollar vs. Japanese Yen”

As we can see in the H4 chart, after rebounding from the channel’s upside border, USDJPY has formed an Engulfing reversal pattern, which may lead to another pullback. Judging by the previous movement, one may assume that the asset may reverse in the form of a slight decline and then resume trading upwards. In this case, the upside target is the resistance area at 105.85. After completing another correction, the price may resume the ascending dynamics. At the same time, an opposite scenario implies that the price may continue its decline to return to 105.25 before resuming its ascending movement.

USDJPY
Risk Warning: the result of previous trading operations do not guarantee the same results in the future

EURGBP, “Euro vs. Great Britain Pound”

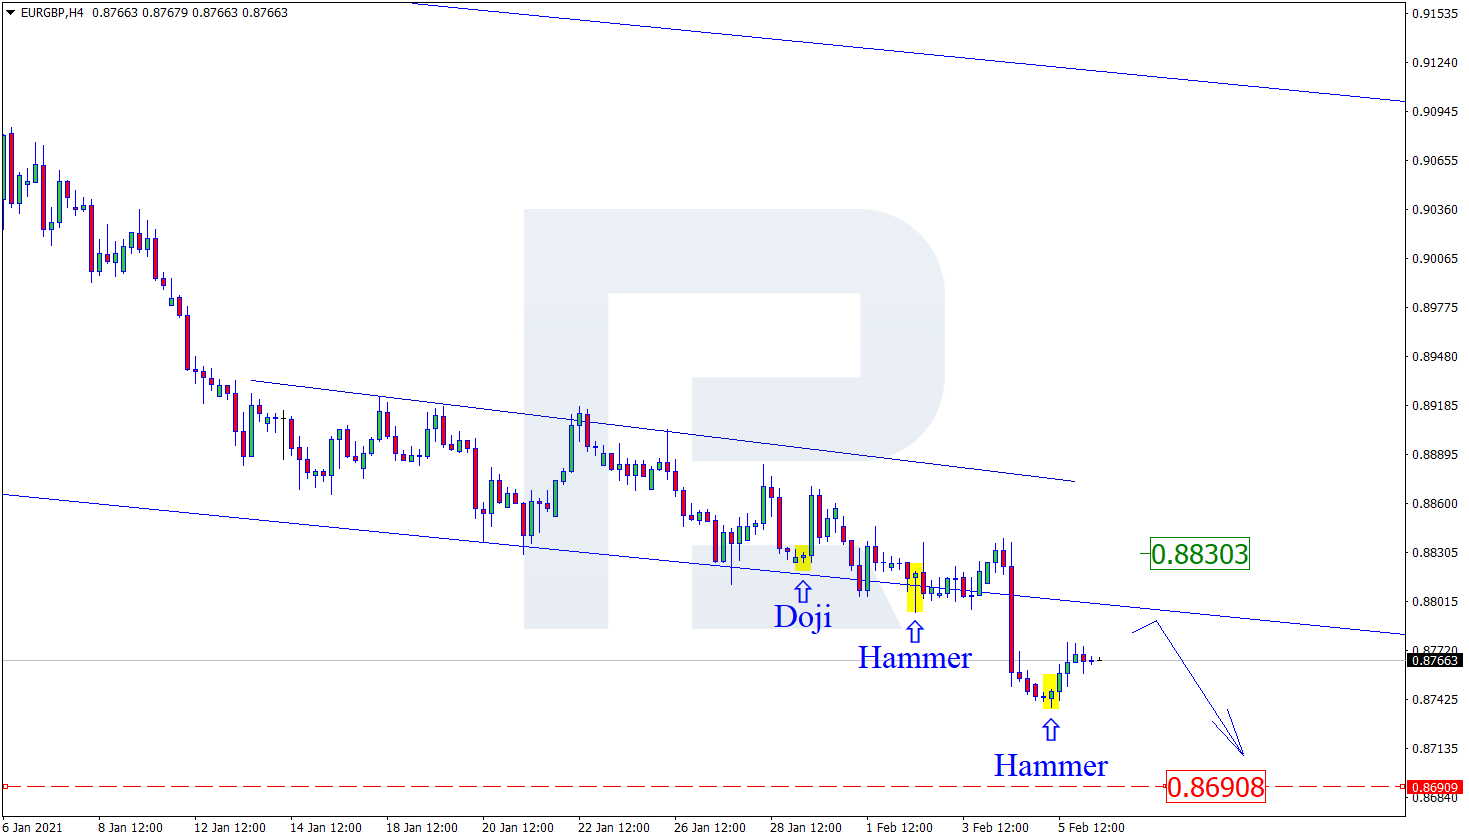
As we can see in the H4 chart, after forming several reversal patterns, such as Hammer, not far from the support level, EURGBP is reversing and may start another pullback. In this case, the correctional target may be the resistance area at 0.8830. However, judging by previous movements, the pair may yet continue its decline to reach 0.8690 without reversing and correcting.
EURGBP

rfxsignals February 8, 2021 No Comments

No ambitions for the Euro. Overview for 08.02.2021

No ambitions for the Euro. Overview for 08.02.2021

08.02.2021

Early in another February week, EURUSD remains in the same position; market players favor the “greenback”.

The major currency pair remains under pressure on Monday. The current quote for the instrument is 1.2040.

Last Friday, Joe Biden defended his administration’s $1.9 trillion COVID-19 stimulus plan and warned that Republican efforts to pass a smaller bill would only prolong the economy’s trek back to full employment. If everything goes as planned, the plan may be approved as early as March 15th, right after the special unemployment benefits program expires.

In the meantime, weak numbers on the US labor market do nothing but boost the plan approval. For example, the Unemployment Rate went from 6.7% in December to 6.3% in January but it was the only positive news. The Non-Farm Employment Change showed only 49K in January after being -227K the month before (it was revised downwards) and against the expected reading of 85K. The Average Hourly Earnings added only 0.2% m/m after expanding by 1.0% m/m and against the expected reading of +0.3% m/m.

The labor market tripped again, although the weekly data was looking quite stable. Most likely, the weak numbers resulted from the service sector, which just can’t get back to normal.

However, the current weakness of the labor market, confirmed by the statistics, is an ace in the hole for the White House. The USD doesn’t respond but it may be temporarily.

rfxsignals February 5, 2021 No Comments

Daily Free Forex Signals For 05/02/2021

Here your going to see Daily Free Forex Signals For 05/02/2021 to free forex signal alert from our kitkat trading system and other trading logic’s .we provide like this free forex signals from 2012 on wards with more than 50,000 traders around the world .The free forex signals have 70 to 85% quality always .we give for you a note as maximum focus take profit 1 as your target and must use stop loss values .if you have any other query’s please visit our live chat or email option


EURJPY SELL-126.263952
SL-126.569703
TP1-126.104842
TP2-125.944545

USDCAD BUY-1.282533
SL-1.279178
TP1-1.284109
TP2-1.285661

USDCHF SELL-0.903133
SL-0.906364
TP1-0.90163
TP2-0.899962

EURUSD BUY-1.197635
SL-1.194447
TP1-1.199199
TP2-1.200708

AUDJPY BUY-80.27744
SL-79.919295
TP1-80.435306
TP2-80.58846

USDCAD SELL-1.279361
SL-1.2832
TP1-1.277812
TP2-1.276286

EURJPY BUY-126.368108
SL-125.978887
TP1-126.526679
TP2-126.689369

GBPCAD SELL-1.748708
SL-1.754555
TP1-1.747116
TP2-1.745478

AUDCAD SELL-0.97351
SL-0.976977
TP1-0.971939
TP2-0.970308

rfxsignals February 5, 2021 No Comments

Forex Technical Analysis & Forecast 05.02.2021

Forex Technical Analysis & Forecast 05.02.2021

05.02.2021

EURUSD, “Euro vs US Dollar”

After reaching 1.2000 and then forming another consolidation range there, EURUSD has broken it to the downside; right now, it is still falling towards 1.1950. Possibly, today the pair may reach this level and then correct towards 1.1970. Later, the market may extend this descending wave down to 1.1941. After breaking the channel of this wave, the instrument may resume growing with the first target at 1.2155.

EURUSD
Risk Warning: the result of previous trading operations do not guarantee the same results in the future

GBPUSD, “Great Britain Pound vs US Dollar”

After completing the descending wave at 1.3565 and then returning to 1.3670, GBPUSD is consolidating around the latter level. If later the price breaks this range to the upside, the market may resume trading upwards with the target at 1.3755; if to the downside – continue the correction to reach 1.3490.

GBPUSD
Risk Warning: the result of previous trading operations do not guarantee the same results in the future

USDRUB, “US Dollar vs Russian Ruble”

USDRUB is falling towards 75.00 and may later consolidate there. After that, the instrument may break the range to the downside and resume trading downwards with the target at 73.52.

USDRUB
Risk Warning: the result of previous trading operations do not guarantee the same results in the future

USDJPY, “US Dollar vs Japanese Yen”

USDJPY is extending the ascending wave. Possibly, today the pair may consolidate below 105.55. If later the price breaks this range to the downside, the market may start a new decline to break 105.00 and then continue falling with the target at 103.33.

USDJPY
Risk Warning: the result of previous trading operations do not guarantee the same results in the future

USDCHF, “US Dollar vs Swiss Franc”

USDCHF is moving upwards and has finished another ascending wave. Possibly, the par may for one more ascending structure to reach 0.9062. However, the asset may start plunging at any moment. The first target is at 0.8968.

USDCHF
Risk Warning: the result of previous trading operations do not guarantee the same results in the future

AUDUSD, “Australian Dollar vs US Dollar”

AUDUSD is still falling towards 0.7550. After that, the instrument may start another growth with the target at 0.7650.

AUDUSD
Risk Warning: the result of previous trading operations do not guarantee the same results in the future

BRENT

Brent has completed the ascending wave at 59.20. Possibly, today the asset may correct towards 57.30 and then form one more ascending structure with the target at 59.69.

BRENT
Risk Warning: the result of previous trading operations do not guarantee the same results in the future

XAUUSD, “Gold vs US Dollar”

Gold has finished the descending wave at 1795.50. Today, the metal may grow with the target at 1818.60 and then resume trading downwards to reach 1761.50.

GOLD
Risk Warning: the result of previous trading operations do not guarantee the same results in the future

BTCUSD, “Bitcoin vs US Dollar”

BTCUSD is correcting towards 35300.00. Later, the market may resume trading upwards to reach 39000.00 and then form a new descending structure with the target at 31700.00.

BITCOIN
Risk Warning: the result of previous trading operations do not guarantee the same results in the future

S&P 500

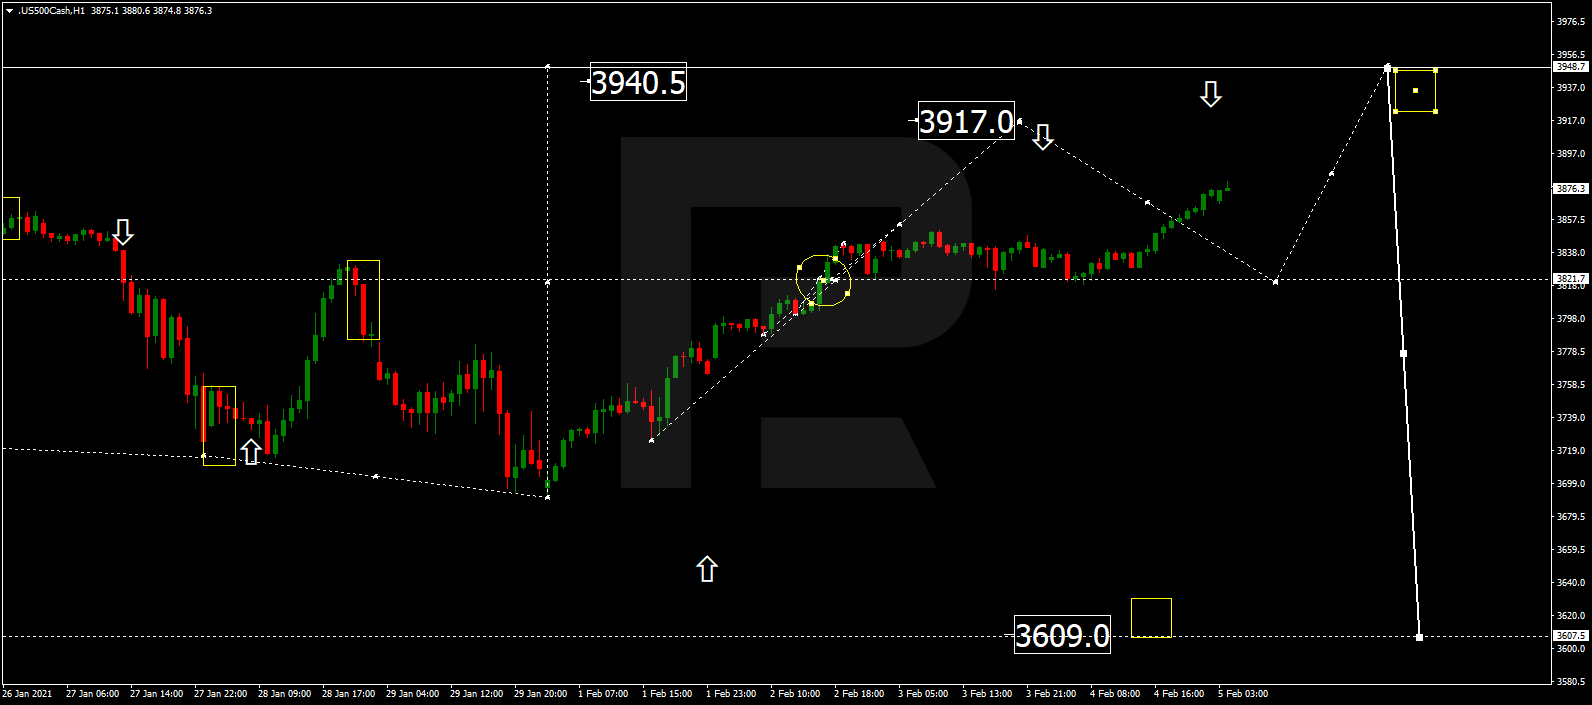
The S&P index has broken the consolidation range to the upside. Possibly, today the asset may continue growing to reach 3917.0 and then start a new decline towards 3821.7. After that, the instrument may form one more ascending wave with the target at 3948.7.

S&P 500

rfxsignals February 5, 2021 No Comments

Murrey Math Lines 05.02.2021 (Brent, S&P 500)

Murrey Math Lines 05.02.2021 (Brent, S&P 500)

05.02.2021

BRENT

As we can see in the H4 chart, Brent is trading above the 200-day Moving Average, thus indicating an ascending tendency. In this case, the asset is expected to break 6/8 and then continue moving upwards to reach the resistance at 7/8. However, this scenario may no longer be valid if the price breaks 5/8 to the downside. After that, the instrument may continue consolidating and falling towards the support at 4/8.

BRENT_H4
Risk Warning: the result of previous trading operations do not guarantee the same results in the future

In the M15 chart, the price may break the upside line of the VoltyChannel indicator and, as a result, continue the ascending tendency.

BRENT_M15
Risk Warning: the result of previous trading operations do not guarantee the same results in the future

S&P 500

In the H4, the S&P Index is trading above the 200-day Moving Average close to its all-time highs, thus indicating an ascending tendency. In this case, the asset is expected to continue growing towards the next resistance at 8/8. However, this scenario may no longer be valid if the price break 7/8 to the downside. After that, the instrument may correct downwards and reach the support at 6/8.

XAUUSD_H4
Risk Warning: the result of previous trading operations do not guarantee the same results in the future

As we can see in the M15 chart, the price has broken the upside line of the VoltyChannel indicator and, as a result, may continue its growth.

XAUUSD_M15

rfxsignals February 5, 2021 No Comments

Japanese Candlesticks Analysis 05.02.2021 (USDCAD, AUDUSD, USDCHF)

Japanese Candlesticks Analysis 05.02.2021 (USDCAD, AUDUSD, USDCHF)

05.02.2021

USDCAD, “US Dollar vs Canadian Dollar”

As we can see in the H4 chart, the ascending tendency continues. Right now, after forming an Engulfing reversal pattern not far from the support level, USDCAD is correcting again and may later continue growing towards 1.2910. After that, the asset may form another ascending impulse. However, an alternative scenario implies a further pullback towards 1.2750 before the asset resumes the rising tendency.

USDCAD
Risk Warning: the result of previous trading operations do not guarantee the same results in the future

AUDUSD, “Australian Dollar vs US Dollar”

As we can see in the H4 chart, the downtrend continues. Right now, after forming several reversal patterns, such as Harami, during the pullback not far from the resistance area, the pair may reverse and resume falling to reach the support area at 0.7565. At the same time, an opposite scenario says that the price may grow towards 0.7655 before resuming its decline.

AUDUSD
Risk Warning: the result of previous trading operations do not guarantee the same results in the future

USDCHF, “US Dollar vs Swiss Franc”

As we can see in the H4 chart, the uptrend continues. At the moment, after forming several reversal patterns, such as Hanging Man, not far from the resistance area, USDCHF is correcting. Later, the asset may complete the correction and resume the ascending tendency. The correctional target may be the support area at 0.8975. Still, there might be an alternative scenario, according to which the asset may start a new growth towards 0.9075 without falling and testing the support area.
USDCHF

rfxsignals February 5, 2021 No Comments

Ichimoku Cloud Analysis 05.02.2021 (ETHUSD, NZDUSD, AUDCHF)

Ichimoku Cloud Analysis 05.02.2021 (ETHUSD, NZDUSD, AUDCHF)

05.02.2021

ETHUSD, “Ethereum vs US Dollar”

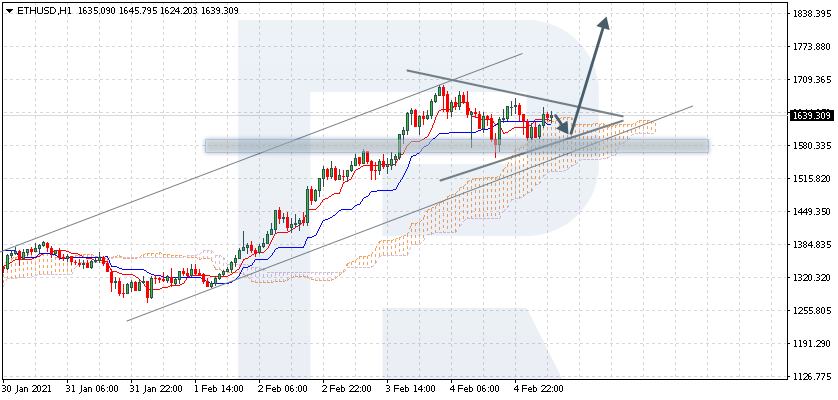
ETHUSD is trading at 1639.30; the instrument is moving above Ichimoku Cloud, thus indicating an ascending tendency. The markets could indicate that the price may test the cloud’s upside border at 1620.05 and then resume moving upwards to reach 1835.00. Another signal in favor of a further uptrend is a rebound from the downside border of a Triangle pattern. However, the bullish scenario may no longer be valid if the price breaks the cloud’s downside border and fixes below 1505.00. In this case, the pair may continue falling towards 1415.00. To confirm further growth, the asset must break the pattern’s upside border and fix above 1685.00.

ETHUSD
Risk Warning: the result of previous trading operations do not guarantee the same results in the future

NZDUSD, “New Zealand Dollar vs US Dollar”

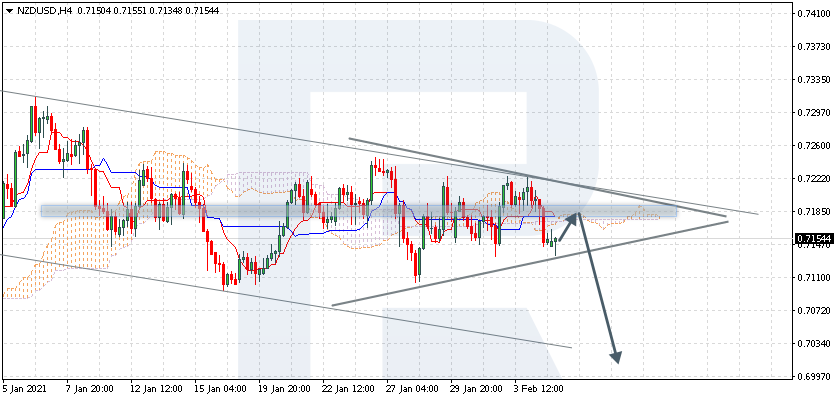
NZDUSD is trading at 0.7154; the instrument is moving below Ichimoku Cloud, thus indicating a descending tendency. The markets could indicate that the price may test the cloud’s downside border at 0.7175 and then resume moving downwards to reach 0.7005. Another signal in favor of a further downtrend will be a rebound from the resistance area. However, the bearish scenario may be canceled if the price breaks the cloud’s upside border and fixes above 0.7220. In this case, the pair may continue growing towards 0.7295. To confirm further decline, the asset must break the downside border of the Triangle pattern and fix below 0.7105.

NZDUSD
Risk Warning: the result of previous trading operations do not guarantee the same results in the future

AUDCHF, “Australian Dollar vs Swiss Franc”

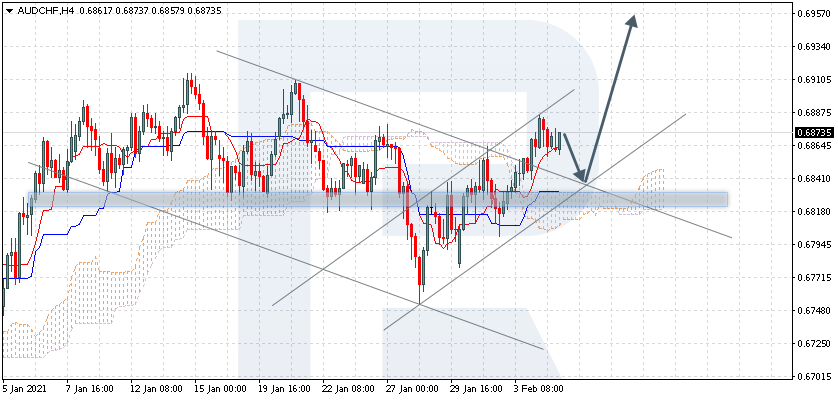
AUDCHF is trading at 0.6873; the instrument is moving above Ichimoku Cloud, thus indicating an ascending tendency. The markets could indicate that the price may test Tenkan-Sen and Kijun-Sen at 0.6840 and then resume moving upwards to reach 0.6955. Another signal in favor of a further uptrend will be a rebound from the descending channel’s upside border. However, the bullish scenario may no longer be valid if the price breaks the cloud’s downside border and fixes below 0.6790. In this case, the pair may continue falling towards 0.6735.

AUDCHF

rfxsignals February 5, 2021 No Comments

The Euro continues falling. Overview for 05.02.2021

The Euro continues falling. Overview for 05.02.2021

05.02.2021

Bearish pressure on EURUSD continues on Friday; market players are rooting for the “greenback”.

They continue selling the major currency pair at the end of the first February week. The current quote for the instrument is 1.1960.

Market players are still rooting for the USD and against the Euro due to the weak macroeconomic statistics published by the alliance and its members. Another reason is a gloomy economic outlook due to lockdowns in Europe.

The statistics published by the USA yesterday indicated that the weekly Unemployment Claims report showed 779K after being 812K the week before and against the expected reading of 828K. it’s a very good number and a positive signal for the American economy.

The Factory Orders showed +1.1% m/m in December against the expected reading of +0.7% m/m. by the way, the November data was revised upwards, +1.3% m/m, which is also quite good. The Construction Spending also boosted and added 1.0% m/m in December against the expected reading of +0.8% m/m, and that’s also good.

Today’s an important day as the USA continues reporting on its labor market for January. The Unemployment Rate is expected to remain at 6.7%, while the Non-Farm Employment Change may show 85K after losing 140K in December, which may yet be revised upwards. The Average Hourly Earnings indicator is expected to add 0.3% m/m after expanding by 0.8% m/m the month before.

The more stable the numbers, the better for the USD.

rfxsignals February 5, 2021 No Comments

Fibonacci Retracements Analysis 05.02.2021 (BITCOIN, ETHEREUM)

Fibonacci Retracements Analysis 05.02.2021 (BITCOIN, ETHEREUM)

05.02.2021

BTCUSD, “Bitcoin vs US Dollar”

As we can see in the H4 chart, the asset is about to complete its correctional downtrend and start a new rising wave towards the high. A breakout of the current high at 42017.50 will result in a further uptrend towards the post-correctional extension area between 138.2% and 161.8% fibo at 47080.00 and 50213.00 respectively. However, an alternative scenario suggests that BTCUSD may break the local low at 28812.50 and continue falling to reach 38.2%, 50.0%, and 61.8% fibo at 27480.00, 22970.00, and 18507.00 respectively again

BTCUSD
Risk Warning: the result of previous trading operations do not guarantee the same results in the future

The H1 chart shows a new rising wave, which is approaching 76.0% fibo at 38870.00. It’s been the second time the asset is trying to reach this level and may result in a further uptrend towards the high at 42017.50. In the short-term, the pair may correct – a divergence on MACD is a good signal in favor of this scenario.

BITCOIN
Risk Warning: the result of previous trading operations do not guarantee the same results in the future

ETHUSD, “Ethereum vs. US Dollar”

The H4 chart shows a new wave within the uptrend, which is probably the most stable uptrend in the currency market. Possibly, the asset may break the high at 1698.13 and then reach the post-correctional extension area between 138.2% and 161.8% fibo at 1930.90 and 2248.70 respectively. However, there is a divergence on MACD, which may hint at a new short-term correction to reach 23.6%, 38.2%, 50.0%, and 61.8% fibo at 1315.85, 1080.95, 889.10, and 700.50 respectively.

ETHUSD
Risk Warning: the result of previous trading operations do not guarantee the same results in the future

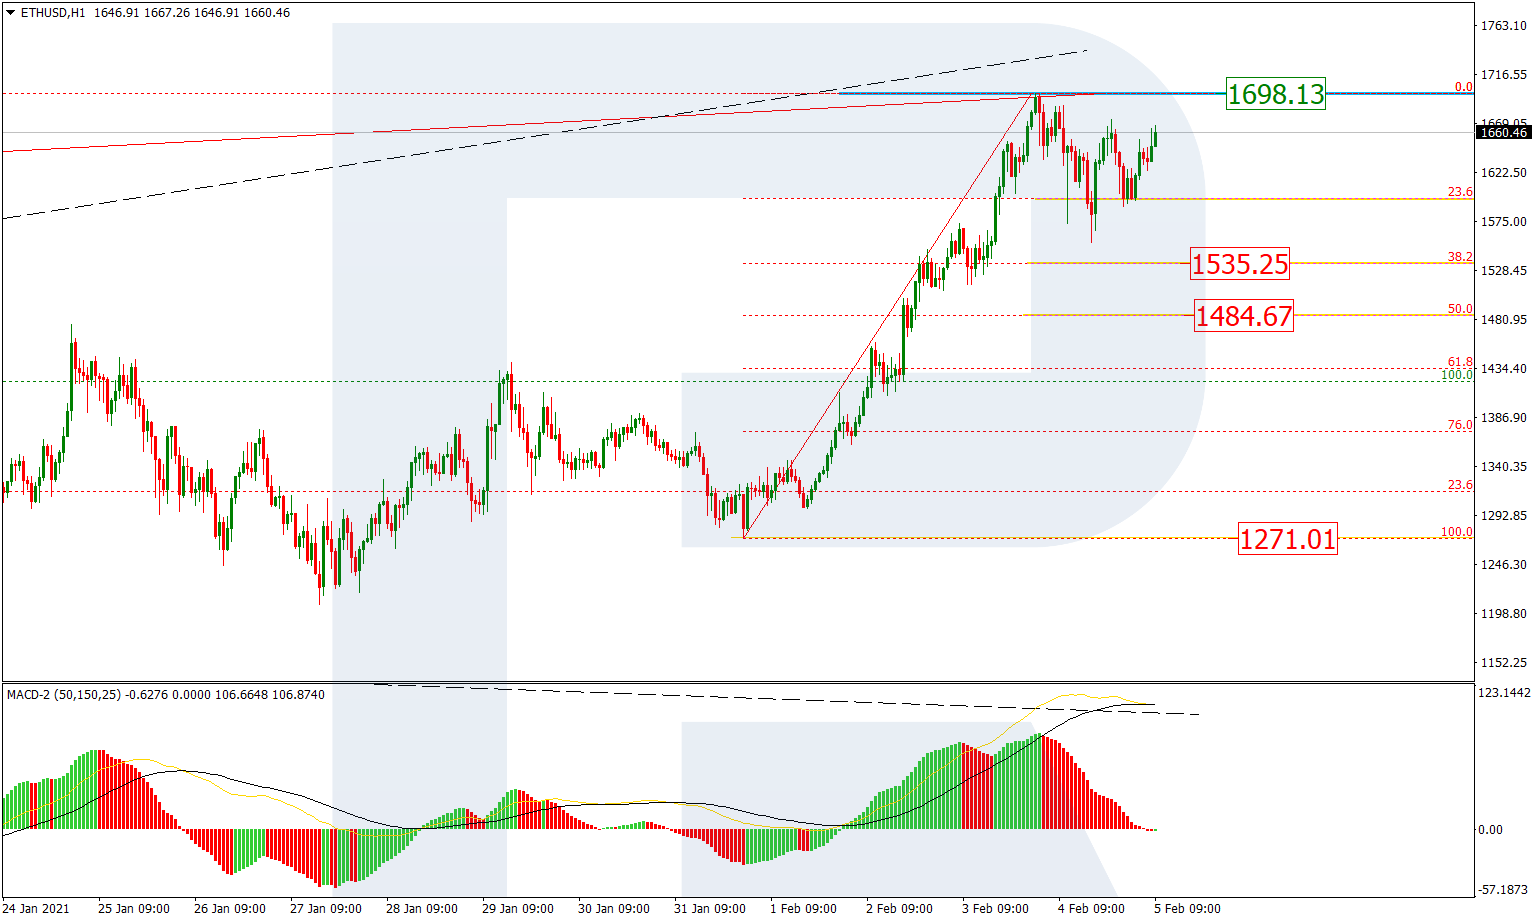
As we can see in the H1 chart, the pair is correcting after completing the ascending wave and has already reached 23.6% fibo. Later, the price may continue falling towards 38.2% and 50.0% fibo at 1535.25 and 1484.67 respectively. At the same time, a breakout of the local low at 1207.60 may hint at a further mid-term downtrend.

ETHEREUM

Daily Free Forex Signals For 04/02/2021

Here your going to see Daily Free Forex Signals For 04/02/2021 to free forex signal alert from our kitkat trading system and other trading logic’s .we provide like this free forex signals from 2012 on wards with more than 50,000 traders around the world .The free forex signals have 70 to 85% quality always .we give for you a note as maximum focus take profit 1 as your target and must use stop loss values .if you have any other query’s please visit our live chat or email option

EURUSD SELL-1.201053
SL-1.204419
TP1-1.19947
TP2-1.197922

CADCHF BUY-0.703363
SL-0.700092
TP1-0.704879
TP2-0.706389

EURNZD SELL-1.668294
SL-1.671713
TP1-1.666795
TP2-1.665281

EURCAD SELL-1.534819
SL-1.538713
TP1-1.53325
TP2-1.531625

CADJPY BUY-82.187755
SL-81.868627
TP1-82.343673
TP2-82.503859

GBPAUD BUY
SL-1.75140
TP-1.79160

AUDNZD SELL
SL-1.09359
TP-1.05339

GBPUSD BUY-1.367388
SL-1.362752
TP1-1.368912
TP2-1.370347

GBPJPY BUY-143.898219
SL-143.482263
TP1-144.056846
TP2-144.208423

GBPCAD BUY-1.751645
SL-1.747555
TP1-1.753173
TP2-1.7547

EURGBP SELL-0.877344
SL-0.880673
TP1-0.875799
TP2-0.874083