Forex Technical Analysis & Forecast 04.02.2021
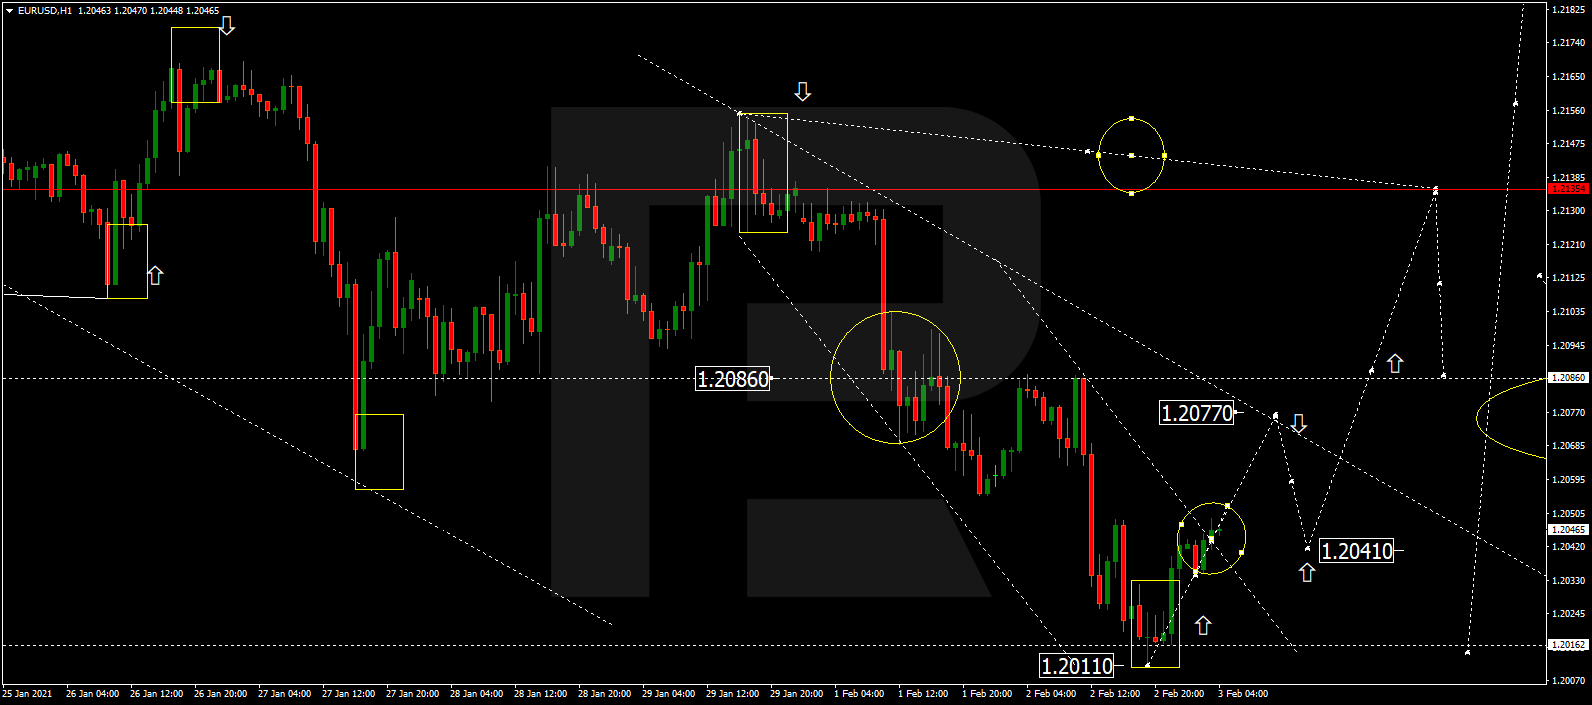
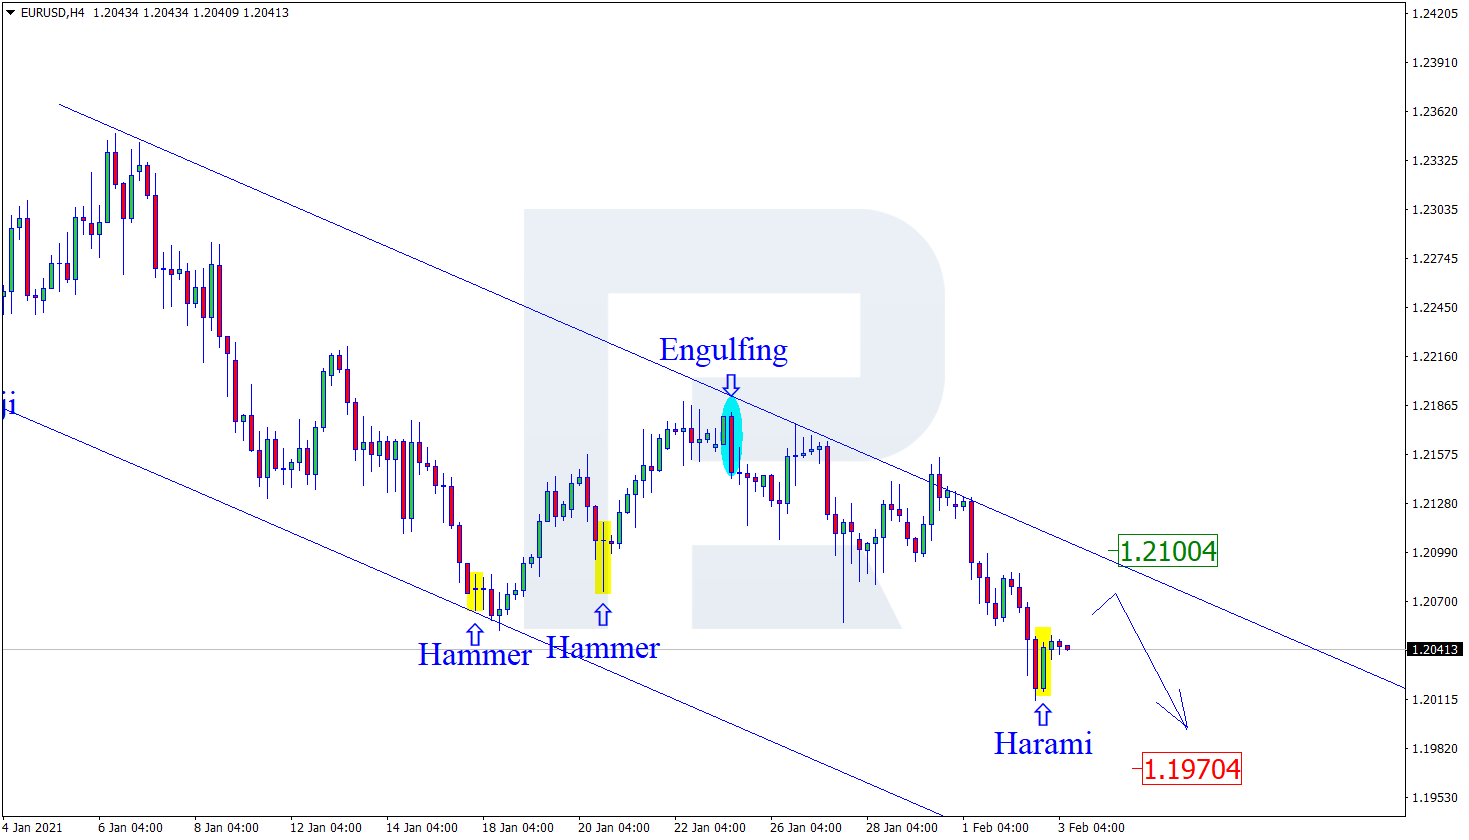
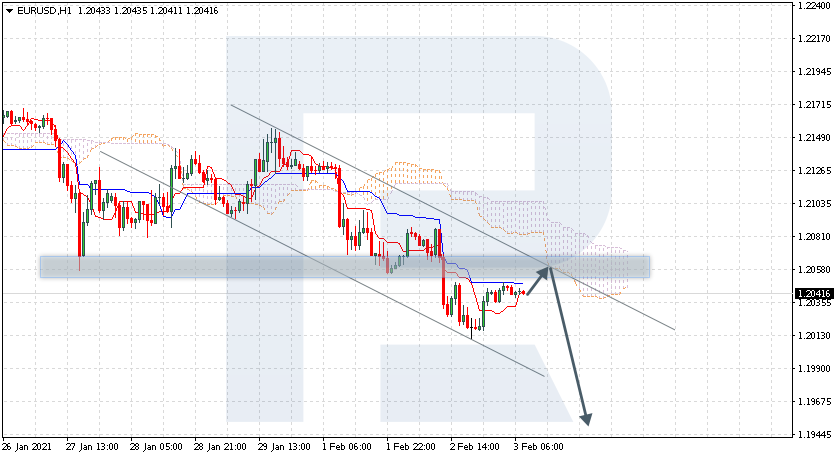
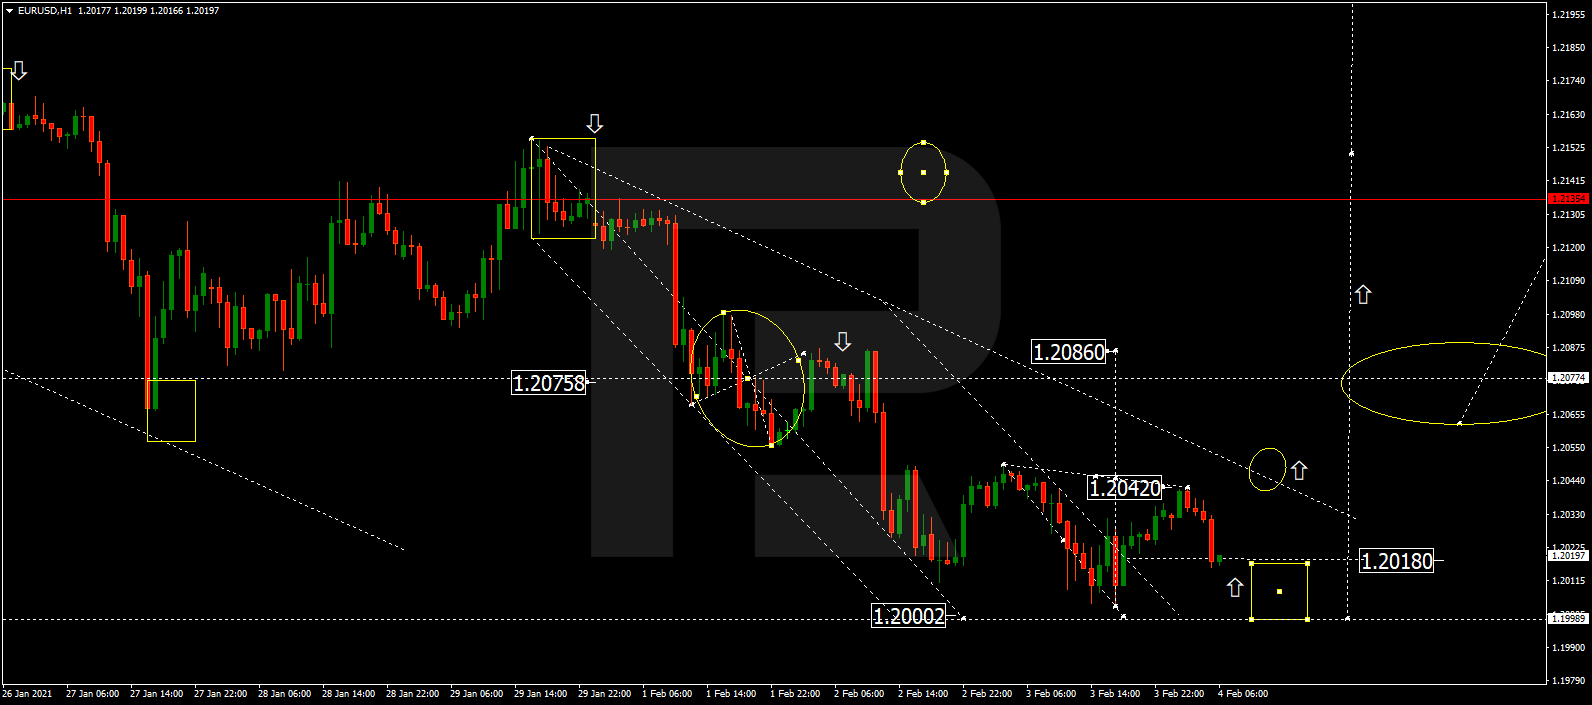
EURUSD, “Euro vs US Dollar”
After expanding the range down and up to 1.2003 and 1.2042 respectively, EURUSD is still consolidating around 1.2025. If later the price breaks this range to the upside, the market may resume growing with the target at 1.2086; if to the downside – start a new decline to update 1.2000 and then form one more ascending wave to reach the above-mentioned target.

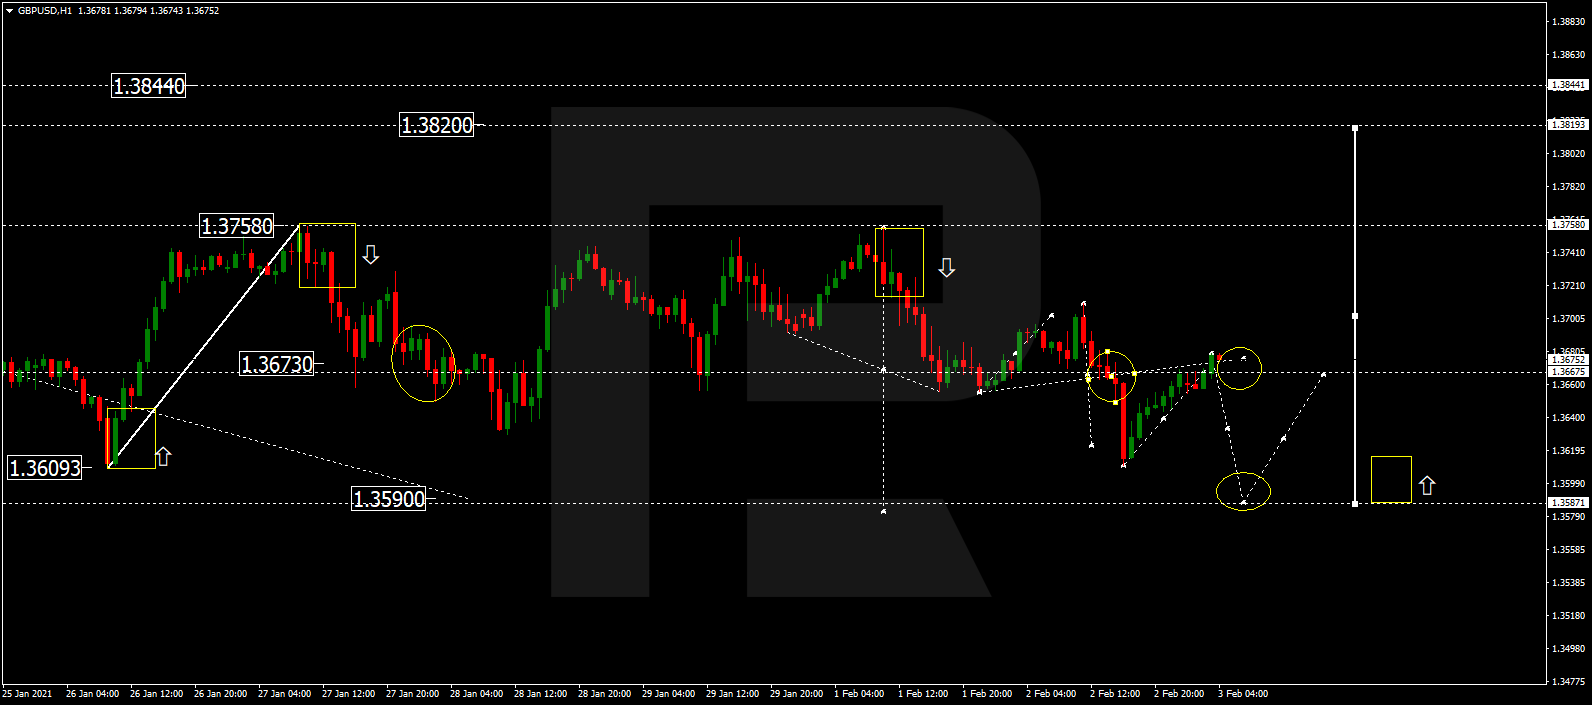
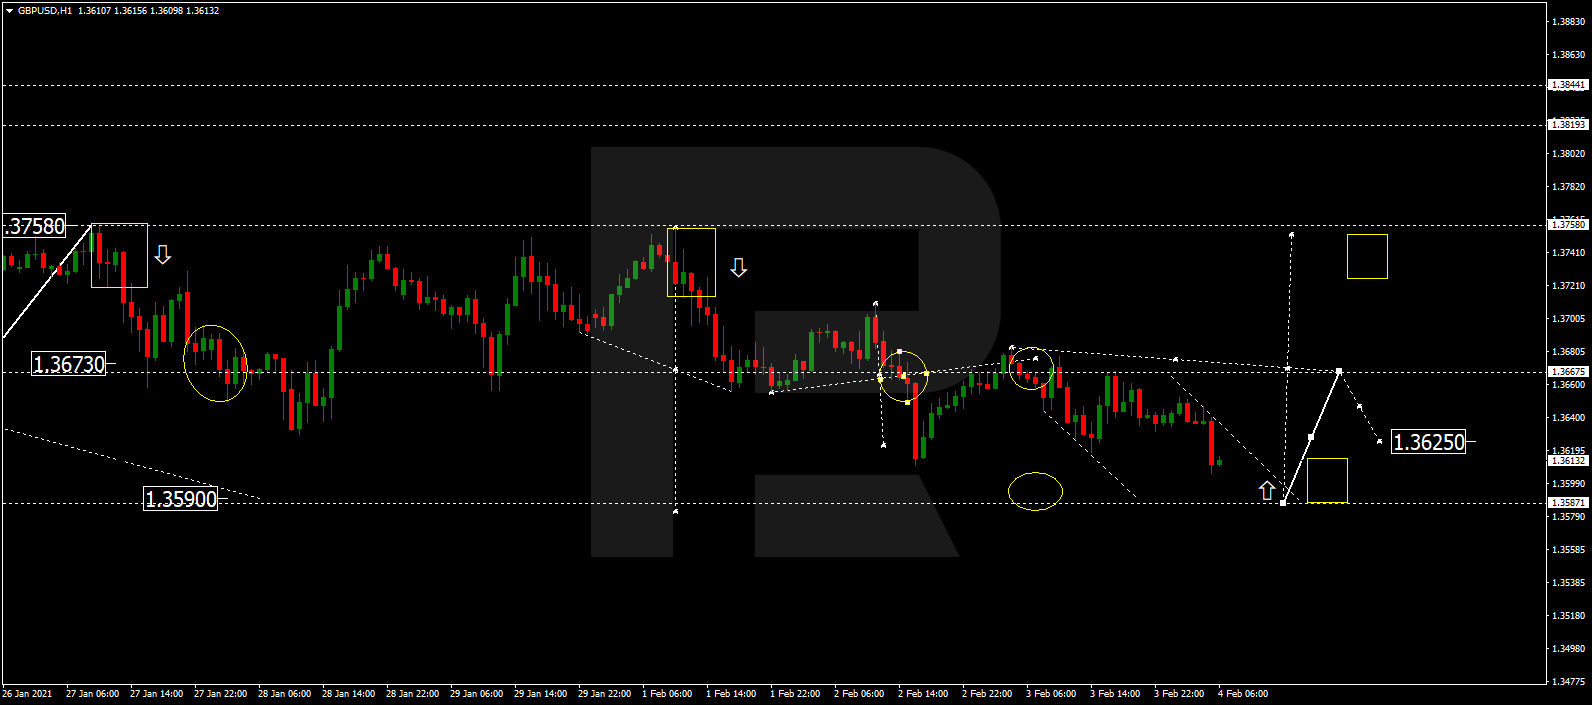
GBPUSD, “Great Britain Pound vs US Dollar”
GBPUSD is still falling towards 1.3590 and may later consolidate there. After that, the instrument may break the range to the upside and form one more ascending wave with the target at 1.3750.
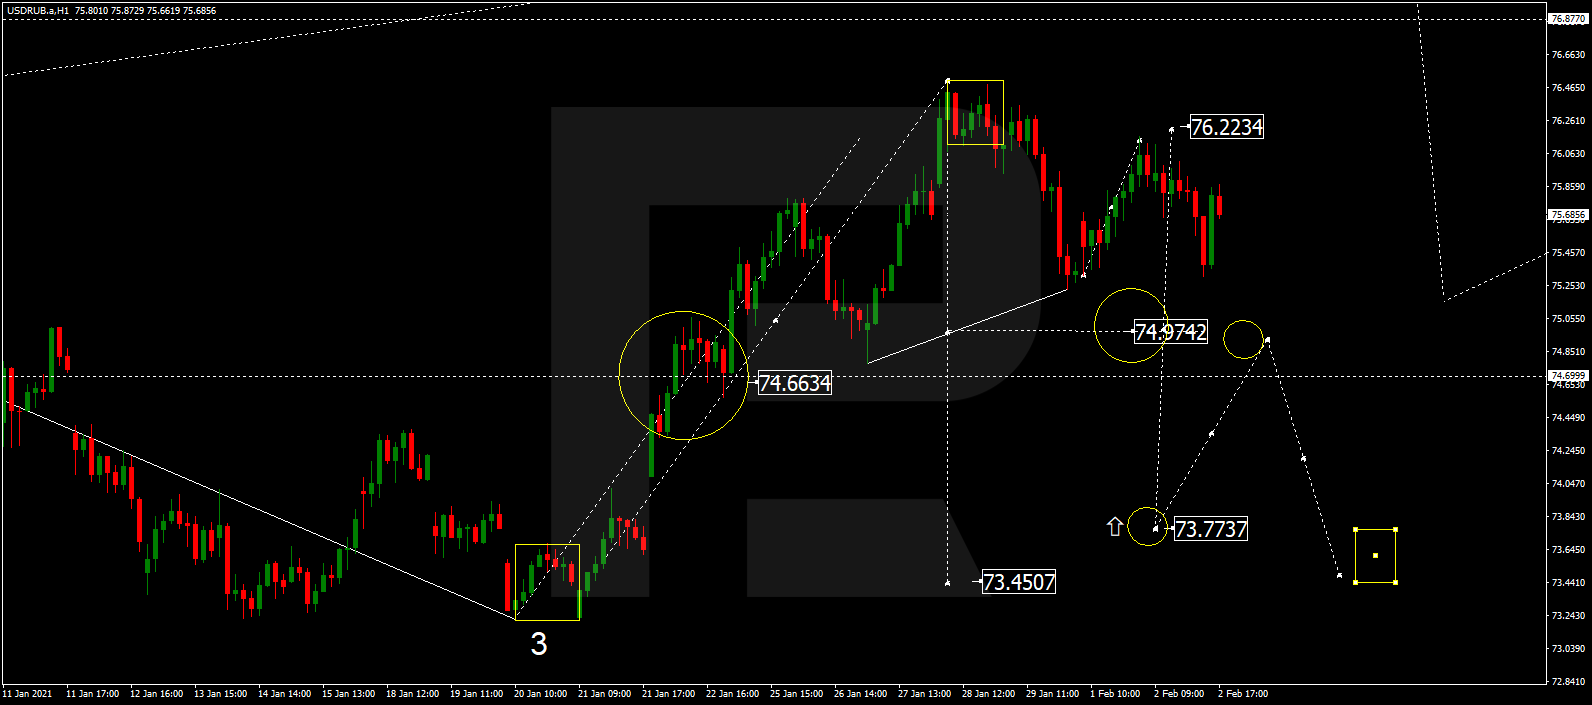
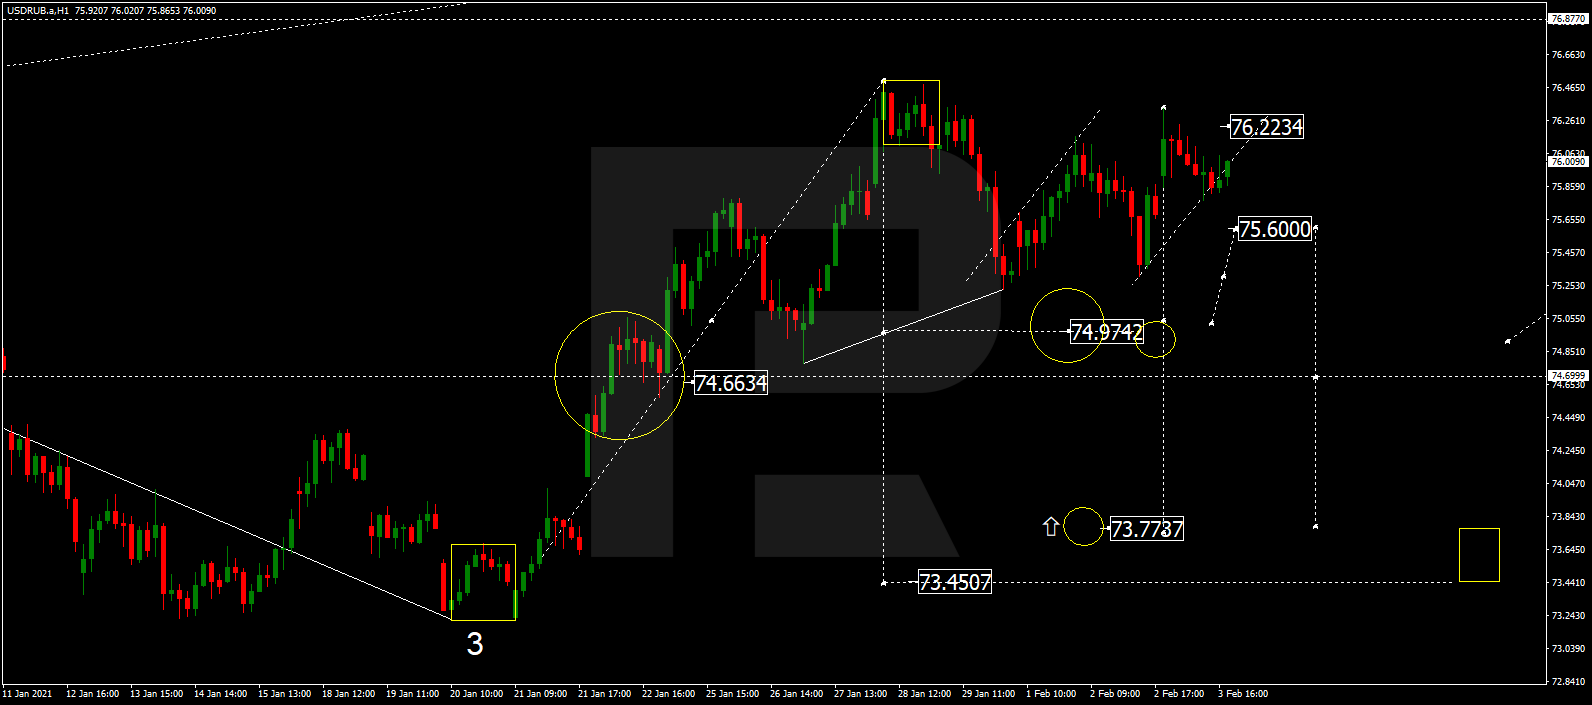
USDRUB, “US Dollar vs Russian Ruble”
USDRUB has completed the ascending wave 76.22. Today, the pair may start another decline to break 75.60 and continue trading downwards with the target at 74.94.
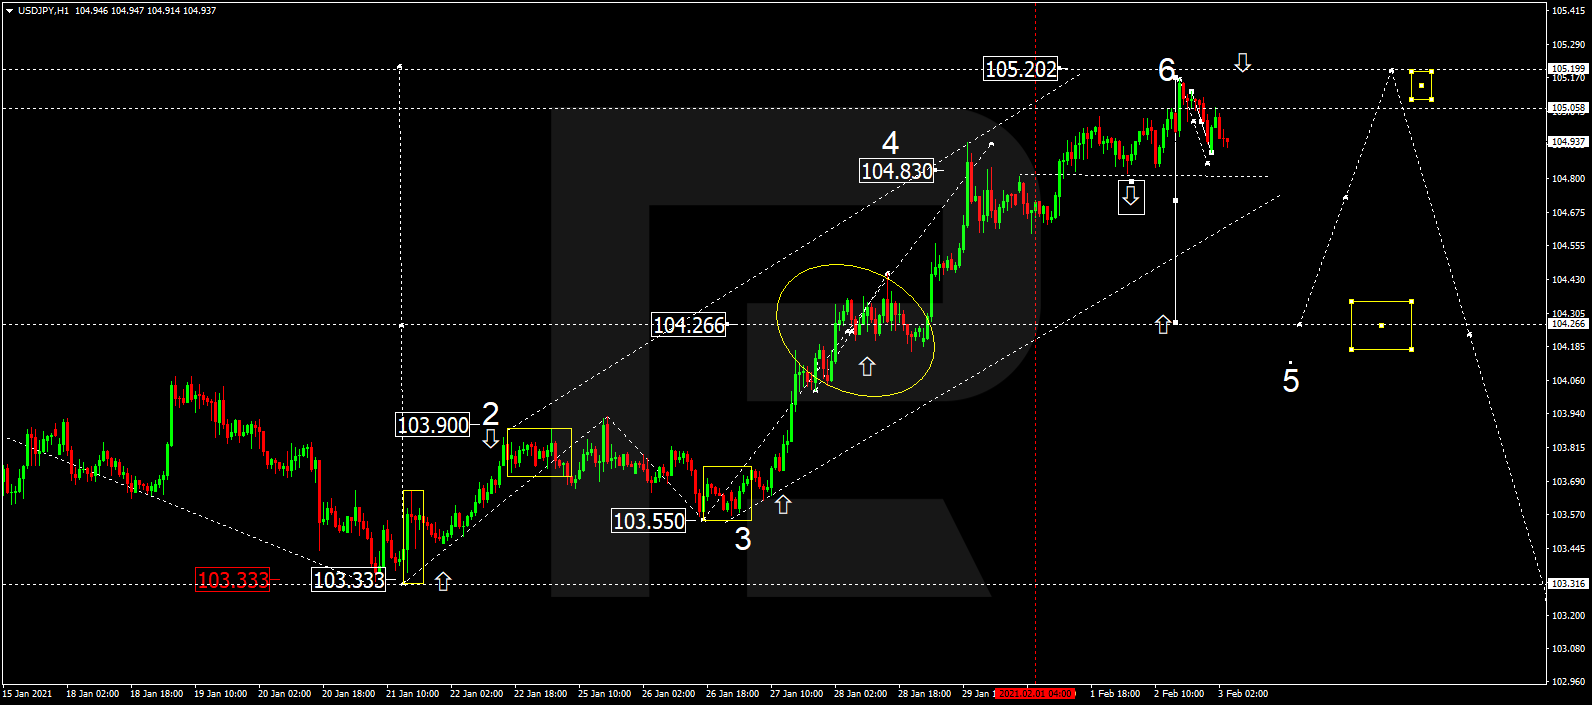
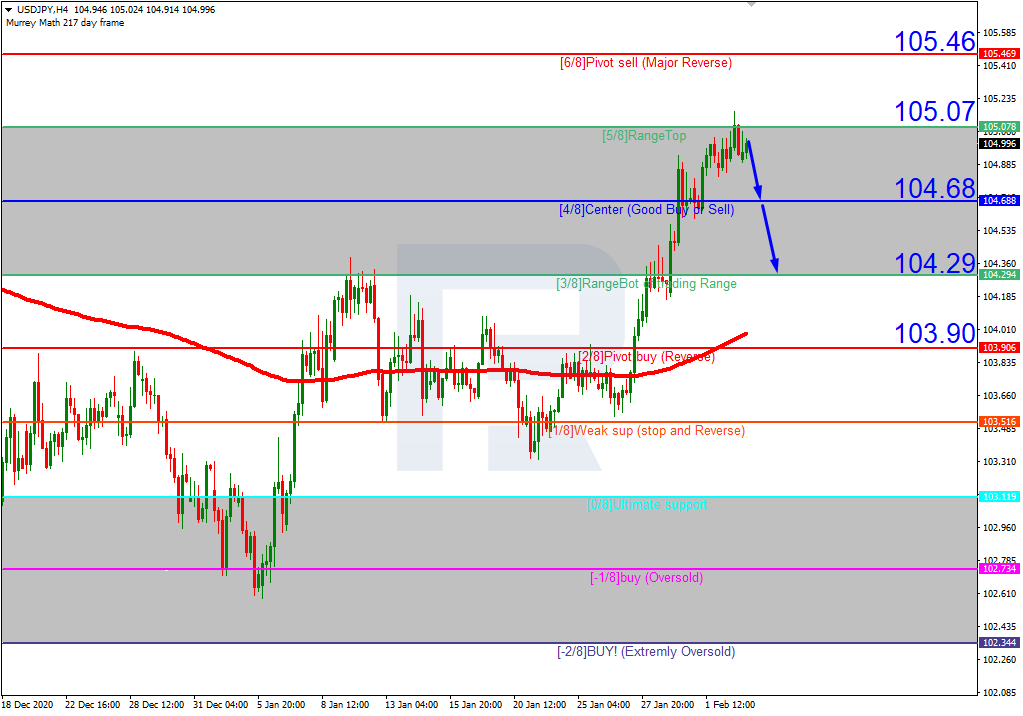
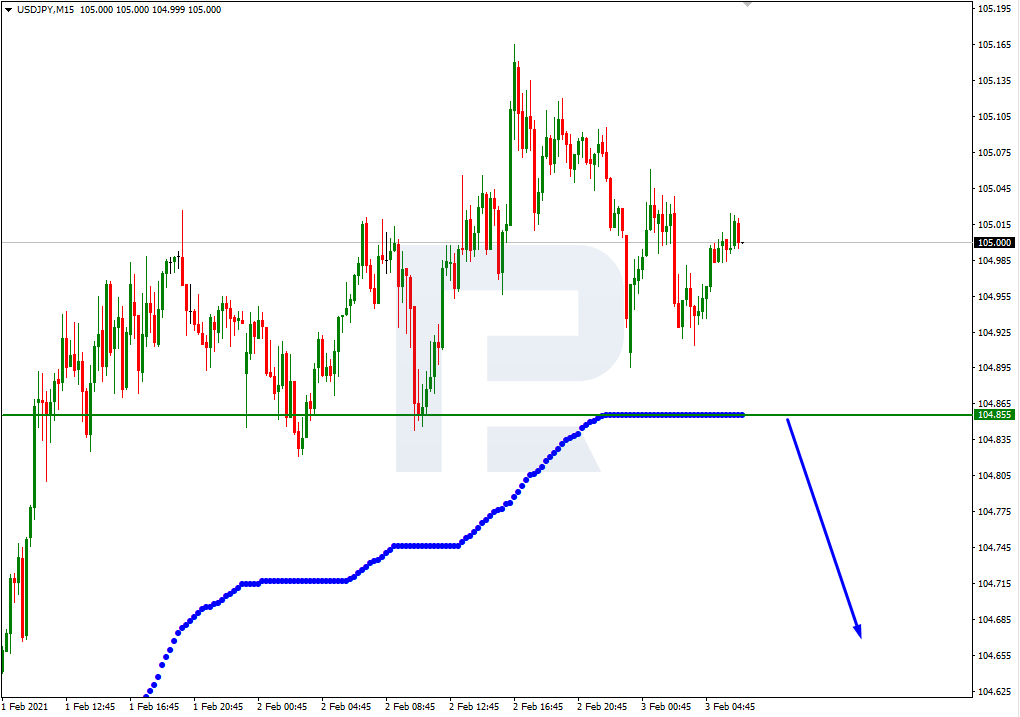
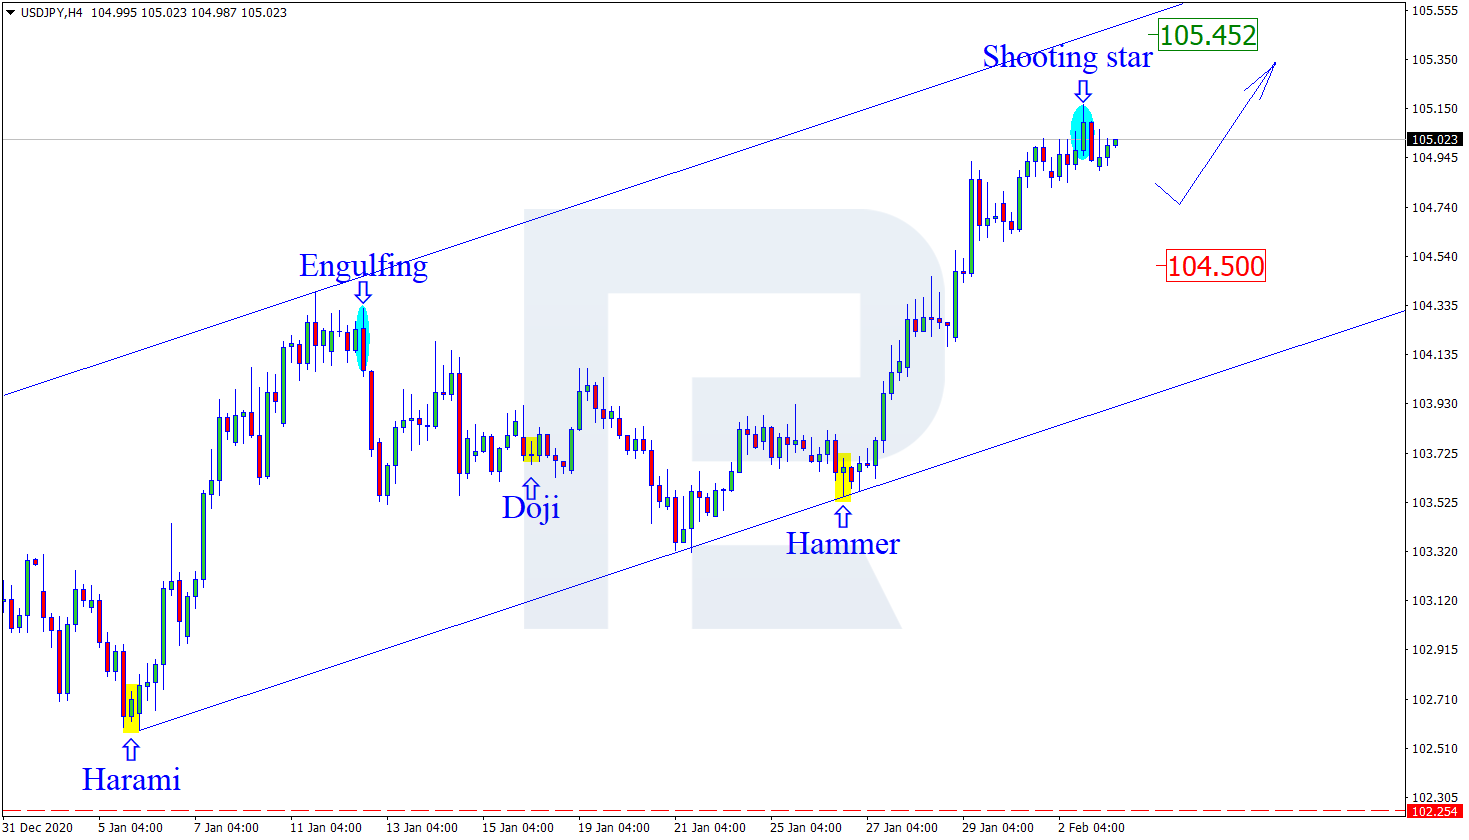
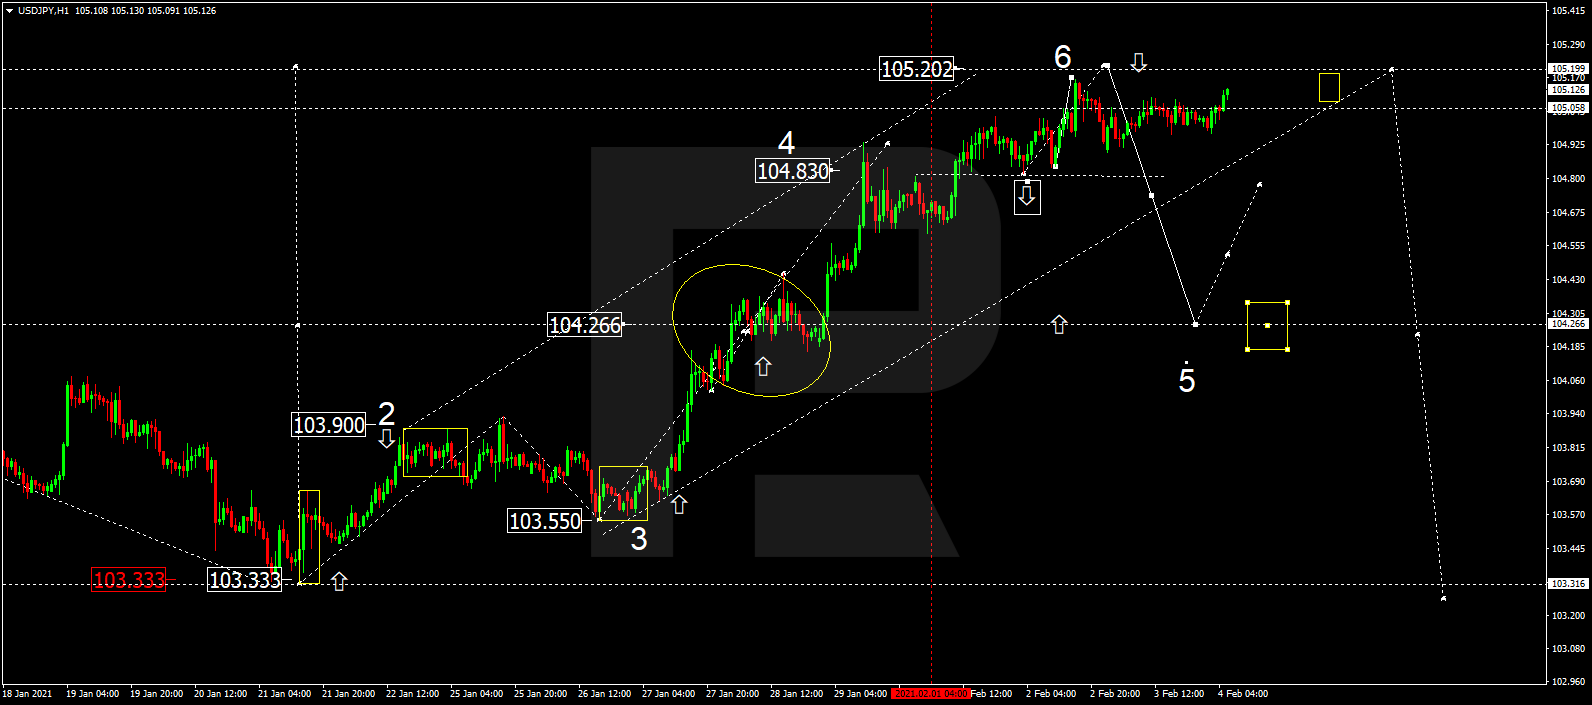
USDJPY, “US Dollar vs Japanese Yen”
USDJPY is still growing towards 105.20. After that, the instrument may form a new descending structure to break 104.00 and then continue falling with the target at 103.33.
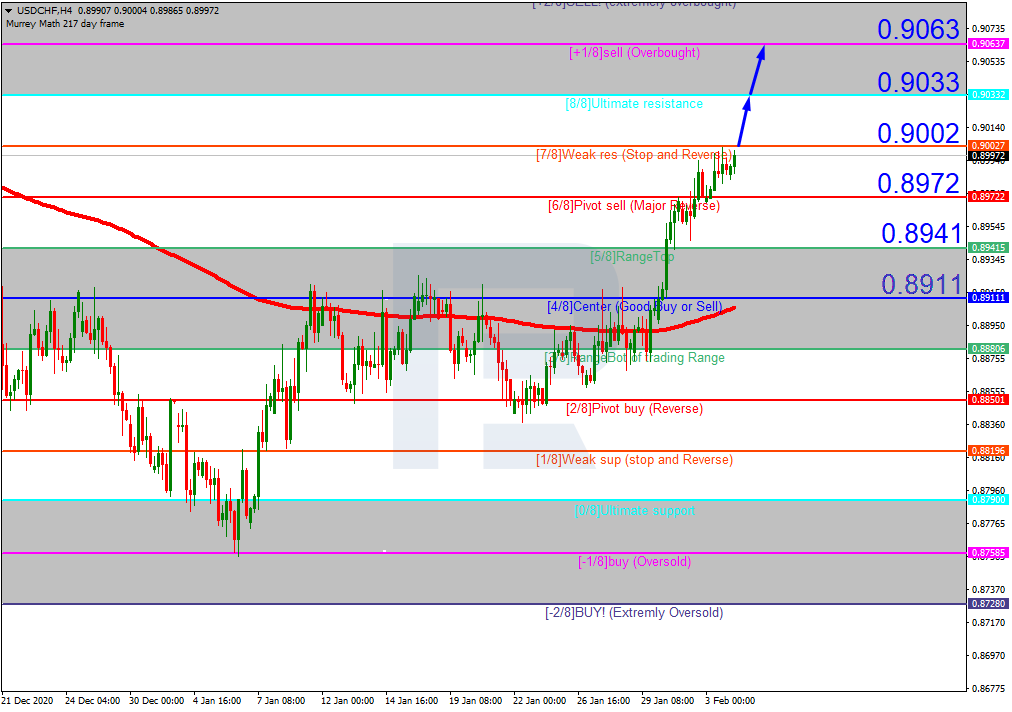
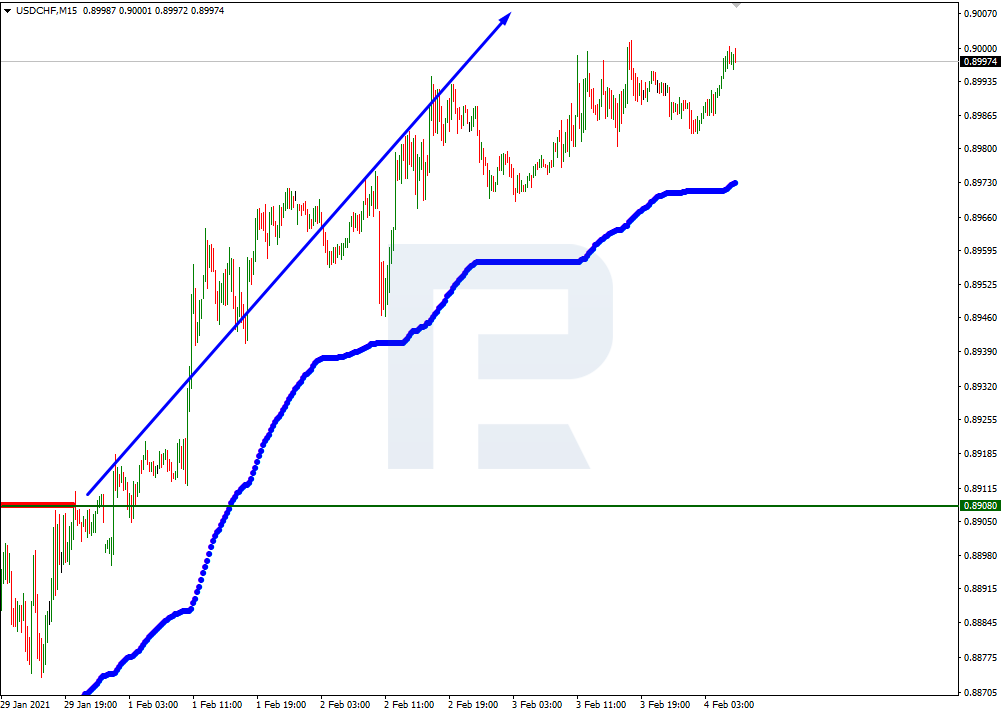
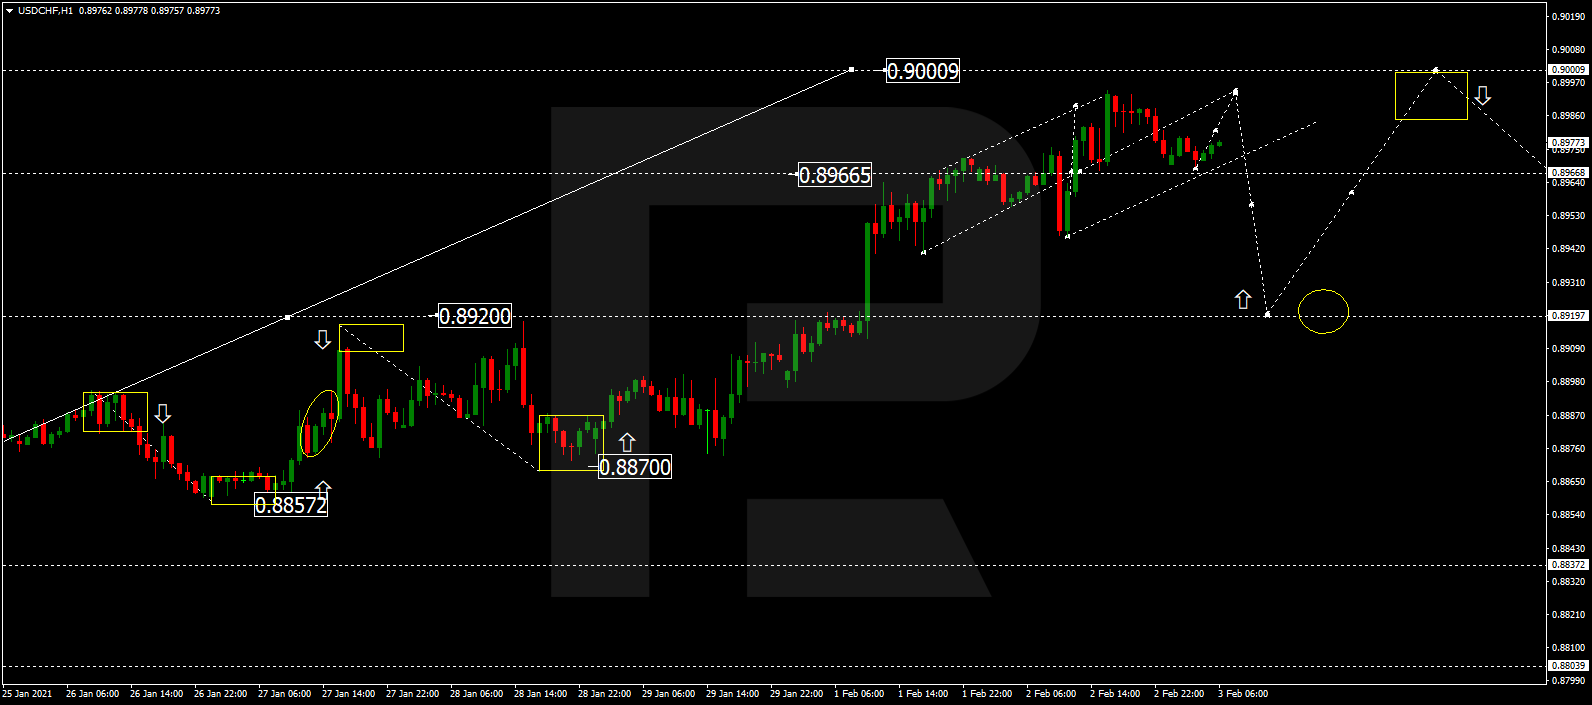
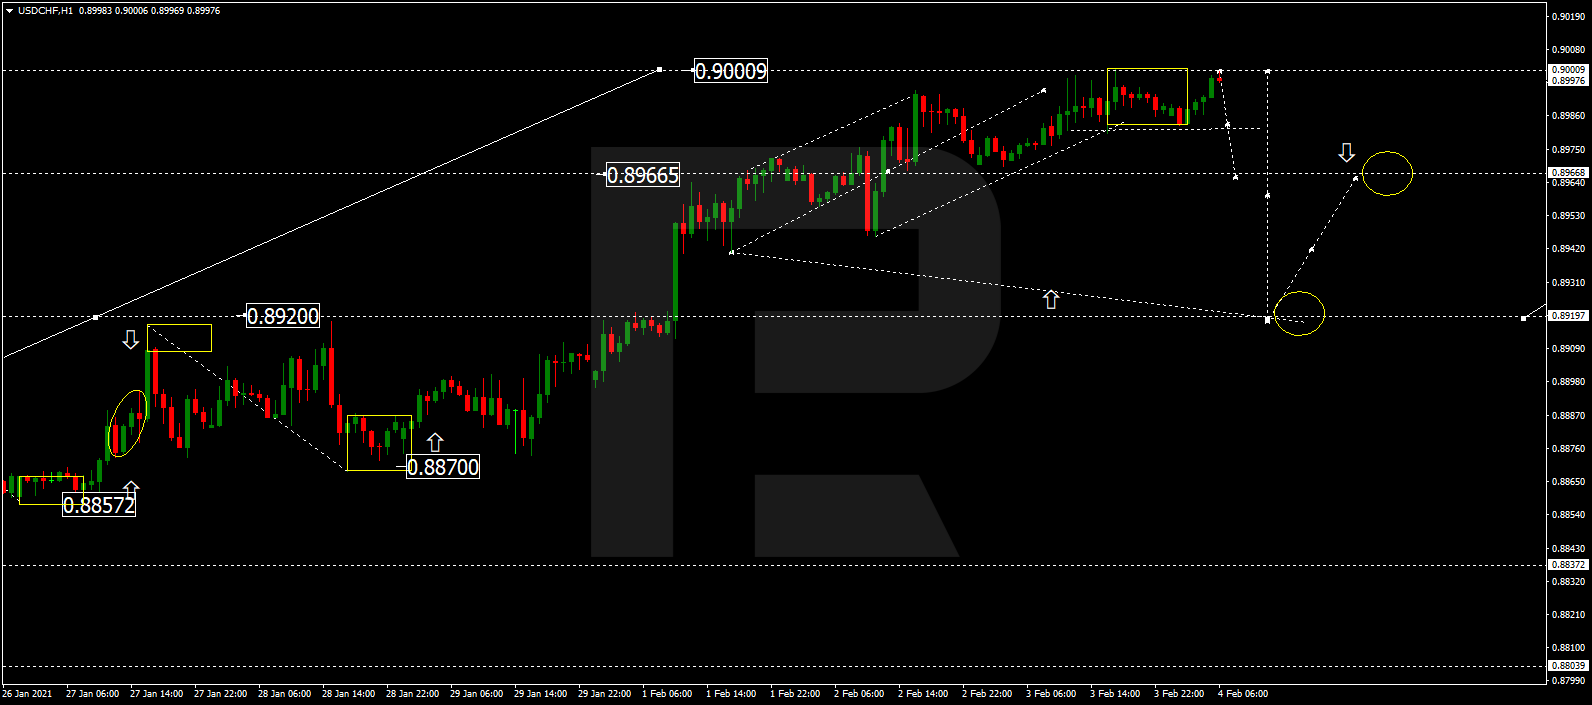
USDCHF, “US Dollar vs Swiss Franc”
USDCHF has finished the ascending wave at 0.9000; right now, it is forming a new consolidation range around this level. Today, the pair may break the range to the downside and resume trading upwards with the first target at 0.8920.
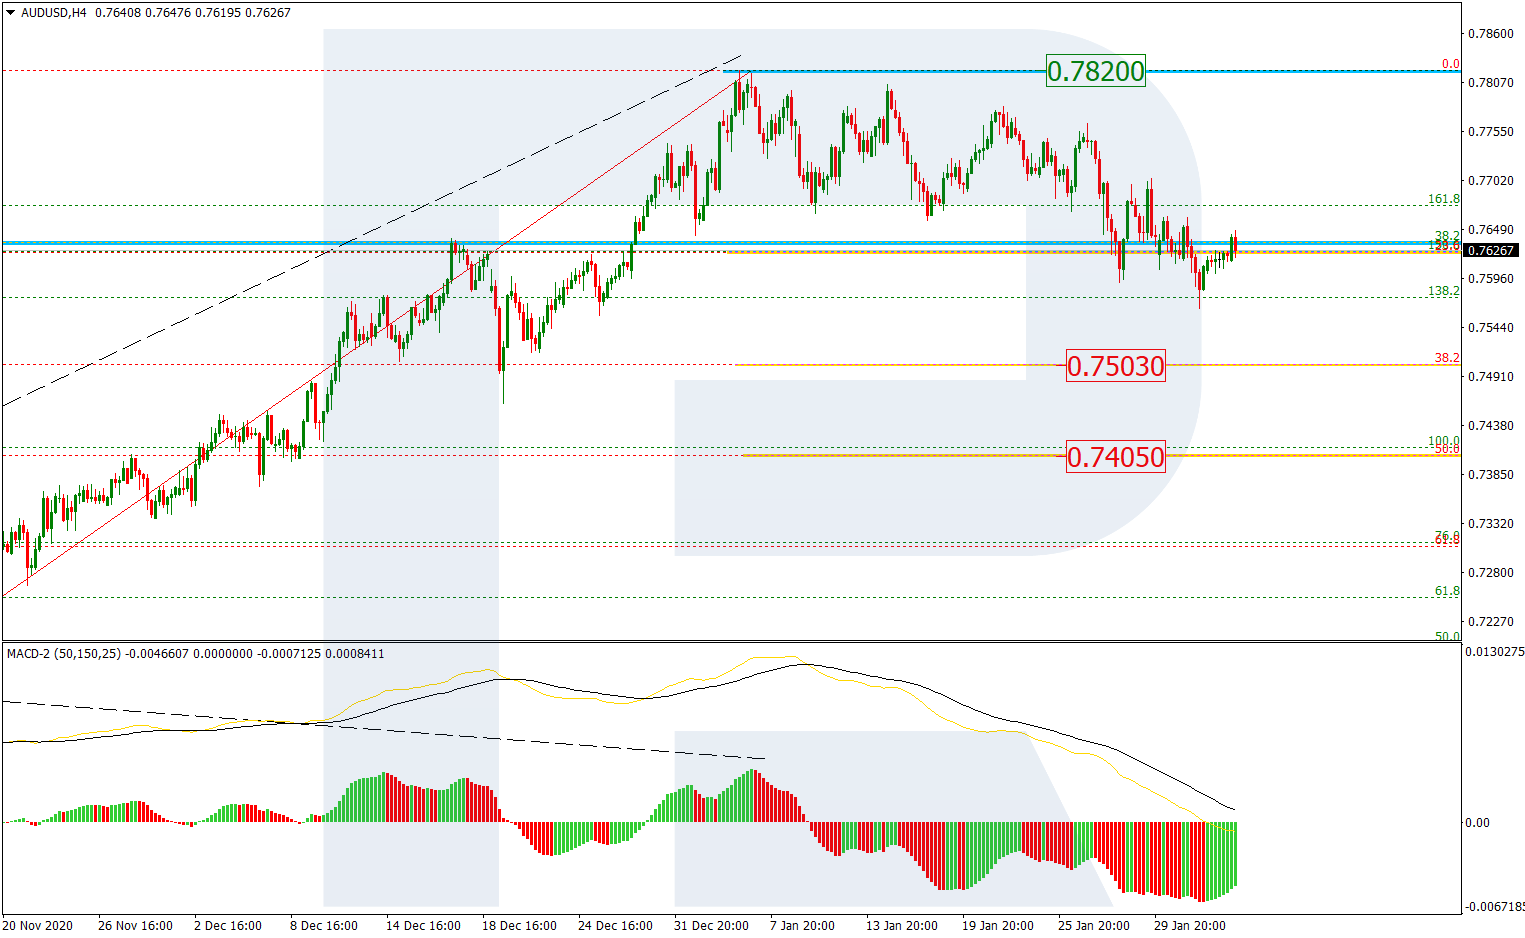
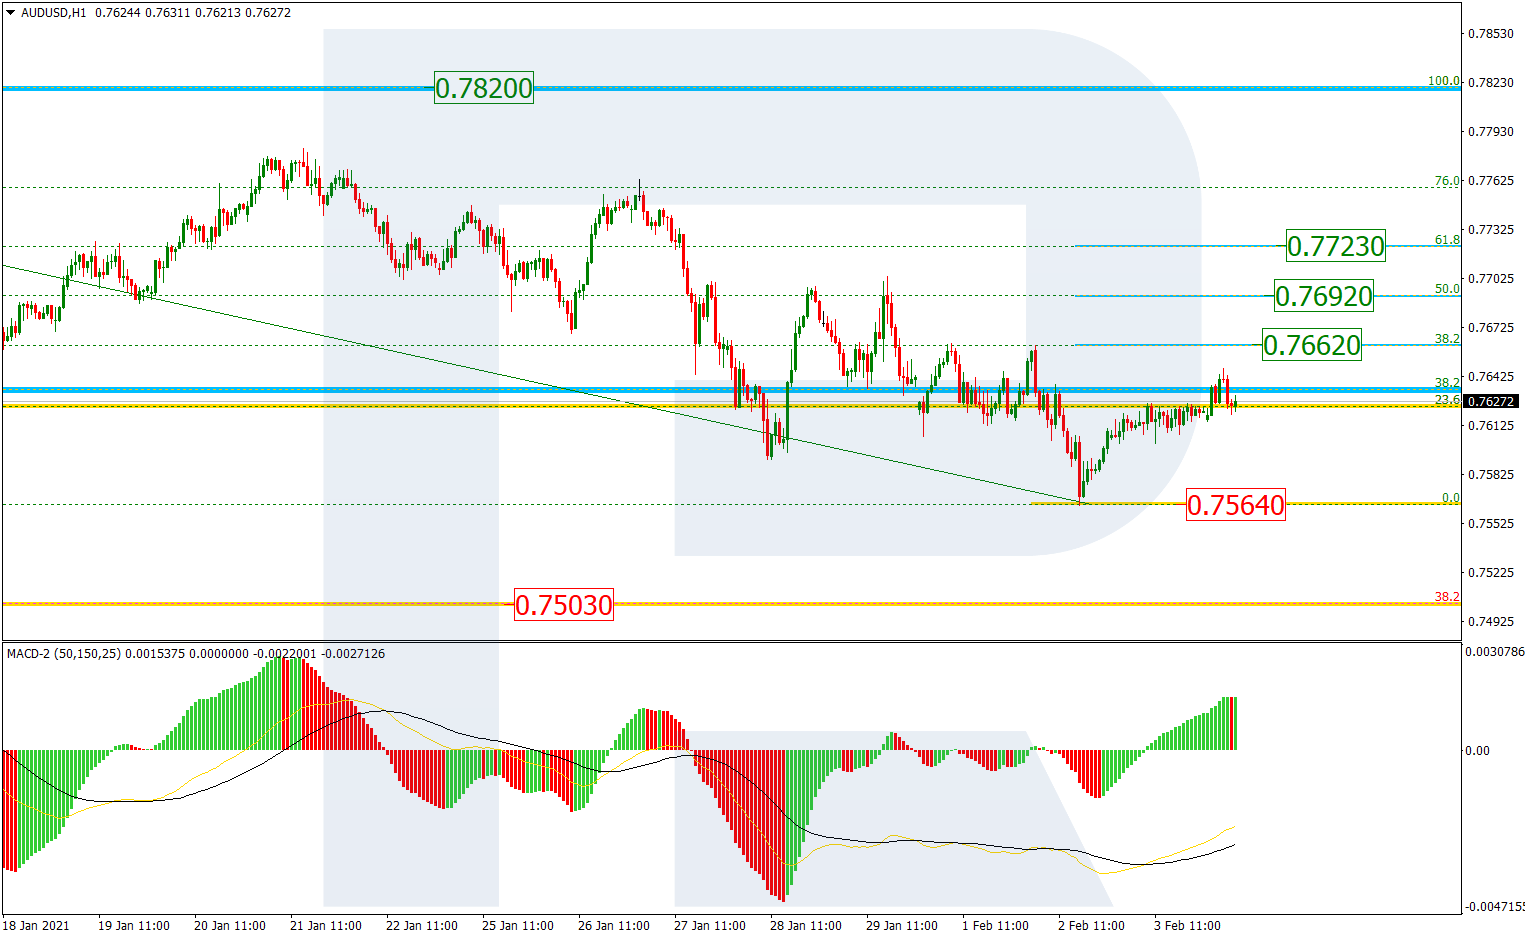
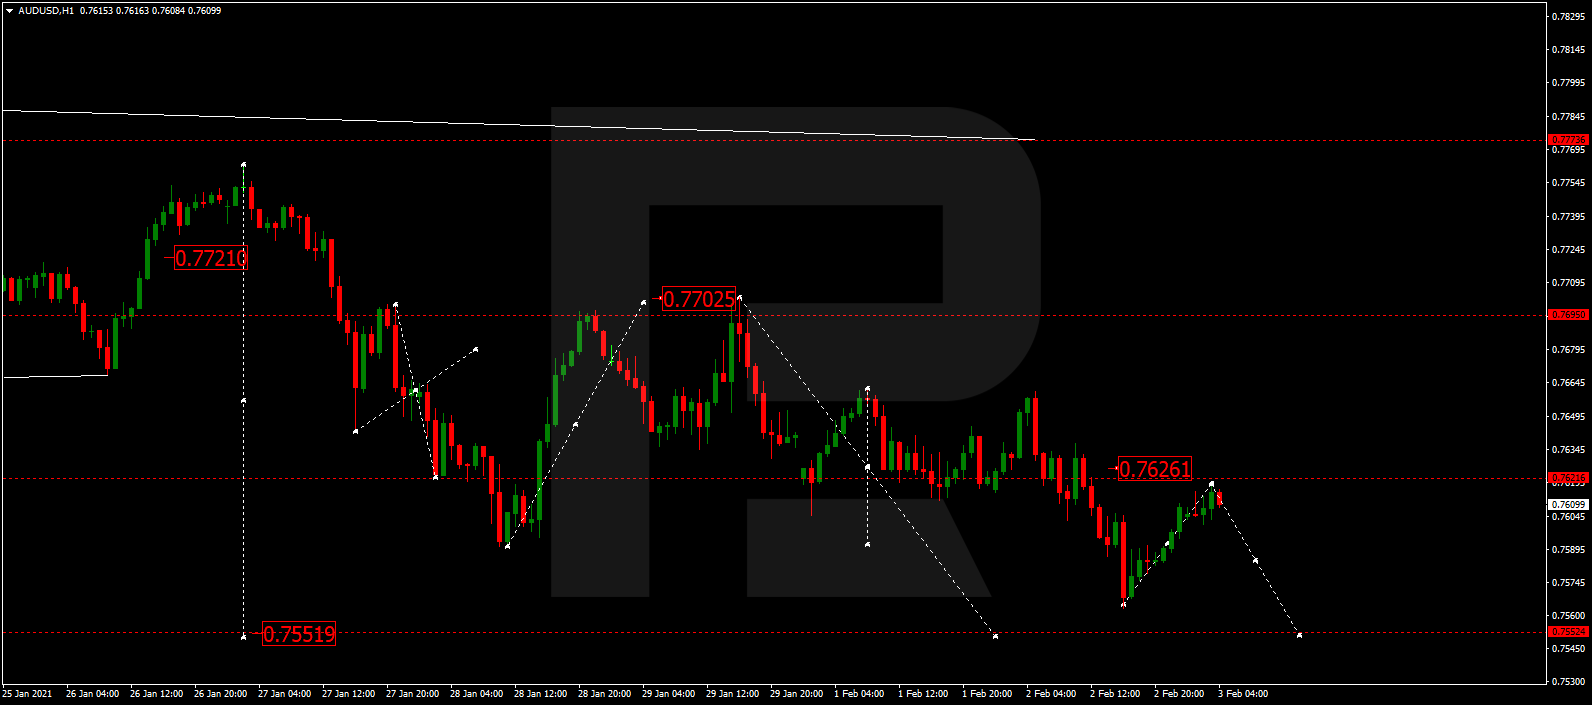
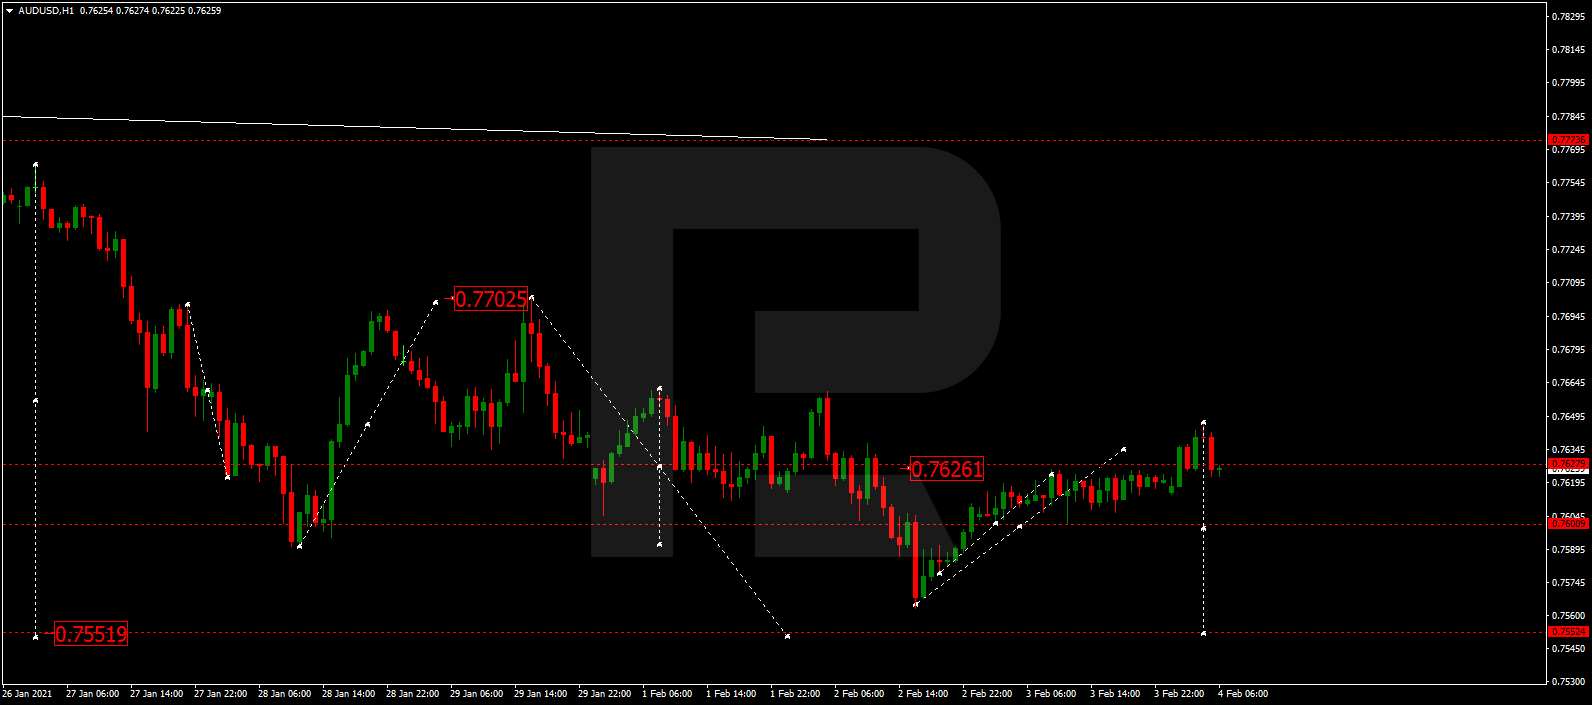
AUDUSD, “Australian Dollar vs US Dollar”
After returning to 0.7626, AUDUSD is consolidating around this level. Possibly, the pair may break the range to the downside and move downwards to reach 0.7552. After that, the instrument may start another growth with the target at 0.7700.
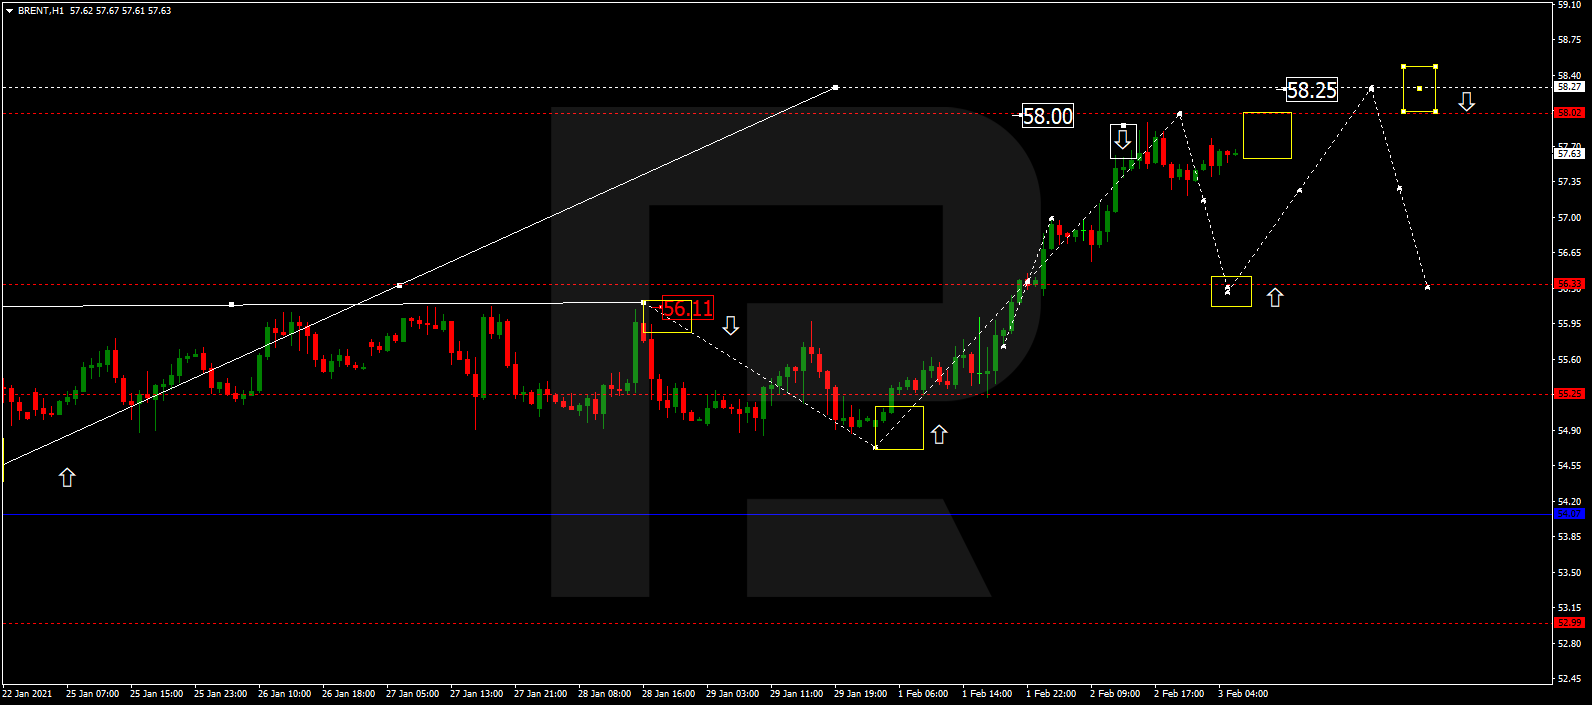
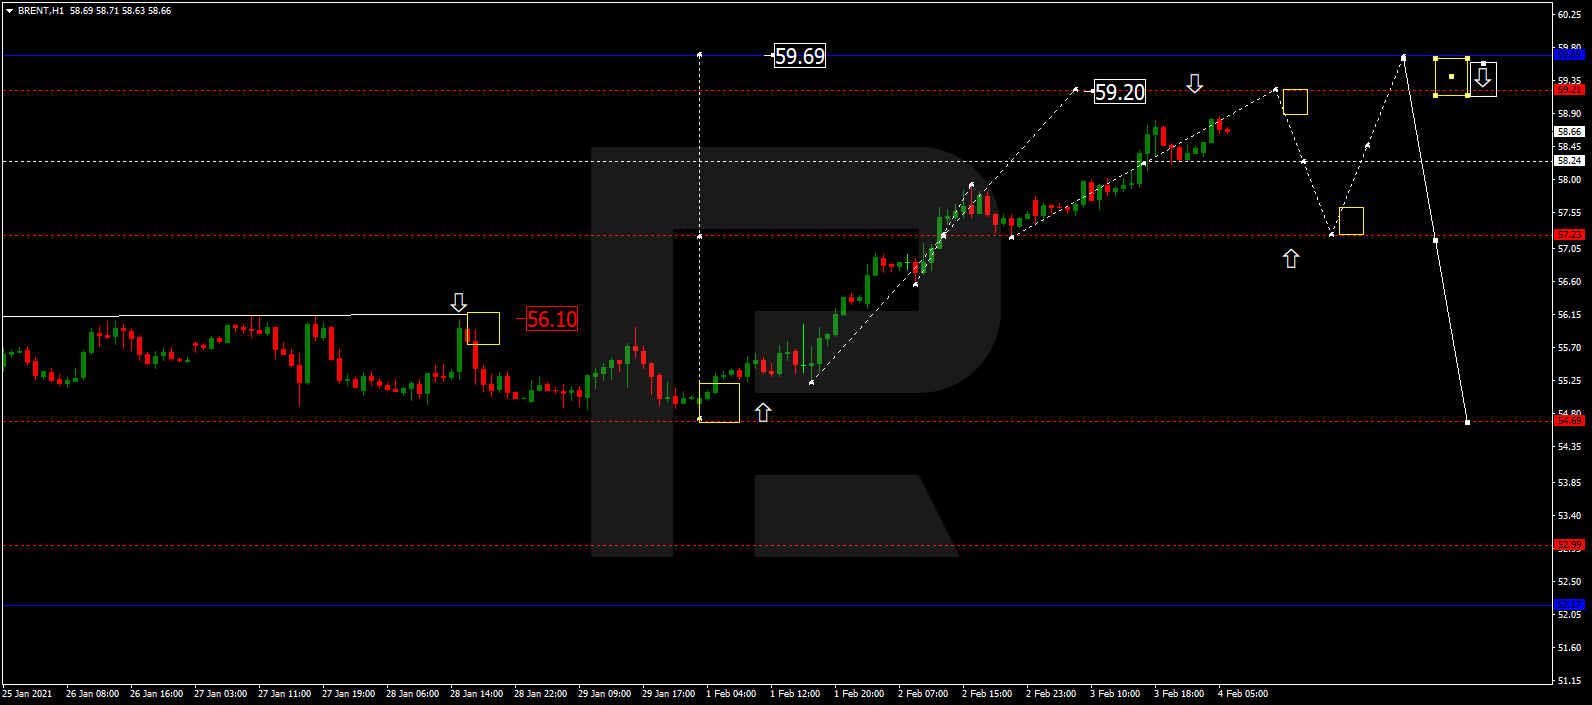
BRENT
Brent is still growing. Possibly, today the asset may reach 59.20 and then consolidate there. After that, the instrument may break the range to the downside and correct towards 57.30. Later, the market may form one more ascending structure with the target at 59.69.
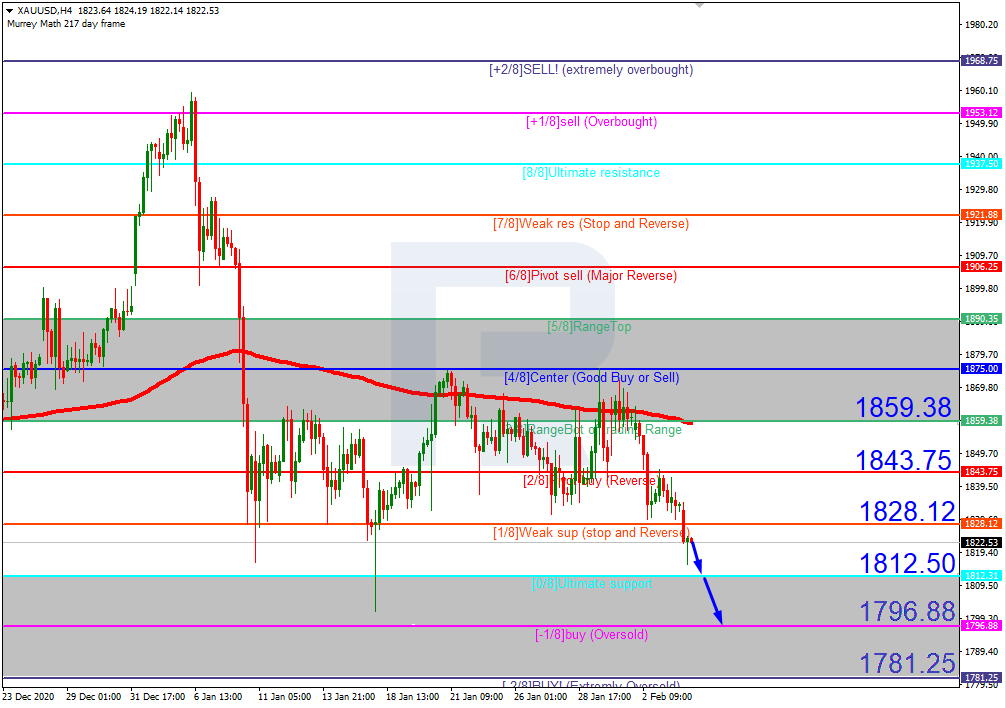
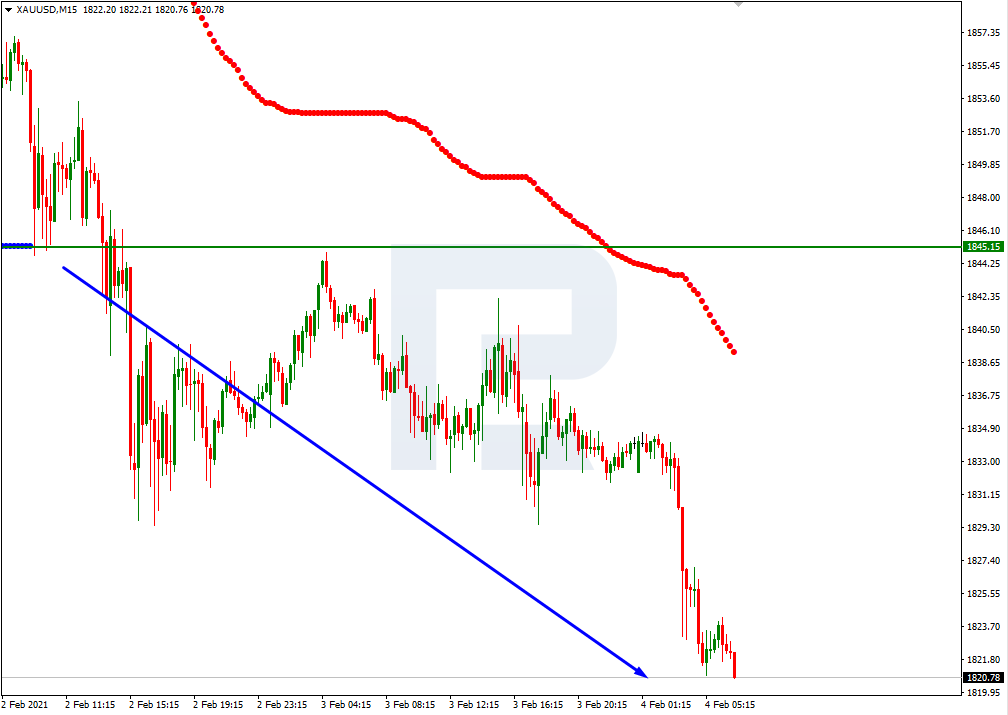
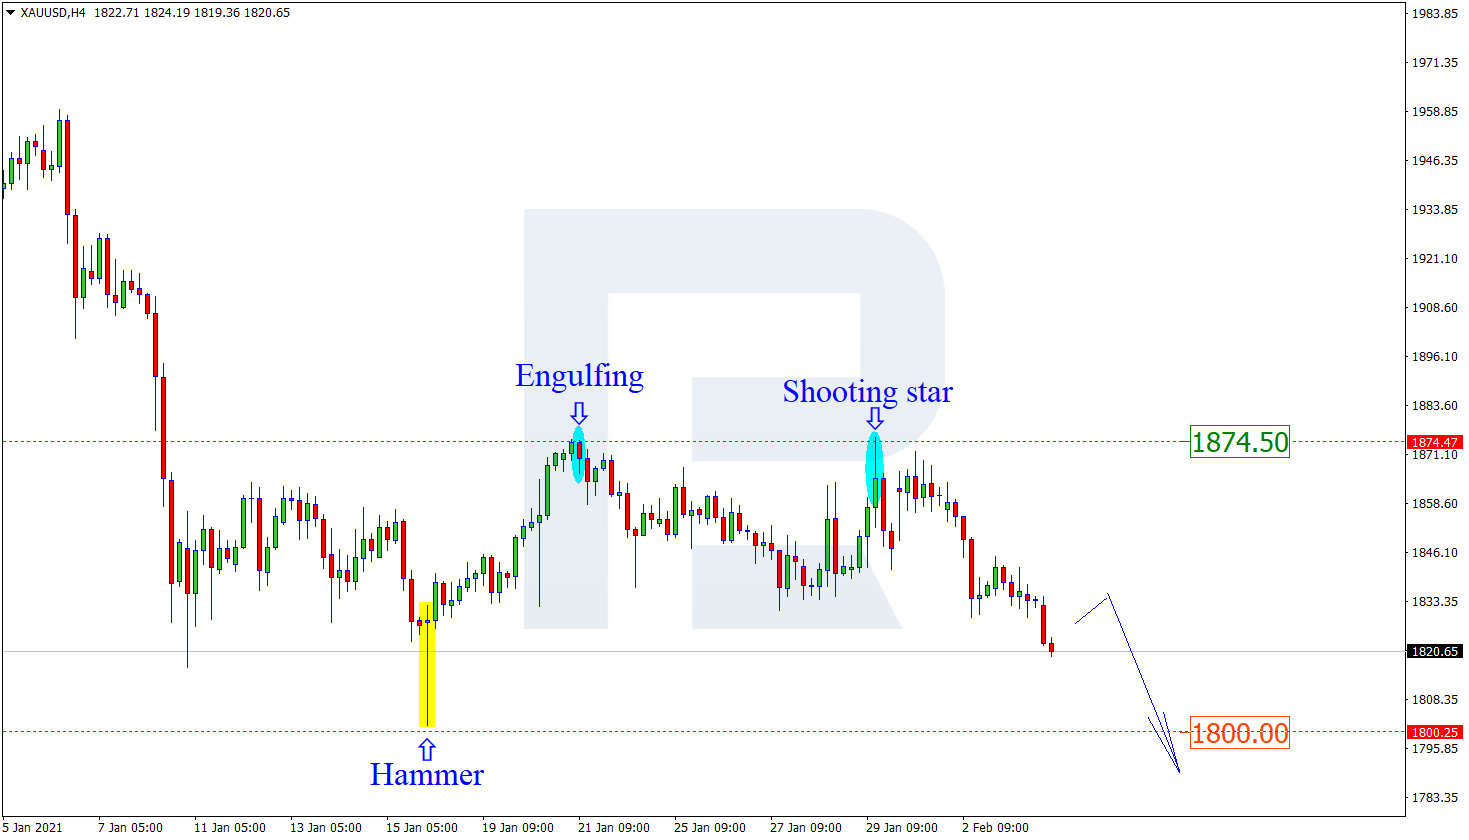
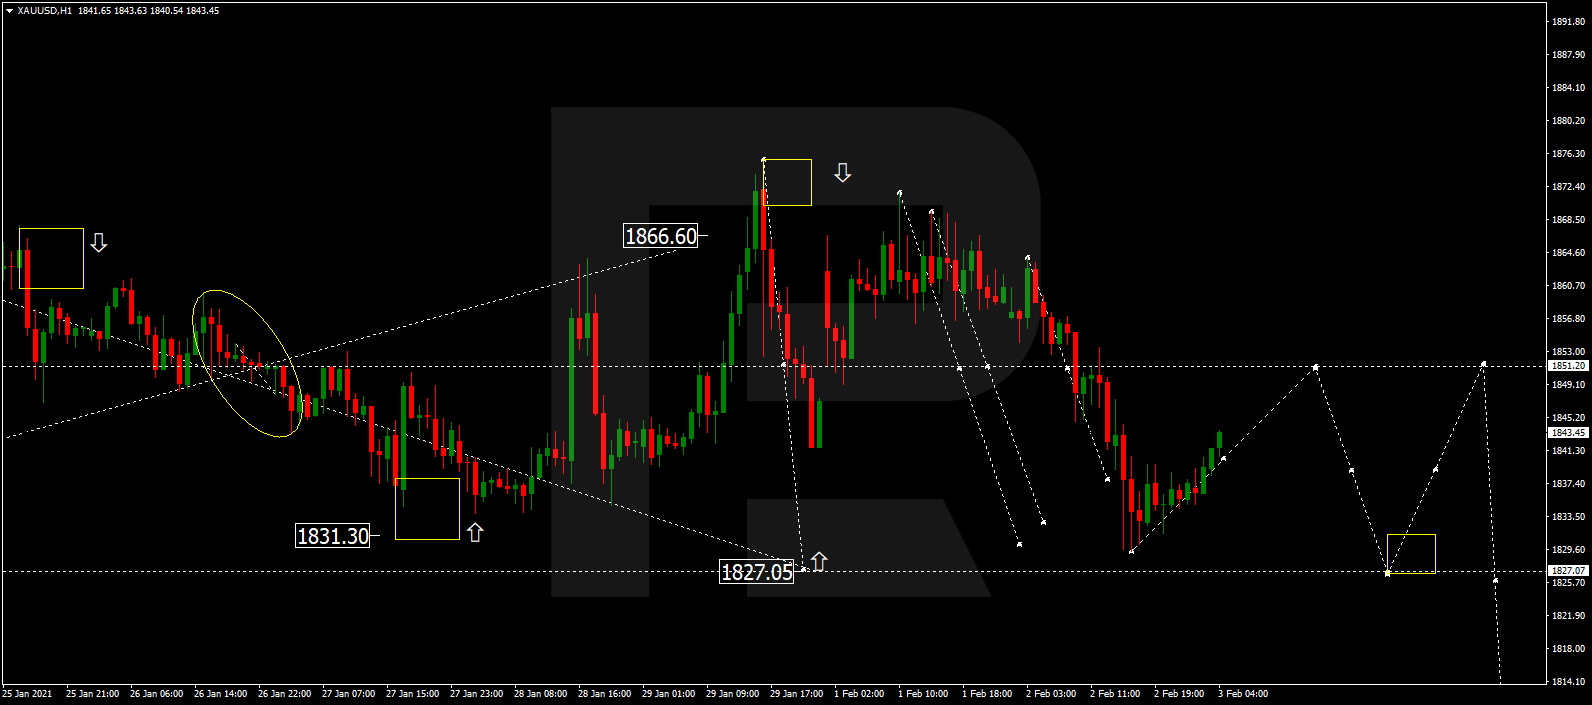
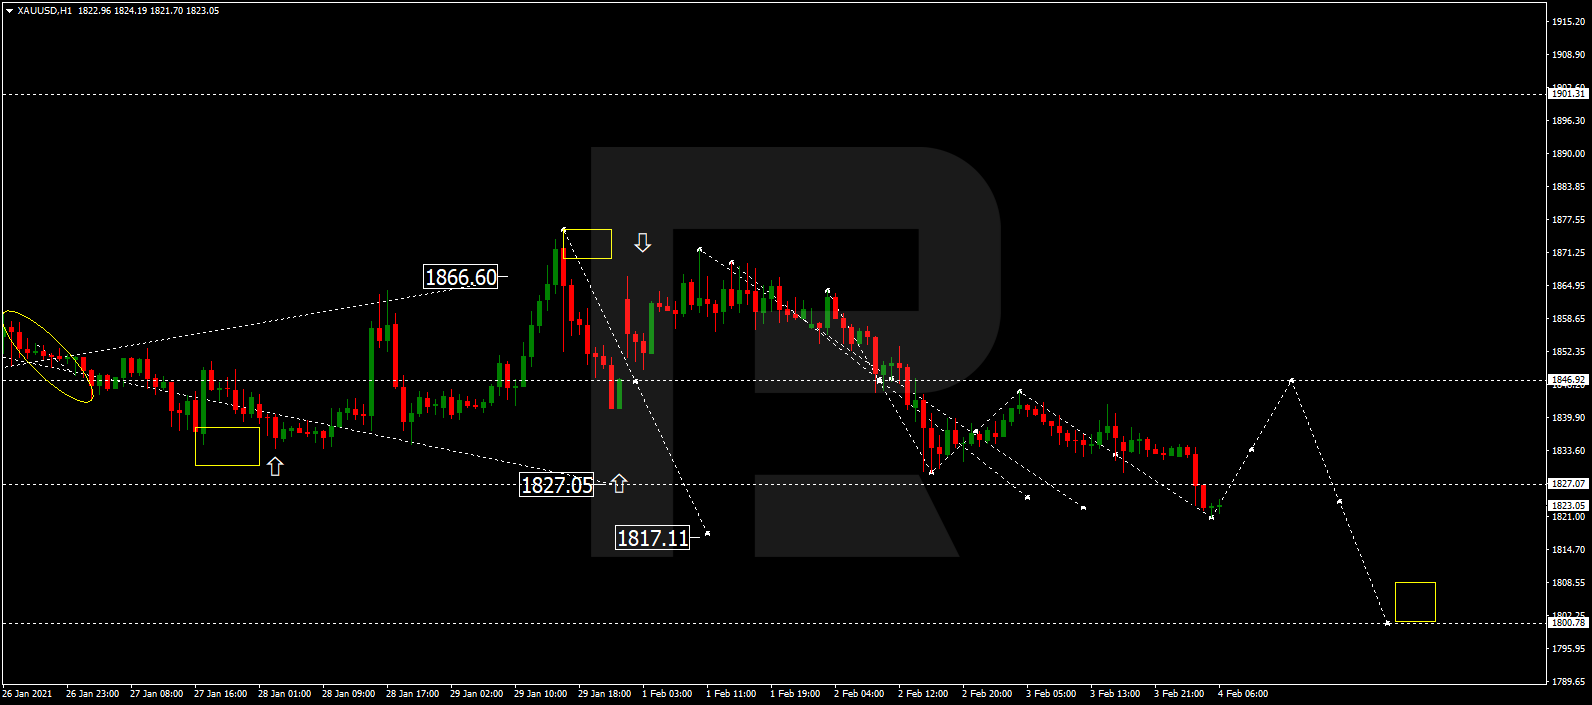
GOLD
Gold is still forming the descending structure with the target at 1817.11. After that, the instrument may resume trading upwards to reach 1847.00..
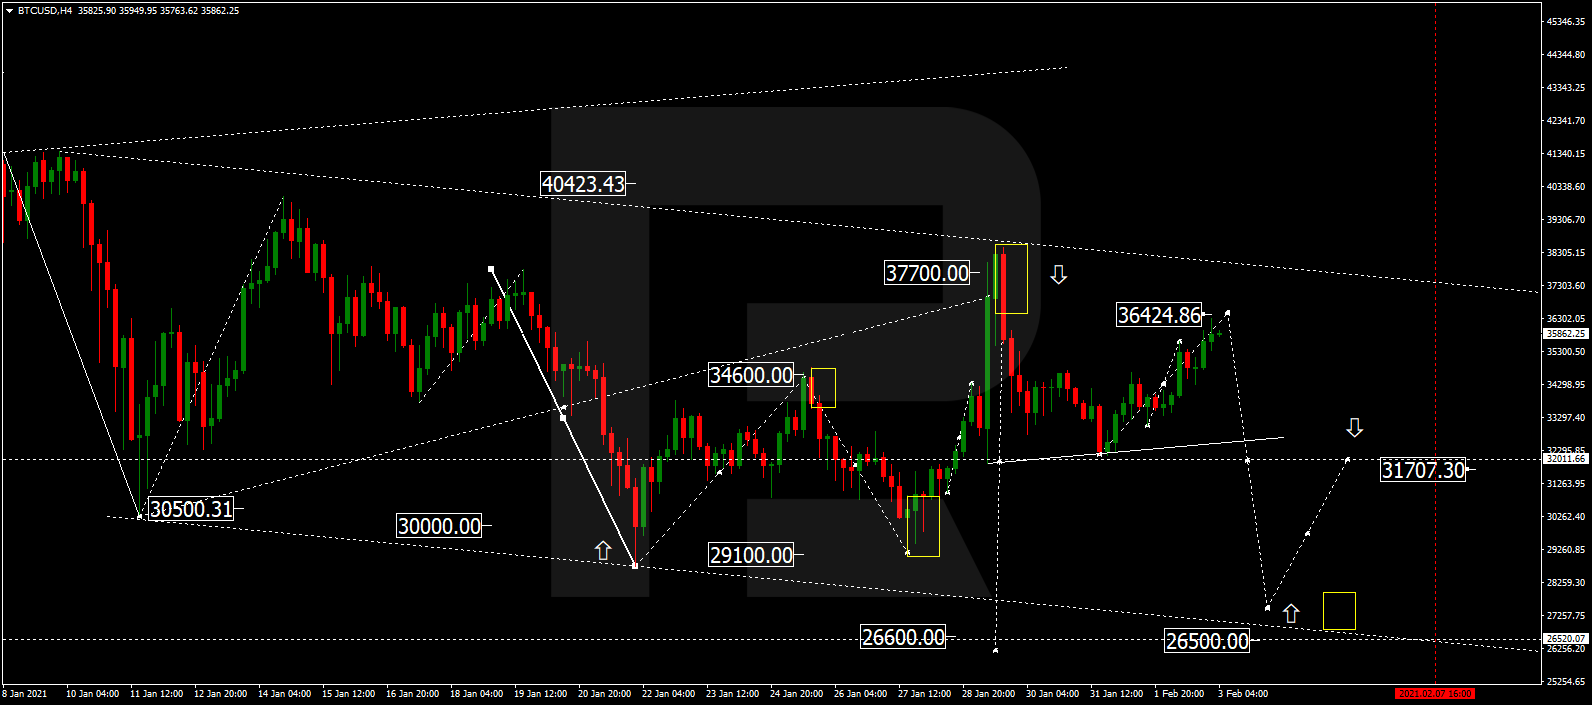
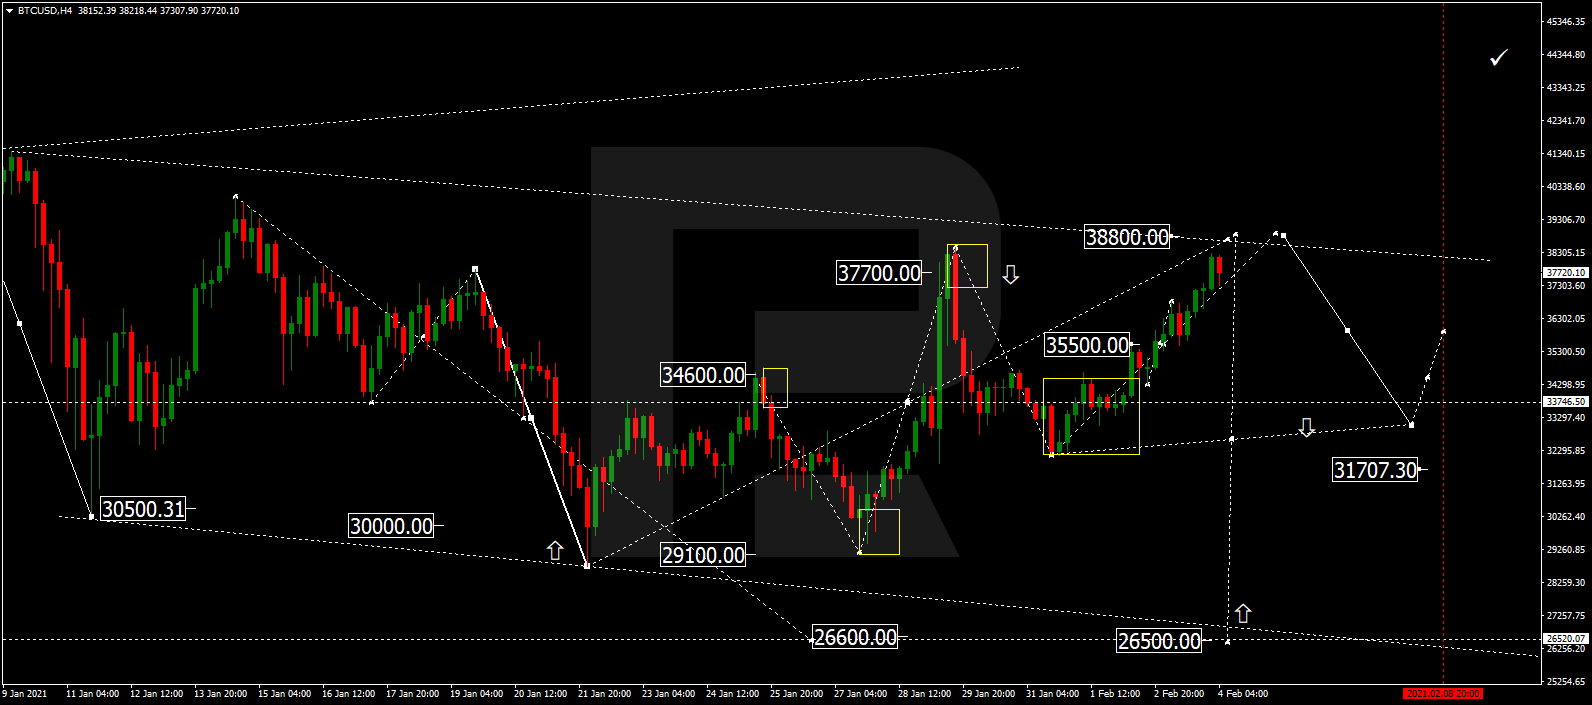
BTCUSD, “Bitcoin vs US Dollar”
BTCUSD is growing to reach 38800.00. Later, the market may resume trading downwards with the target at 31700.00.
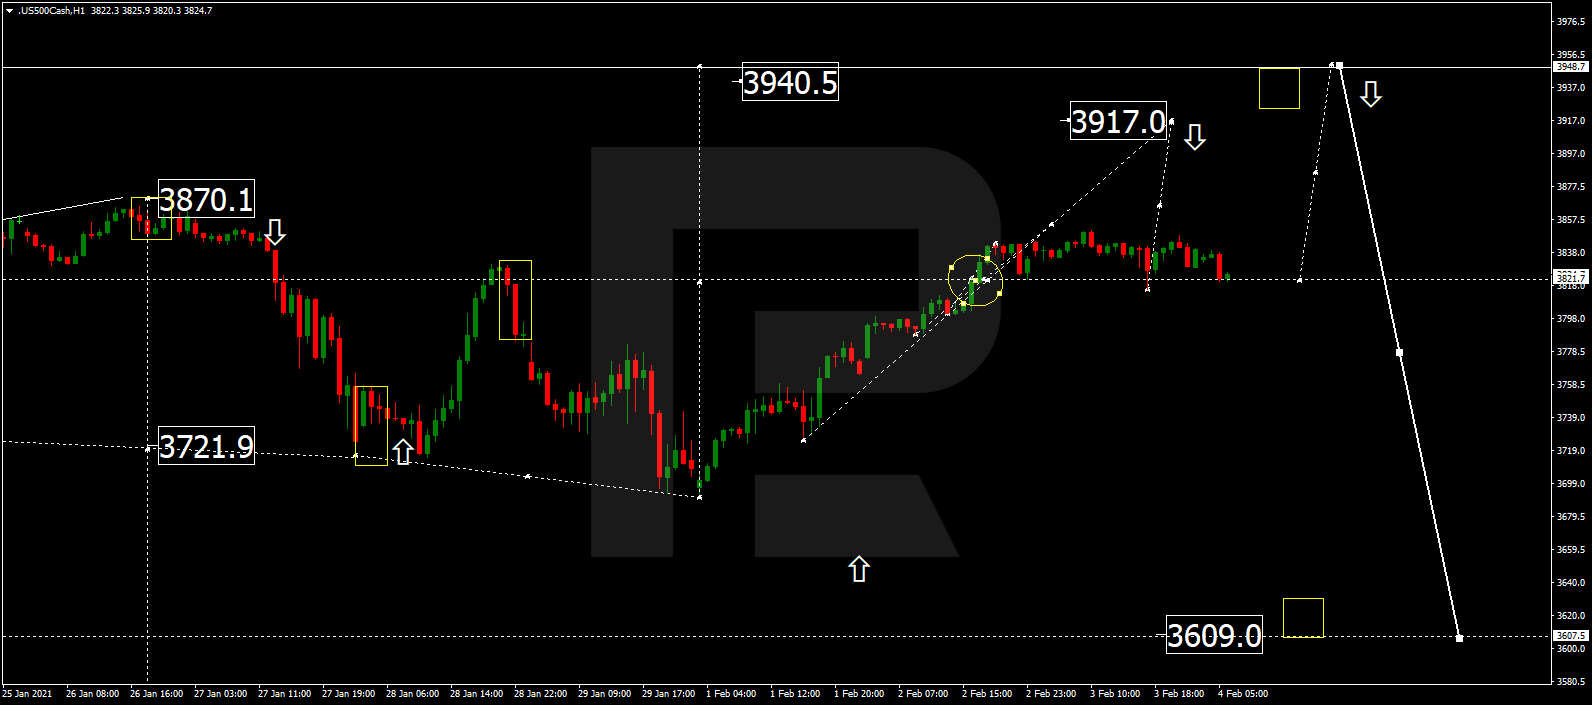
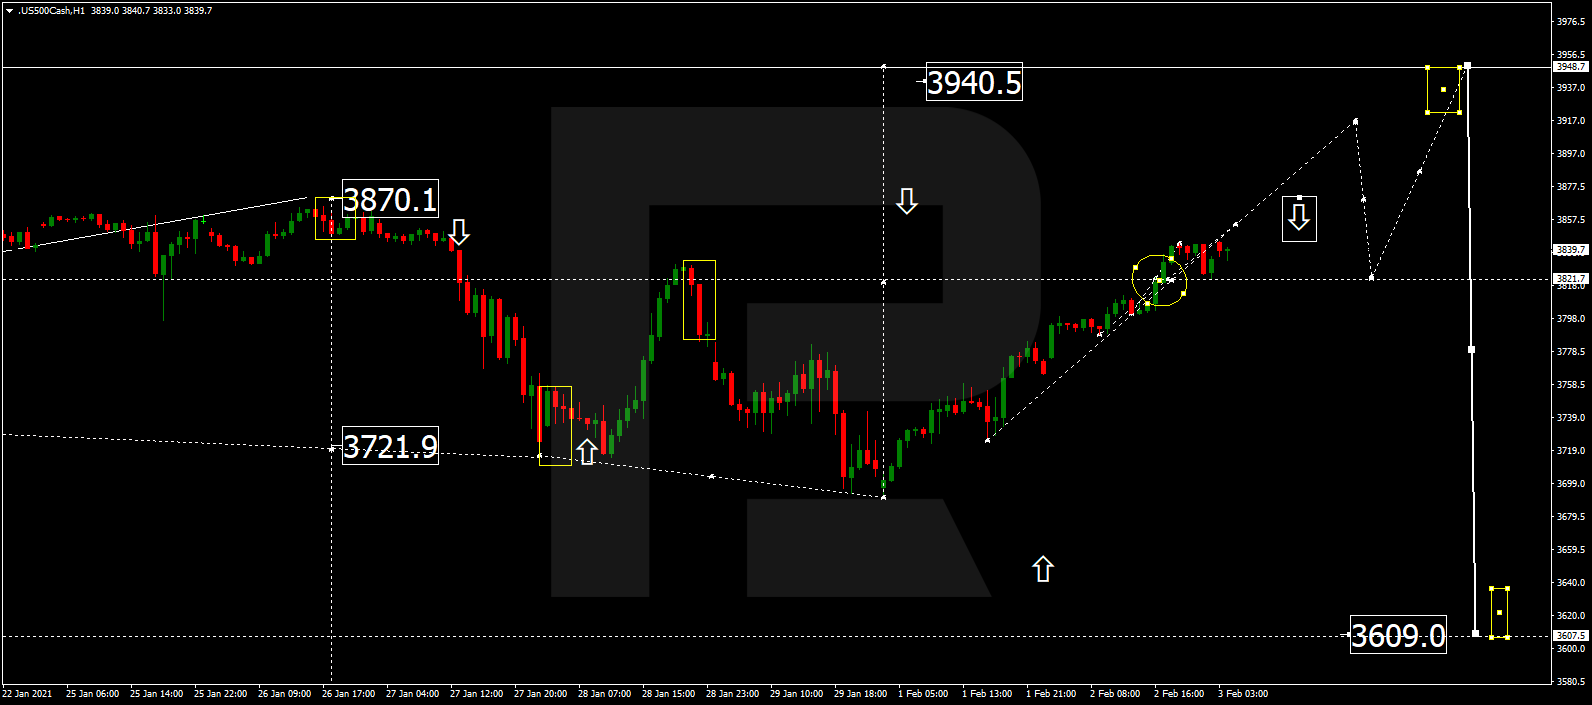
S&P 500
The S&P index is consolidating around 3821.7. If later the price breaks this range to the upside, the market may resume growing to reach 3917.0 and then start a new correction to return to 3821.7; if to the downside – correct towards 3800.0 and then resume growing with the target at 3900.0.