rfxsignals October 9, 2025 No Comments

How to Avoid Overtrading in Forex

How to Avoid Overtrading in Forex
How to Avoid Overtrading in Forex | YOUR_DOMAIN

How to Avoid Overtrading in Forex

By 8–10 min read
Trade smarter, not more. Overtrading corrodes capital and confidence. This guide gives practical steps to stop overtrading and build a disciplined, repeatable approach.

Overtrading is one of the fastest ways to lose money in forex — it combines higher transaction costs, creeping emotional decisions, and poor risk management. Whether you’re a new trader tempted by every signal or experienced but going through a losing streak, these strategies will help you regain control and trade only when the odds are in your favor.

What is overtrading?

Overtrading means taking too many trades, trading with position sizes larger than your plan, or entering poor-quality setups because of boredom, revenge, or FOMO. It often shows up after a loss (trying to recover) or during high market excitement. The result is subpar performance, higher drawdowns, and deteriorated psychological resilience.

1. Define clear entry and exit rules

Start with a written rule-set. Define what counts as a valid setup — timeframes, indicator confirmations, price action patterns, and news filters. If a trade doesn’t meet the checklist, don’t take it. A checklist is your defense against impulse trading.

2. Limit the daily and weekly trade count

Set strict caps: for example, no more than 3 trades per day and 10 per week. Caps force you to pick your best setups and prevent random entries. If you hit the cap, stop trading and review.

3. Use position sizing and risk-per-trade limits

Risk management combats overtrading by making each trade meaningful. Set a fixed percentage risk per trade (e.g., 0.5–1.5%). When risk is meaningful, you naturally become selective — and you trade fewer but higher-quality setups.

4. Automate filters and alerts

Use trading platform alerts or automated screens to notify you only when setups meet your rules. Rather than staring at charts and impulsively entering, let alerts bring opportunities to you. This reduces impulsivity and screen-time driven overtrading.

5. Create pre-trade and post-trade routines

A pre-trade routine might include checking the economic calendar, confirming risk limits, and ensuring the trade matches your checklist. Post-trade routine: log the trade, note emotions, review the execution. Rituals convert discipline into habit.

6. Recognize emotional triggers

Overtrading rarely happens in a vacuum — it’s fueled by boredom, revenge, or greed. Learn to recognize when you’re trading from emotion: tightened shoulders, racing thoughts, or a desire to ‘make up’ losses. When you notice these signs, pause and follow a cooling-off protocol.

7. Implement a cooling-off rule

When you hit negative thresholds (e.g., three consecutive losses or -3% of equity in a day), stop trading and take a break for the rest of the day. Cooling-off rules prevent emotional escalation and protect both capital and confidence.

8. Keep a high-quality trade journal

Logging trades helps you separate emotions from performance. Include the reason for entry, screenshots, emotions felt, and execution notes. Weekly reviews reveal patterns: are you breaking rules after losses? Are certain hours causing mistakes? The journal is your objective mirror.

9. Reduce screen time and check only defined sessions

Trading in defined sessions (e.g., London open, New York overlap) reduces the temptation to look for trades constantly. Less screen time reduces reactive entries and gives your mind space to evaluate trades thoughtfully.

10. Use wider timeframes for decision-making

Higher timeframes (4H, Daily) filter noise and improve decision quality. If you’re prone to overtrading on 5- or 15-minute charts, confirm trades on a higher timeframe to ensure alignment. This reduces false entries and increases the likelihood of meaningful moves.

11. Avoid trading around high-impact news without plan

News events spike volatility and can trigger impulsive trades. Either avoid trading major news entirely or have a pre-defined plan for news risk: reduced position size, wider stops, or sitting out altogether.

12. Focus on expectancy, not number of wins

Good trading optimizes expectancy (average R per trade * win rate), not the number of winning trades. Fewer high-quality trades with positive expectancy beat many random wins. Define and track your expectancy to stay focused on quality over quantity.

13. Use checklists and trade tickets

Before entering, fill out a short trade ticket: pair, timeframe, entry, stop, target, risk %. If you skip the ticket, likely you’re trading impulsively. Keep trade tickets centralized in your journal for review.

14. Consider algorithmic guardrails

If human impulses are the problem, use simple algorithmic rules to enforce limits. For example, create an EA or script that blocks new orders after the daily loss limit or caps order quantity. Automation can act as a behavioral backstop.

15. Re-evaluate your strategy periodically

Sometimes overtrading is a sign your strategy isn't producing clear setups — not merely lack of discipline. Backtest and forward-test your approach; if edge is weak, refine selection criteria rather than forcing trades.

Quick checklist to stop overtrading

  1. Do I have a valid reason for this trade? (Yes/No)
  2. Is my risk within the pre-set %?
  3. Have I hit my daily/weekly trade cap?
  4. Am I trading to recover losses or from boredom?

Related reading

Conclusion

Overtrading is fixable. With written rules, risk limits, automation, and disciplined routines, you can reduce impulsive entries and focus on trades with real edge. Remember: in forex, winning is not about doing more — it’s about doing the right trades consistently.


Disclaimer: Trading forex carries risk. Use proper risk management and test strategies before committing capital.

rfxsignals October 7, 2025 No Comments

How to Trade News Events in Forex

How to Trade News Events in Forex

How to Trade News Events in Forex — A Practical Step-by-Step Guide

Updated: • Reading time: ~8–10 mins

Trading forex around scheduled news events (FOMC, NFP, CPI, RBI policy, GDP releases) offers high opportunity but also high risk. This guide gives a repeatable plan — preparation, entry rules, position sizing, and exit management — so you trade news events with discipline instead of betting on headlines.

Quick summary — what you’ll learn

  • How to prepare for news: calendar, liquidity windows, and pair selection
  • Two practical news-trade methods: volatility fade & breakout capture
  • Risk rules: position sizing, stop placement, and trade management
  • Checklist for execution and post-news review to improve performance

Why news trading is different from routine setups

News events compress information. Prices can move violently in seconds, creating big winners and losers. Unlike routine technical trades, you face larger slippage, spread widening, and occasional spikes/gaps — so standard indicators must be augmented with a news-specific playbook.

Step 1 — Preparation (the part most traders skip)

Preparation beats luck. Use a reliable economic calendar (e.g., your broker calendar or institutional calendars) and mark high-impact events: FOMC decisions, US Nonfarm Payrolls (NFP), CPI, GDP, RBI rate decisions and any surprise local headlines. Know the scheduled time in your time zone and watch for pre-event commentary.

  • Choose pairs: trade pairs that react predictably to the release (e.g., USD pairs on US data). For INR-sensitive moves, watch USD/INR and EUR/INR.
  • Session overlap: news often moves most when the respective session is active. NFP during New York session; RBI during India session.
  • Check liquidity: thin liquidity increases spreads — avoid exotics unless you can absorb costs.

Step 2 — Two reliable news-trade strategies

1) The Volatility Fade (mean-reversion)

Many news moves overshoot. The volatility fade attempts to enter after the initial spike once the immediate panic subsides and liquidity returns. Key rules:

  • Wait 30–120 seconds after the print to allow the first spike and quote noise to settle.
  • Use a limit order near the opposite side of the spike (e.g., if price jumps up, place a sell limit a few pips below the spike top).
  • Set a tight stop (e.g., a multiple of the printed volatility) and a modest target (1:1 to 1:2 initial R). Expect whipsaws — place small size.

2) Breakout Capture (ride the momentum)

Sometimes the market confirms a directional breakout after news. The breakout capture trades momentum rather than fading it.

  • Define the pre-news range (1–15 minutes). Place entry orders beyond that range (stop-entry) after the release.
  • Use wider stops to allow for initial volatility and trail stops as the move confirms.
  • Prefer breakout capture on truly directional surprises (e.g., much hotter CPI or a surprise rate cut/hike).

Step 3 — Risk management (non-negotiable)

News trades are riskier — treat them accordingly. Limit risk per trade to a small percentage of equity (0.25–1% typical for news), reduce position size, and predefine maximum daily exposure.

  • Use fixed risk per trade, not fixed lot size.
  • Account for spread widening — your stop must include the widened spread amount.
  • Consider using limit entries after the first move to control slippage for fade trades.

Order types & tech tips

Market orders during releases can suffer severe slippage. Use stop-entry orders for breakout strategies and limit orders for fades. Make sure your broker accepts quick cancels and supports conditional orders — otherwise use a platform with guaranteed SL if available.

Practical checklist — 10 minutes before, 1 minute before, and at release

10 minutes prior

  • Confirm event time and expected impact on your chosen pair.
  • Reduce leverage and set max exposure for the session.
  • Place or prepare orders and note stop/target levels.

1 minute prior

  • Freeze new trade entries not related to the event.
  • Ensure charts and DOM (depth) are ready; close unrelated positions if needed.

At release

  • Do not chase initial spikes. Let quotes settle if fading.
  • If breakout activates your stop-entry, manage risk and trail stops as the trend confirms.

Common psychological traps

Fear-of-missing-out (FOMO) and revenge trading after a stop are the biggest killers. Plan every trade, accept the small losing streaks, and review trades objectively. Post-news journaling will accelerate improvement.

Post-news review — how to learn fast

Keep a trade journal for each news event: timestamp, entry/exit, spread experienced, slippage, and rationale. Over time you’ll learn which events and pairs suit your style and which setups produce consistent edges.

SEO-friendly internal & external links to include

To boost SEO and topical authority, link this article to relevant internal pages and 2–3 high-authority external sources:

Final checklist — ready-to-print before the next release

  1. Pick the event and pair → verify session overlap
  2. Decide: fade or breakout → set order type
  3. Calculate risk & adjust size → include spread/slippage
  4. Execute with discipline → journal outcome
#forex#newstrading#USDINR#trading
rfxsignals October 3, 2025 No Comments

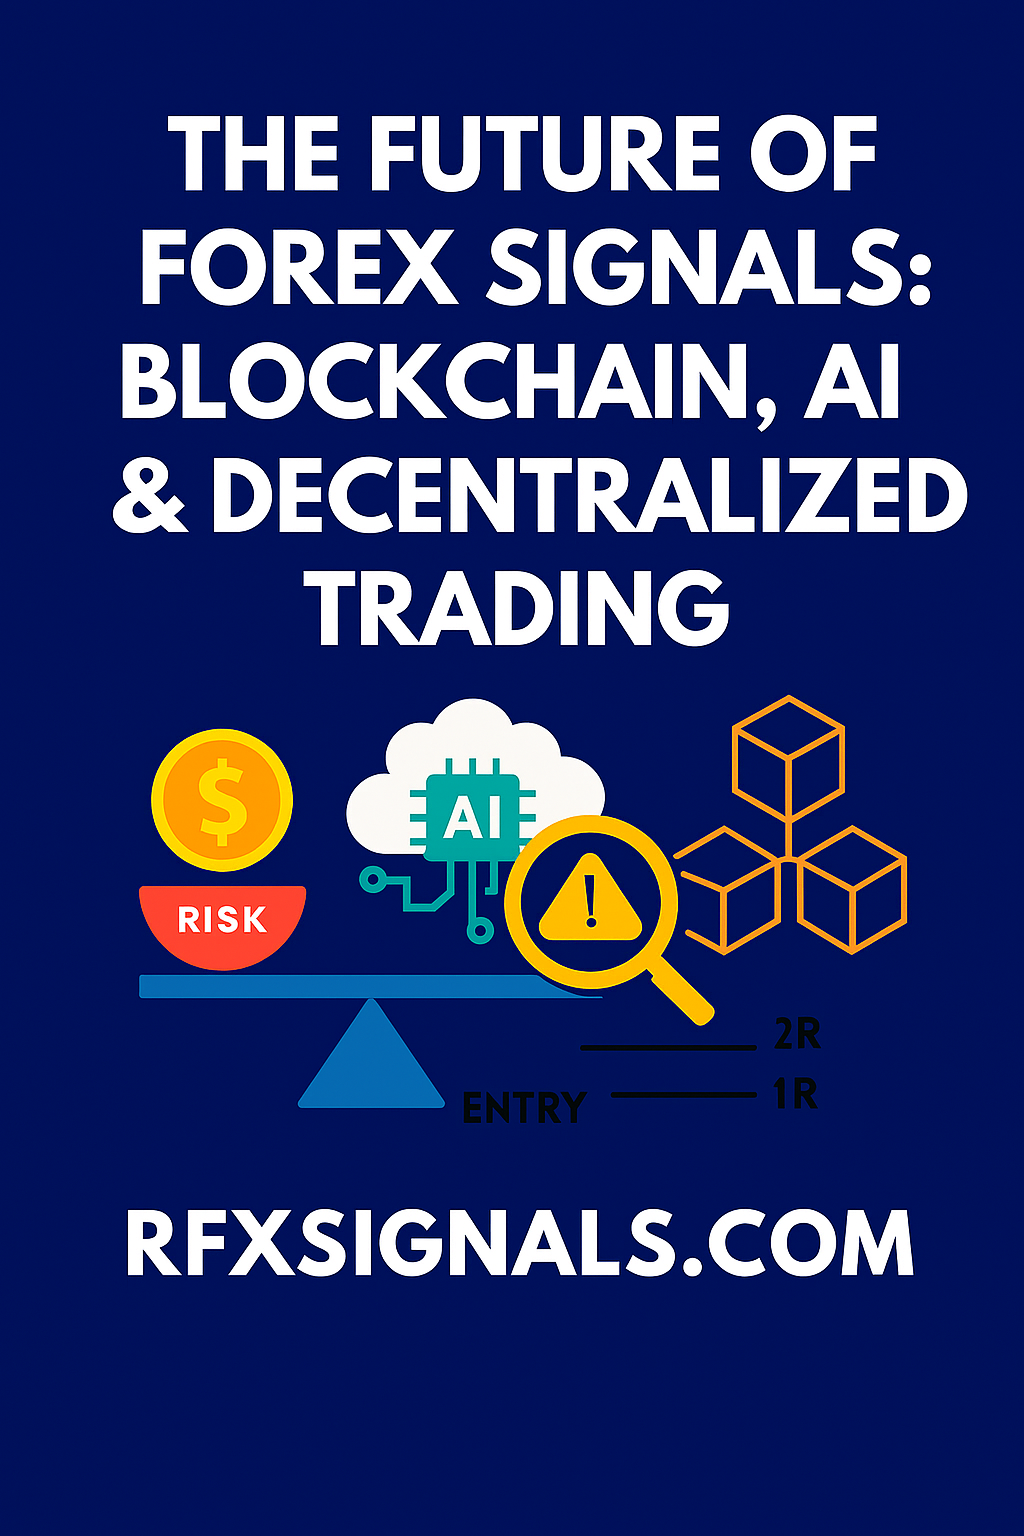
The Future of Forex Signals: Blockchain, AI & Decentralized Trading

The Future of Forex Signals: Blockchain, AI & Decentralized Trading

The Future of Forex Signals: Blockchain, AI & Decentralized Trading

The Forex trading world is evolving at a rapid pace. With the integration of Blockchain, Artificial Intelligence (AI), and Decentralized Trading platforms, the future of Forex signals looks more transparent, efficient, and profitable. In this guide, we will explore how these technologies are reshaping Forex trading and what traders can expect in the coming years.

1. Introduction to Forex Signals and Their Evolution

Forex signals have traditionally been generated by expert traders or trading software to guide others on when to buy or sell a currency pair. However, as markets become more complex and volatile, the demand for reliable, real-time, and transparent signals has grown significantly. This is where Blockchain, AI, and decentralized ecosystems come in to transform the industry.

2. The Role of Blockchain in Forex Signals

Blockchain technology ensures transparency and trust in Forex signals. By storing trade recommendations and results on an immutable ledger, traders can verify performance without manipulation.

  • Transparency: Every signal is recorded permanently.
  • Trustless environment: No middleman needed.
  • Fraud prevention: Impossible to alter past results.

3. Artificial Intelligence and Machine Learning in Forex

AI-powered algorithms analyze vast amounts of market data, detect hidden patterns, and predict potential outcomes. AI enhances the accuracy of signals by factoring in:

  • Market sentiment analysis
  • Historical price patterns
  • Volatility modeling
  • Risk-to-reward optimization

Machine learning allows systems to continuously learn and improve signal accuracy over time, making them far superior to traditional methods.

4. Decentralized Trading Platforms (DeFi in Forex)

Decentralized platforms eliminate intermediaries and give traders direct control of their funds and trades. These systems also allow peer-to-peer sharing of signals, ensuring:

  • Lower trading costs
  • Global accessibility
  • Greater security of funds
  • Democratization of trading signals

5. Benefits of Future Forex Signal Systems

The combination of Blockchain, AI, and decentralized platforms creates powerful advantages:

  • Transparency: No fake results.
  • Accuracy: AI-driven predictions.
  • Security: Decentralized data and funds.
  • Accessibility: Open to traders worldwide.

6. Challenges in Adopting These Technologies

Despite the potential, there are obstacles:

  • High cost of AI infrastructure
  • Regulatory uncertainties in decentralized systems
  • Technical knowledge required for adoption

7. The Road Ahead for Forex Traders

The future will likely see hybrid models where AI-driven signals are stored on blockchain ledgers and executed through decentralized platforms. This will give traders confidence, efficiency, and security.

🚀 Ready to Trade Smarter?

Join our community to access AI-powered, blockchain-backed Forex signals and trade with confidence.

Connect on WhatsApp Join on Telegram

© 2025 YourForexSite.com | All Rights Reserved.

rfxsignals October 3, 2025 No Comments

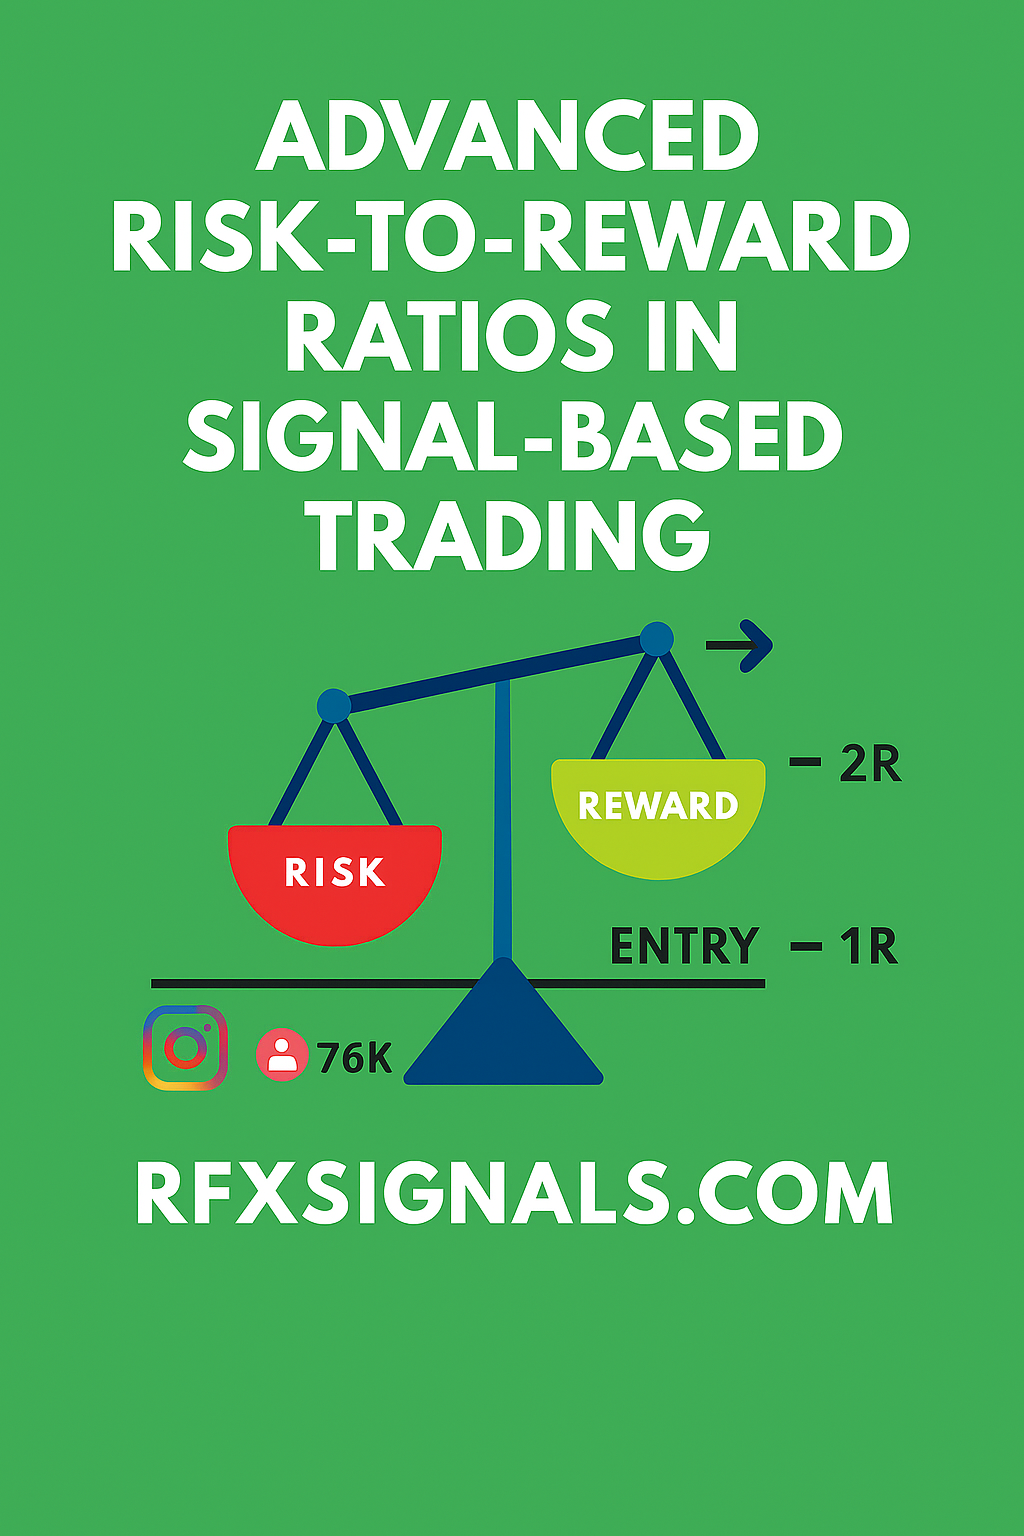
Advanced Risk-to-Reward Ratios in Signal-Based Trading

Advanced Risk-to-Reward Ratios in Signal-Based Trading
Advanced Risk-to-Reward Ratios in Signal-Based Trading | {{SITE_NAME}}

Advanced Risk-to-Reward Ratios in Signal-Based Trading

By Estimated read: 9 minutes

Summary: Signal-based trading requires more than following alerts — it needs a disciplined approach to risk-to-reward (R:R). This guide shows advanced methods to determine R:R in multi-signal setups, how to size positions for edge preservation, and practical rules to improve long-term expectancy.

Signal-based trading transforms subjective market views into repeatable processes. But without robust risk-to-reward rules, winning signals can be eroded by poor sizing and mismanaged stop placement. This article explores advanced R:R concepts tailored for traders who rely on signals — whether algorithmic, manual, or community-driven — and want to convert positive hit-rate signals into long-term profitability.

1. Why R:R matters more with signals

Signals often arrive clustered (several signals in a narrow time window) or as contradicting messages from different indicators. A naive, fixed R:R (like 1:2 always) ignores context: market volatility, signal quality, and overlapping exposure. Advanced traders adapt R:R dynamically to preserve edge while keeping drawdown under control.

2. Signal quality and expected value (EV)

Before assigning R:R, evaluate signal quality. Key metrics:

  • Historical hit rate (over similar conditions)
  • Average win and loss size
  • Signal correlation with price regime (trending vs range)

Use these to estimate EV. If a signal historically shows a 40% win rate with an average win 2× average loss, the expectancy per trade = 0.4×2 − 0.6×1 = 0.2 units; this positive EV lets you accept lower R:R (e.g., 1:1) while maintaining profitability.

3. Dynamic R:R: volatility and regime adjustment

Set stops and targets relative to volatility (ATR or realized volatility). Rules of thumb:

  • Low-volatility regime → tighter stops, smaller targets (preserve capital)
  • High-volatility regime → widen stops but increase target multiples to maintain R:R
  • Use ATR multiples to compute stop distance and derive target = stop_distance × desired_RR

Example: ATR(14) = 20 pips. If your signal is strong in trending markets, set stop = 1×ATR (20 pips) and target = 3×ATR (60 pips) for R:R 1:3.

4. Combining multiple signals: scaling and staggered R:R

When two or more signals (e.g., indicator + price action) align, you can scale position entries and use staggered R:R:

  1. Entry A (initial signal): 50% position, stop at conservative level, target at 1:1.5
  2. Entry B (confirming signal): add 30%, tighter stop trailing to breakeven, target at 1:3
  3. Final add (strong macro confirmation): 20%, wider target 1:4 if trend continuation confirmed

Staggering reduces risk when signal reliability is uncertain and magnifies profits on strong trends.

5. Position sizing rules for multi-signal exposure

Preserve account equity by sizing to total exposure, not per signal. Use these steps:

  1. Decide max account risk per trade (e.g., 1% of equity).
  2. If you expect multiple correlated signals, reduce per-signal risk (e.g., 1% total split into 0.5% and 0.5%).
  3. Calculate lot size = (account_risk_amount) ÷ (stop_distance in quote currency).

This prevents over-leveraging when several signals hit simultaneously.

6. Trade management: moving stops, partial exits, and expectancy preservation

After entry, follow a documented rule set:

  • At +1R, move stop to breakeven for initial portion to eliminate downside for the remainder.
  • Use partial exits at key levels (support/resistance or Fibonacci) instead of arbitrary fixed profits.
  • Trail stop after the trade achieves target multiples to lock in gains and let winners run.

Well-structured management can turn a moderate R:R into superior system expectancy.

7. Handling correlated alerts and portfolio-level R:R

Many signals are correlated (e.g., EURUSD and GBPUSD). Treat correlated trades as a single portfolio exposure. Compute portfolio R:R by aggregating potential P&L and risk across correlated positions and size accordingly to keep total risk within limits.

8. Backtesting R:R strategies on signal streams

Backtest using realistic assumptions: slippage, spread, and partial fills. Test several R:R bands (1:1, 1:2, 1:3) across different market regimes and measure drawdowns and Sharpe/Sortino ratios. Focus on metrics that matter to you — a higher R:R with rare wins may still underperform a lower R:R with higher hit rate.

9. Psychological & operational considerations

Higher R:R often means fewer wins and requires discipline. Use automation for signal execution where possible to remove execution hesitation. Document every trade and review monthly to refine R:R rules.

Quick Checklist: 1) Measure signal EV; 2) Adjust R:R by volatility; 3) Size per total exposure; 4) Use staggered entries for confirmation; 5) Backtest with realistic costs.

10. Practical example (step-by-step)

Signal: Breakout + momentum confirmation on 1H chart.

  1. ATR(14)=18 pips → stop = 1×ATR = 18 pips
  2. Target = 3×ATR = 54 pips → R:R = 1:3
  3. Account risk = 1% → risk per trade = $100 on $10,000 account
  4. Position size = $100 ÷ (18 pips × pip_value) → compute lots accordingly
  5. At +1R, move 50% of position to breakeven, trail remainder with 0.5×ATR

11. SEO & link strategy (for publishers)

When publishing signal-based content, link internally to relevant pages (e.g., /signals, /case-studies, /pricing) and externally to authoritative sources (e.g., educational resources). Use anchor text naturally: “signal performance report,” “ATR volatility guide,” etc. This article includes suggested internal links to improve thematic relevance and outbound links to trusted learning resources.

Conclusion

Advanced R:R in signal-based trading is a multi-dimensional problem: balance signal quality, volatility, and total portfolio exposure. Dynamic R:R, staggered entries, and disciplined sizing transform signals from noisy alerts into a sustainable advantage. Use consistent backtests and keep the rules simple enough to follow in real-time.

Disclaimer: Trading carries risk. Past performance is not indicative of future results. This content is educational and not financial advice.
rfxsignals September 30, 2025 No Comments

How to Trade Forex News Events Using Signal Timing

How to Trade Forex News Events Using Signal Timing

How to Trade Forex News Events Using Signal Timing

Master the art of trading Forex news events using precise signal timing. Learn step-by-step strategies, risk controls, and tools that give traders an edge during volatile releases.

Introduction: Why News Trading Needs Signal Timing

Trading Forex around news events is high-risk, high-reward. Sudden volatility can deliver huge moves — both up and down — in minutes. Signal timing adds discipline by letting traders prepare, anticipate, and act with precision rather than emotion.

Understanding Forex News Events

Forex markets respond to economic data releases, geopolitical events, central bank statements, and political developments. Examples include:

  • Central bank rate decisions
  • Non-Farm Payrolls (NFP)
  • GDP and CPI reports
  • Unemployment figures
  • Geopolitical tensions

The Role of Signal Timing in News Trading

Signal timing combines technical and fundamental inputs to align trades with news events. Instead of trading purely on gut feeling, traders use alerts, pre-set conditions, and verified signals to time entry and exit points.

Step-by-Step News Trading Strategy Using Signal Timing

Step 1 — Identify High-Impact News

Use an economic calendar (Investing.com, ForexFactory.com) to identify events likely to cause volatility. Prioritize high-impact events with historical market movement.

Step 2 — Define Your Trading Window

Define a clear entry window before or after the release. Example: enter 5 minutes after release if price stabilizes, or pre-set entry with limit orders if expecting a breakout.

Step 3 — Use Verified Signal Sources

Subscribe to real-time news signal providers or automated alert services (TradingView, Myfxbook AutoTrade, MQL5 signals) to trigger your trades with precision.

Step 4 — Risk Management Rules

- Limit risk per trade to a small percentage (e.g., 1-2% of capital).
- Use stop-loss orders to protect against adverse moves.
- Consider trailing stops to lock in profit during volatility.

Top Signal Tools for Forex News Trading

  • TradingView Alerts: Highly customizable alerts with webhook integration for automation.
  • MetaTrader/MQL5 Signals: Integrated platform signals that can auto-execute trades.
  • ForexFactory Economic Calendar: High-impact news listings updated in real-time.
  • Myfxbook AutoTrade: Copy proven strategies with historical verification.

Case Study: Trading NFP with Signal Timing

Let’s simulate an NFP news trade:

  1. Review NFP release schedule on ForexFactory.
  2. Set alerts 10 minutes before release via TradingView.
  3. Check provider signals for pre-event sentiment.
  4. Place orders with stop-loss limits based on recent volatility.

Managing Risk During News Events

Volatility spikes during news can cause slippage and widen spreads. Mitigate risk by:

  • Using limit orders instead of market orders
  • Reducing trade size
  • Using broker platforms with fast execution speeds

Inbound & Outbound Links for SEO

See related strategies: Backtest Forex Strategies, Investing.com Economic Calendar, TradingView Alerts.

Conclusion: Signal Timing — The Competitive Edge

Signal timing transforms news trading from guesswork to systematic execution. Combining verified signals, economic calendars, and disciplined risk management creates an edge in Forex markets that is otherwise dominated by volatility and noise.

Start trading news with precision

Download our free News Trading Signal Timing checklist and join our WhatsApp community for live alerts.

RTech RFX Signals
RTech RFX Signals

Helping traders leverage news events with precise signal timing — tested strategies, real-time alerts & risk management advice.

rfxsignals September 30, 2025 No Comments

Signal Fatigue: When to Ignore the Noise and Trust Your System

Signal Fatigue: When to Ignore the Noise and Trust Your System

Signal Fatigue: When to Ignore the Noise and Trust Your System

Signal fatigue — the urge to abandon tested systems after a rough patch — is one of trading’s stealthiest performance killers. Learn how to spot fatigue, quantify it, and create objective rules that protect capital and preserve edge.

Introduction — what is signal fatigue?

Signal fatigue is the trader’s tendency to lose confidence in a working strategy during temporary drawdowns, overreact to noise, chase new ideas, or tweak rules impulsively. It looks harmless at first — “I’ll just adjust the stop here” — but repeated adjustments during noise erode edge, increase turnover, and often transform a profitable system into a losing one.

Why signal fatigue happens

Several psychological and structural factors cause fatigue:

  • Loss aversion: humans feel losses more intensely than gains, prompting desperate changes after drawdowns.
  • Recency bias: recent losses loom larger than long-term results.
  • Survivorship bias & FOMO: seeing others report quick wins can make you abandon slow, steady systems.
  • Poor risk management: when sizing is too aggressive, normal volatility looks like failure.
  • Noise-heavy environments: high-volatility regimes produce many false signals that test discipline.

Recognize the red flags

The first step is objective detection. Watch for:

  • Frequent rule changes after drawdowns.
  • Increasing trade frequency without documented strategy changes.
  • Emotional entries: impulsive trades after watching a losing streak.
  • Ignoring pre-defined stop-loss or sizing rules “just this once”.
  • Switching brokers or signal providers after a short underperformance period.

Quantify fatigue — metrics to monitor

Make signal fatigue measurable. Track these metrics in your trading dashboard:

  • Change frequency: count rule edits or parameter changes over rolling windows (e.g., edits per 30 days).
  • Turnover rate: ratio of trades per week relative to historical norm.
  • Deviation from plan: proportion of trades that deviate from the documented entry/exit rules.
  • Psychological volatility: a self-report score (1–10) you log daily for discipline and emotion.
  • Performance vs. baseline: rolling net P&L compared to expected P&L distribution from backtests (z-score of returns).

When to ignore the noise — set objective guardrails

The cure to emotional tinkering is pre-commitment. Define rules that automatically limit changes and force objective review:

1. Pre-commit rule change windows

Allow strategy parameter changes only during scheduled review windows (e.g., monthly). Immediate edits are disabled unless a documented severe-event threshold is met.

2. Minimum sample rules

Require a minimum number of trades or a minimum trading duration (e.g., 90 trades or 6 months) before parameter optimization is allowed.

3. Maximum allowed edit rate

Limit the number of allowed edits to strategy code or parameters (e.g., max 2 per quarter) unless performance breaches a kill-switch.

4. Kill-switch rules

Define objective kill-switches that pause trading and force a forensic review: e.g., drawdown > X% within Y days or consecutive losses > N trades at position size > threshold.

Trust your system — statistical tests & confidence bands

Convert your system’s historical performance into confidence ranges. Use these techniques:

  • Bootstrap stress tests: simulate thousands of re-samples of historical trades to estimate the distribution of drawdowns and returns.
  • Monte Carlo: randomly reorder or resample trades while preserving serial correlation to see expected worst-case drawdowns.
  • Control charts: plot cumulative P&L with upper/lower control bands (e.g., 95% CI). If live P&L remains within bands, treat volatility as expected noise.

Practical routines to reduce fatigue

Implement operational and personal routines that reduce emotional reactions:

  • Daily non-trading checklist: a short list you tick each morning (e.g., market regime check, news flags, position sizing confirmation).
  • Trade journaling: record rationale for every manual intervention — this creates friction that discourages impulsive changes.
  • Scheduled review meetings: weekly or monthly performance reviews with documented action items rather than on-the-fly decisions.
  • Small experiment funds: set aside a tiny percentage of capital (1–5%) for experimental tweaks so the core account remains untouched.

Human-in-the-loop vs. fully automated systems

Both models have pros and cons. Fully automated systems remove emotion but require robust safeguards. Human-in-the-loop allows judgement but is susceptible to fatigue. Hybrid approach recommendation:

  1. Automate execution and risk controls (stop, max exposure, kill-switches).
  2. Keep signal generation and parameter changes behind scheduled human review and documented testing.
  3. Allow manual override only with two-person consent (if running as team) or with mandatory journal entry for solo traders.

Case study — a small real-world example

A mid-sized retail strategy with a historical Sharpe of 1.6 experienced a 12% drawdown over 40 trading days in a high-volatility regime. Traders panicked and tightened stops, increasing turnover 3x and halving net returns over the next 3 months. After pausing and running Monte Carlo stress tests, they found the drawdown was a 1-in-12 event within expected distribution. They reinstated original sizing, re-tested with longer horizons, and recovered performance — illustrating how premature tinkering amplified losses.

Checklist: What to do when doubt creeps in

  1. Stop trading new edits immediately; switch to observation-only mode.
  2. Check objective metrics: drawdown vs expected, control-chart position, edit-rate.
  3. Run quick diagnostics (data integrity, slippage, broker issues).
  4. If diagnostics clear, run bootstrap/Monte Carlo to place current drawdown in context.
  5. Only change rules within the next scheduled review window with documented rationale and out-of-sample testing on a small capital slice.

Conclusion — discipline as an edge

Signal fatigue is not a bug — it’s a predictable human behavior. The antidote is structure: quantifiable metrics, pre-commitment rules, kill-switches, and disciplined review processes. Systems don’t fail because of markets alone — they fail because humans abandon them at the worst possible time. Treat discipline as part of your edge and design your workflow to protect it.

Free checklist: "Stop the Tinkering" — discipline rules for traders

Download our one-page checklist with kill-switch templates, review cadence, and journaling template to protect your edge.

Further reading

For psychological frameworks and risk management techniques, see resources such as Investopedia and academic articles on behavioral finance. Combine reading with the practical checklist above to convert theory into disciplined routines.

RTech RFX Signals
RTech RFX Signals

We publish practical Forex strategies, discipline templates and transparent backtests to help traders protect capital and scale knowledgeably.

rfxsignals September 30, 2025 No Comments

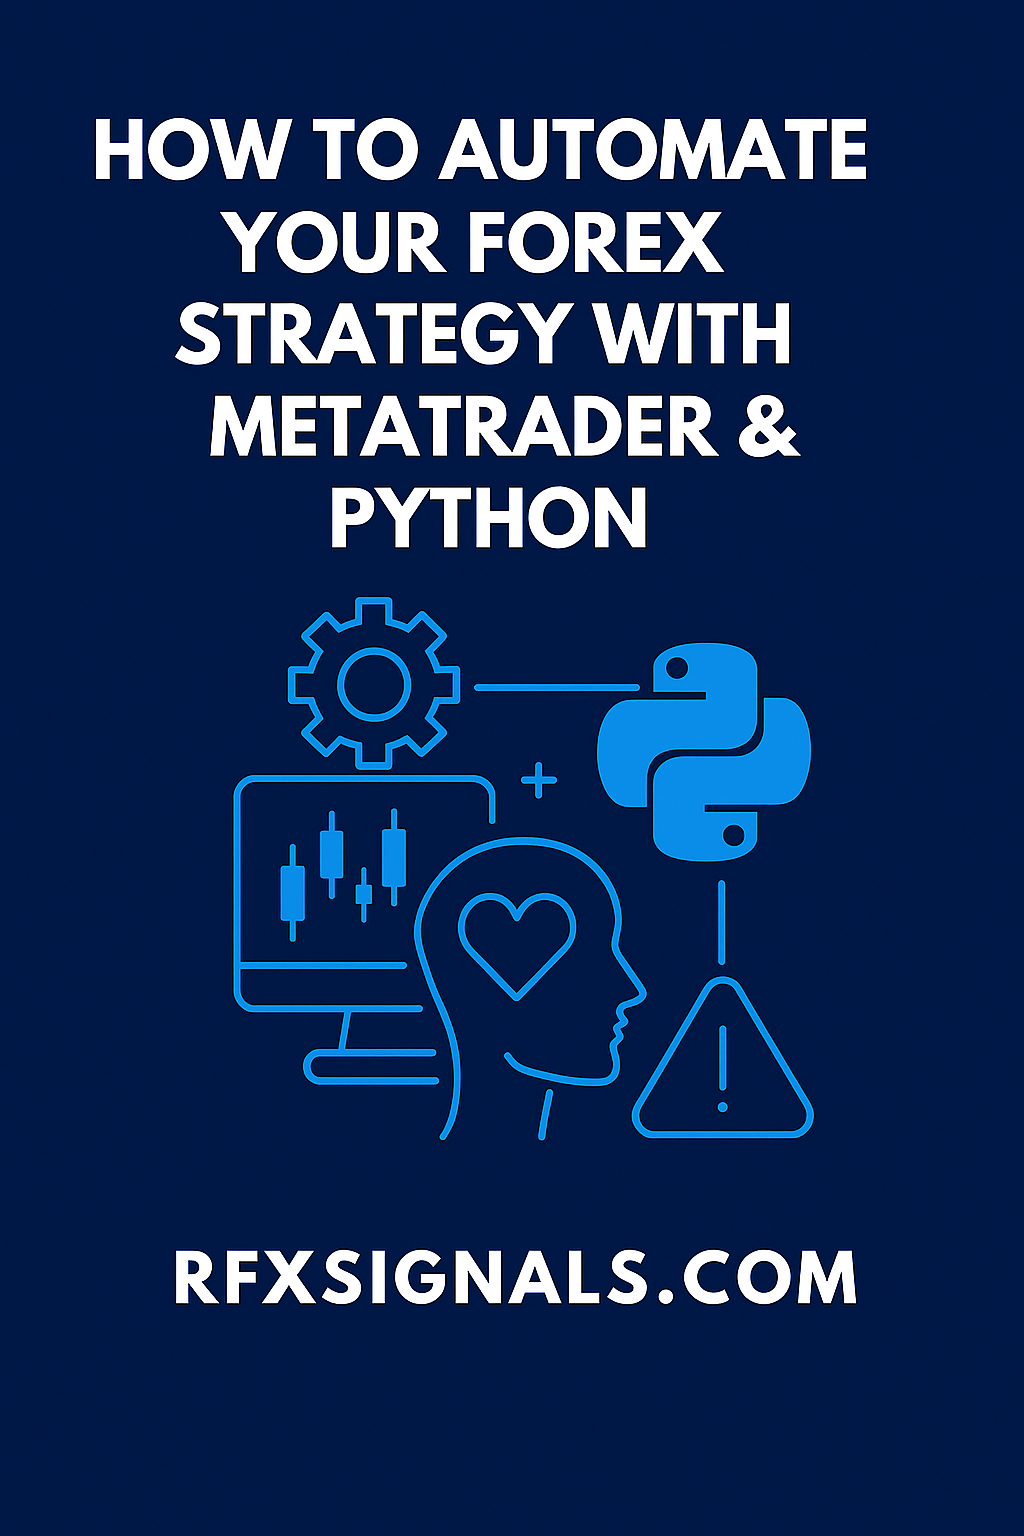
How to Automate Your Forex Strategy with MetaTrader & Python

How to Automate Your Forex Strategy with MetaTrader & Python

How to Automate Your Forex Strategy with MetaTrader & Python

Learn a practical, step-by-step approach to automating Forex strategies using MetaTrader (MT4/MT5) for execution and Python for research, backtesting and orchestration. Includes data handling, risk controls and deployment tips.

Introduction — why automate?

Automation eliminates manual errors, enforces discipline and enables systematic execution at scale. With MetaTrader (MT4/MT5) handling execution and Python powering research, signal generation and orchestration, traders can move from ideas to reliable, repeatable strategies. This guide covers the full workflow: data, development, backtesting, execution, monitoring and governance.

Overview: Roles of MetaTrader and Python

MetaTrader is battle-tested for retail FX execution: order types, broker connectivity, and built-in charting. Python excels at data science: feature engineering, machine learning, and robust backtesting libraries. The typical split:

  • Python: data ingestion, feature engineering, signal generation, optimization, and backtesting (pandas, numpy, scikit-learn).
  • MetaTrader: live order execution, order management, stop/take logic and broker connectivity via MQL or bridge software (e.g., MetaTrader-Python packages).

Step 1 — design your strategy & define rules

Document the strategy precisely: entry conditions, exits, stops, money management, maximum exposure and behavior during news/events. Write pseudo-code or a flowchart — automation is easier and safer when rules are unambiguous.

Example rule set

Example: "Long EURUSD when 50-period SMA > 200-period SMA and RSI(14) < 30. Exit at TP=30 pips or SL=20 pips, max 2% account risk per trade."

Step 2 — gather and clean data

Use high-quality historical data for backtesting. MetaTrader provides broker-specific history, but for robust research use consolidated tick or minute data from reliable vendors. Key steps:

  • Download tick/minute OHLCV; align timezones (MT uses broker time).
  • Clean missing bars, remove duplicates and correct daylight-saving shifts.
  • Store in compressed, queryable formats (Parquet/Feather) for Python processing.

Step 3 — research & backtest in Python

Python lets you rapidly prototype. A recommended stack:

  • pandas / numpy for data manipulation
  • bt / zipline / vectorbt or custom engines for backtesting
  • scikit-learn / xgboost / lightgbm for models

Backtesting best practices: use time-aware cross-validation (walk-forward), realistic slippage & spread models, include commissions, and simulate order execution granularity. Never shuffle time-series during CV — that leaks the future.

Step 4 — create a bridge between Python and MetaTrader

There are several options to send signals to MetaTrader:

  • Native MQL: rewrite logic as an Expert Advisor (EA) in MQL4/MQL5 for direct execution inside MT. Good for latency-critical strategies.
  • Python↔MT bridges: Use packages like MetaTrader5 (official Python package) or third-party bridges (zeroMQ endpoints, WebSockets, or REST middlewares) to send signals from Python to MT. This preserves Python’s ecosystem for research while MT handles orders.
  • FIX/API providers: For institutional needs, use broker APIs or FIX gateways to bypass MT entirely.

For most retail traders, the Python-to-MT bridge offers the best mix of flexibility and execution control.

Step 5 — implement order management & risk controls

Hard-code risk rules in the execution layer. Do not rely on the research script alone. Important controls:

  • Max percent risk per trade and per instrument
  • Max daily drawdown kill switch
  • Slippage limits and fill verification
  • News blackout windows

Implement these both in Python (pre-send checks) and in MQL/EA (pre-order checks) for redundancy.

Step 6 — test with paper / demo accounts

Always run the integrated system on a demo account for extended periods (30–90 days) under live market conditions. Measure real slippage, spreads, execution delays, and unexpected behavior. Logging is critical — record every signal, order request, broker response and fill detail for post-trade analysis.

Step 7 — deploy to live with monitoring & governance

When moving live:

  • Start with small capital and scale gradually.
  • Implement real-time monitoring dashboards (profit, drawdown, active orders, latency).
  • Maintain an automated alerting system for anomalies and failed orders (email, WhatsApp, webhook to Ops).
  • Keep a human-in-the-loop kill switch to pause trading instantly.

Practical code snippets & libraries

Quick pointers:

  • MetaTrader5 Python package: official package to connect to MT5 from Python (fetch history, send orders). Good for research & sending market orders. (See MetaTrader docs.)
  • zeroMQ / WebSocket bridges: for low-latency signal delivery between Python services and an EA inside MT.
  • vectorbt: lightweight backtesting & analytics for rapid prototyping.

Example (high-level) — Python sends a JSON order to a local bridge which the EA reads and executes:

// Python: send order
payload = {"symbol":"EURUSD","side":"buy","lots":0.1,"sl":-0.0002,"tp":0.0030}
requests.post("http://localhost:5000/send_order", json=payload)

// EA receives and executes with safety checks
    

Common pitfalls & how to avoid them

  • Ignoring latency: measure end-to-end latency and its effect on fills.
  • Overfitting: don’t over-optimize parameters to historical quirks.
  • Lack of redundancy: ensure logs, monitoring and fallback execution paths exist.
  • No rollback plan: have a procedure for failed orders and data corruption.

Security and operational considerations

Secure your automation: protect API keys, run services on trusted VPS, use TLS for any network communications, and restrict access with firewalls. Version-control your strategy code and document changes — maintain an audit trail for every deployment.

Scaling & next steps

As you scale, consider: more robust execution via VPS co-location, a time-series database for high-frequency logging (InfluxDB/Timescale), and orchestration (Kubernetes) for multiple strategy instances. For more advanced research, use GPU-enabled training for ML models and store features in feature stores for reproducibility.

Conclusion

Automating a Forex strategy with MetaTrader and Python is a practical, powerful approach when done methodically. Define clear rules, use high-quality data, backtest with realistic execution models, bridge Python to MT with safe order handling, test extensively on demo accounts, and deploy with robust monitoring and kill-switches. Start small, document everything, and treat automation as engineering — not magic.

Ready to automate? Get our starter pack

Download a demo Python↔MetaTrader bridge example, sample EAs, and a checklist to move from paper to live safely.

Further reading (authoritative outbound links)

Official doc resources: MetaTrader 5, Python, and packages: MetaTrader5 Python package.

RTech RFX Signals
RTech RFX Signals

Hands-on automation guides, transparent backtests and production-ready code for Forex traders.

rfxsignals September 30, 2025 No Comments

How to Combine Technical and Fundamental Signals for Precision Trading

How to Combine Technical and Fundamental Signals for Precision Trading

How to Combine Technical and Fundamental Signals for Precision Trading

Blending technical indicators with fundamental data creates more informed, resilient Forex signals. This guide shows you how to align data, weight signals, backtest properly, and deploy combined systems with risk controls.

Introduction — why combine technical and fundamental signals?

Technical and fundamental approaches each offer strengths and weaknesses. Technical analysis excels at detecting short-term price structure and momentum. Fundamentals explain why a currency should move over medium to long horizons (interest rates, macro surprises, trade flows). Combining them gives you both timing and direction — a precision approach that reduces false positives and improves risk-adjusted returns.

Core principles for combining signals

Successful combination rests on a few core principles:

  • Complementarity: signals should add independent information, not duplicate the same input.
  • Time-horizon alignment: match fundamentals to appropriate technical horizons (e.g., rate decisions → daily/weekly, momentum → intraday/hourly).
  • Robust weighting: use a systematic framework to weight signals instead of ad-hoc overrides.
  • Practical execution: consider slippage, spreads and latency — especially when mixing overnight fundamental trades with intraday technical entries.

Step 1 — select reliable technical indicators

Pick a small, diversified set of technical indicators that capture distinct characteristics:

  • Trend: moving averages (crossovers, slope) or ADX for trend strength.
  • Momentum: RSI or MACD to catch overbought/oversold and momentum shifts.
  • Volatility: ATR or Bollinger Bands for dynamic sizing and stop placement.
  • Order flow / execution signals: where available, tick-based momentum or order-book imbalances for short-term entries.

Keep the number of indicators small to limit overfitting. Convert each to normalized scores (e.g., z-scores or 0–1 scaled signals) so they can be combined consistently.

Step 2 — choose fundamental data that matters

Fundamentals should explain economic pressure on currencies. Useful categories:

  • Monetary policy: rate decisions, forward guidance, minutes and central bank speeches.
  • Macro surprises: CPI, unemployment (NFP), GDP vs consensus — convert the surprise (actual − consensus) to a numeric feature.
  • Balance-sheet & flow data: trade balances, capital flows, FX reserves where available.
  • Sentiment & positioning: COT reports, options-implied metrics, and institutional positioning snapshots.

As with technicals, normalize fundamental features and create event flags (e.g., “high-impact release at 08:30 GMT”) to avoid leaking future info into your model.

Step 3 — align horizons and timestamps

Alignment is the most common practical mistake. Fundamentals have release timestamps and can change market regimes. Technical indicators are continuous. Use these rules:

  • Tag each signal with a horizon (intraday, 1–5 days, 1–4 weeks).
  • Don’t use future fundamental data when generating intraday signals; only use data that would be available at decision time.
  • For event-driven trades (like NFP), define pre-event and post-event strategies with distinct sizing and stop rules.

Step 4 — signal fusion: weighting & rules

There are simple and advanced ways to fuse signals:

Rule-based fusion

Define rules such as “take trade only when both the trend indicator AND fundamental surprise point in same direction.” This is intuitive and easy to audit.

Score-based fusion

Convert every indicator to a normalized score and compute a weighted sum:

CompositeScore = w1 * TechTrend + w2 * TechMomentum + w3 * FundamentalSurprise + w4 * SentimentScore

Choose weights via domain expertise or optimize using walk-forward validation. Include a confidence threshold above which you take trades.

Machine learning fusion

Train a model (e.g., gradient boosting) on labeled outcomes using both technical and fundamental features. Use feature-importance methods to ensure fundamentals contribute meaningfully and that the model isn’t dominated by look-ahead artifacts.

Step 5 — position sizing and risk controls

When fundamentals are strong but technicals are marginal, reduce size rather than ignore either input. Use volatility-normalized sizing (ATR) combined with a maximum portfolio exposure, and apply dynamic stop-loss rules tuned to the combined signal’s confidence.

Backtesting best practices for combined systems

Backtesting combined strategies requires additional care:

  • Use time-series aware validation (rolling windows, out-of-sample periods).
  • Include execution realism: spreads, commissions, slippage, and delayed fills around news.
  • Simulate event windows for fundamental releases — price moves may be instantaneous and wide.
  • Report cost-adjusted metrics: net P&L, Sharpe, max drawdown and hit-rate by horizon.

Examples of combined signals

A few practical examples:

  • Carry + Trend: Long a high-yield currency only when the price is above its 50-day MA and the carry spread is positive.
  • Surprise + Momentum: After a positive CPI surprise for a currency, enter on momentum confirmation (e.g., RSI crossover) within a defined post-event window.
  • Sentiment filter: Only take technical breakout trades when institutional positioning is not overcrowded per COT snapshots.

Monitoring and model governance

Combined systems must be monitored for regime shifts. Track feature drift (e.g., the predictive power of CPI surprises over time), and set retraining cadences. Maintain transparent logs for each trade that record which signals fired and with what weights — this makes post-trade analysis straightforward.

Practical checklist before going live

  1. Confirm timestamp alignment between price and fundamental feeds.
  2. Run a demo or paper account under your broker for at least 60–120 trading days.
  3. Stress-test during different volatility regimes and around major economic events.
  4. Define kill-switch rules (e.g., pause trading after a threshold drawdown or after multiple failed news trades).

Conclusion

Combining technical and fundamental signals gives traders the best of both worlds: timing plus economic rationale. The key is disciplined design — align horizons, normalize signals, weight them systematically, and backtest with realistic execution rules. Start small, paper-test, and scale only once you can reproduce cost-adjusted results consistently.

Want our combined-signal templates & demo datasets?

Download our starter pack: timestamped trade templates, normalized feature examples and ready-to-run demo notebooks for rapid testing.

Further reading

For fundamentals and execution best practices, see reputable resources like Investopedia, BabyPips, and central bank websites for primary-source policy statements.

RTech RFX Signals
RTech RFX Signals

Practical trading systems, transparent backtests and educational resources for Forex traders.

rfxsignals September 29, 2025 No Comments

Top 5 Signal Providers Compared: Accuracy, Speed & ROI

Top 5 Signal Providers Compared: Accuracy, Speed & ROI
Top 5 Signal Providers Compared: Accuracy, Speed & ROI | RFXSIGNALS

Top 5 Signal Providers Compared: Accuracy, Speed & ROI

Choosing a signal provider isn’t just about claimed returns. Accuracy, execution speed, transparency, and realistic ROI assumptions matter most. This guide compares five leading provider types, the metrics to inspect, and a practical checklist so you can pick the right service for your goals.

Why comparing signal providers properly matters

Many providers advertise high returns, but those numbers are often cleaned, backtested, or cherry-picked. A meaningful comparison focuses on repeatable metrics: accuracy (how often signals are correct relative to expectation), speed (how fast the trade can be executed at advertised price), and ROI adjusted for risk, spread and slippage. The goal is to identify providers that deliver consistent edge under realistic conditions.

How we compare providers — the framework

We use five dimensions to compare providers:

  1. Accuracy: percent of winning trades vs total trades and expectancy.
  2. Speed & latency: time from signal to execution and slippage statistics.
  3. Realized ROI: net of spreads, commissions and typical slippage.
  4. Transparency & track record: live verified results, sample size, and reporting method.
  5. Risk management: position sizing rules, stop discipline, and max exposure limits.

The top 5 provider types (what you’ll usually find)

Providers cluster into types — each has strengths and trade-offs:

1. Human-curated signal services (experienced traders)

Pros: context-aware, adaptive to macro events, often conservative. Cons: limited capacity, human bias, slower execution. Best for: discretionary traders who want explanation & trade context.

2. Algorithmic/AI signal providers

Pros: scans many markets, runs 24/7, fast. Cons: risk of overfitting, opacity, needs monitoring. Best for: high-frequency or systematic traders comfortable with automation.

3. Copy-trading platforms (social/copy services)

Pros: easy to follow proven traders, good for passive users. Cons: crowd impact, leader survivorship bias, and platform risk. Best for: beginners who prefer hands-off execution—test with small capital first.

4. Hybrid services (signals + execution API)

Pros: combines algorithmic signal generation with human oversight or execution automation. Cons: higher cost, complexity. Best for: traders who want the speed of automation and safety of human checks.

5. Broker-provided signals & in-platform indicators

Pros: seamless execution, integrated. Cons: potential conflict of interest, limited transparency. Best for: traders wanting simplicity but verify fills carefully.

Quick comparison table (what to look for)

Provider TypeAccuracySpeedRealistic ROIBest For
Human-curatedModerate (50–65%)Slow-ModerateMediumDiscretionary traders
Algorithmic/AIVariable (45–70%)FastHigh (if robust)Systematic traders
Copy-tradingDepends on leaderVariesVariableBeginners
HybridHigher (if well-managed)FastHighSerious traders
Broker signalsModerateFastLow-MediumConvenience seekers

Deep dive: accuracy vs expectancy

Accuracy alone is misleading. A strategy with 70% wins but very small winners and large, rare losers can be disastrous. Expectancy — average P&L per trade — is the better single-number summary: Expectancy = (Win% × AvgWin) − (Loss% × AvgLoss). When comparing providers, request both win-rate and average win/loss size, not only percent winners.

Execution speed & slippage — the hidden ROI killer

A provider might publish fast signals, but your fills determine real ROI. If signals are delivered by chat or email, execution may be delayed, increasing slippage. Providers that offer direct API execution or broker integration generally minimize this problem. Always test on a demo account to measure real slippage against the provider’s claims.

Transparency & statistical validity

Beware of short track records and tiny sample sizes. A provider with 20 trades and 80% wins is far less convincing than one with 2,000 trades and 55% wins. Ask for: live verified statements (e.g., Myfxbook, broker statements), raw signal logs, and clear definitions of how they calculate returns.

Questions to ask any signal provider

  • Do you publish live results or only backtests?
  • How do you handle spread, slippage and commissions in reported ROI?
  • Can I get raw signal logs to independently backtest?
  • What’s your typical time-to-fill and recommended execution method?
  • How many concurrent clients use the same signal (crowd impact)?
  • What are the maximum drawdown and worst monthly loss historically?

A practical selection checklist (use before subscribing)

  1. Verify > 300 live trades or multi-year live track record.
  2. Confirm provider reports ROI net of realistic spreads and commissions.
  3. Forward-test on demo for 30–90 days and record slippage.
  4. Prefer providers that offer API/broker integration for fast fills.
  5. Check risk controls: max exposure, size caps, stop enforcement.

Case study (how small slippage reduces ROI)

Imagine a provider with 100 trades/month average return 1% per trade gross. If average slippage+spread eats 0.3% per trade, monthly net drops 30%. Over time, that gap compounds — so execution matters as much as signal accuracy.

How RFXSIGNALS approaches provider evaluation

We combine automated backtesting, live forward-samples, and independent verification. Our priority: realistic reporting, clear risk rules, and API execution where possible. If you want, we publish a sample signal log and a demo-forward test so subscribers can independently verify performance.

Pro tip: Always align signal risk with your personal risk budget. A high-ROI provider with extreme drawdowns may be unsuitable if you can’t stomach the volatility.

Related posts (internal & outbound link opportunities)

Final checklist & next steps

When choosing a signal provider, prioritize transparency, realistic ROI calculations, and execution quality. Start small, forward-test, and only scale after verifying fills, slippage, and risk controls in your broker. If you want a personalized shortlist based on your capital, pair preferences and risk tolerance, reply with "Shortlist me" and we’ll prepare a tailored comparison.

Published: Reading time: ~9–11 min Tags: signal-providers, forex-signals, ROI, execution
rfxsignals September 25, 2025 No Comments

Breakout vs Reversal Forex Strategies – When to Use Each

Breakout vs Reversal Forex Strategies – When to Use Each
Breakout vs Reversal Forex Strategies – When to Use Each | RFXSignals

Breakout vs Reversal Forex Strategies – When to Use Each

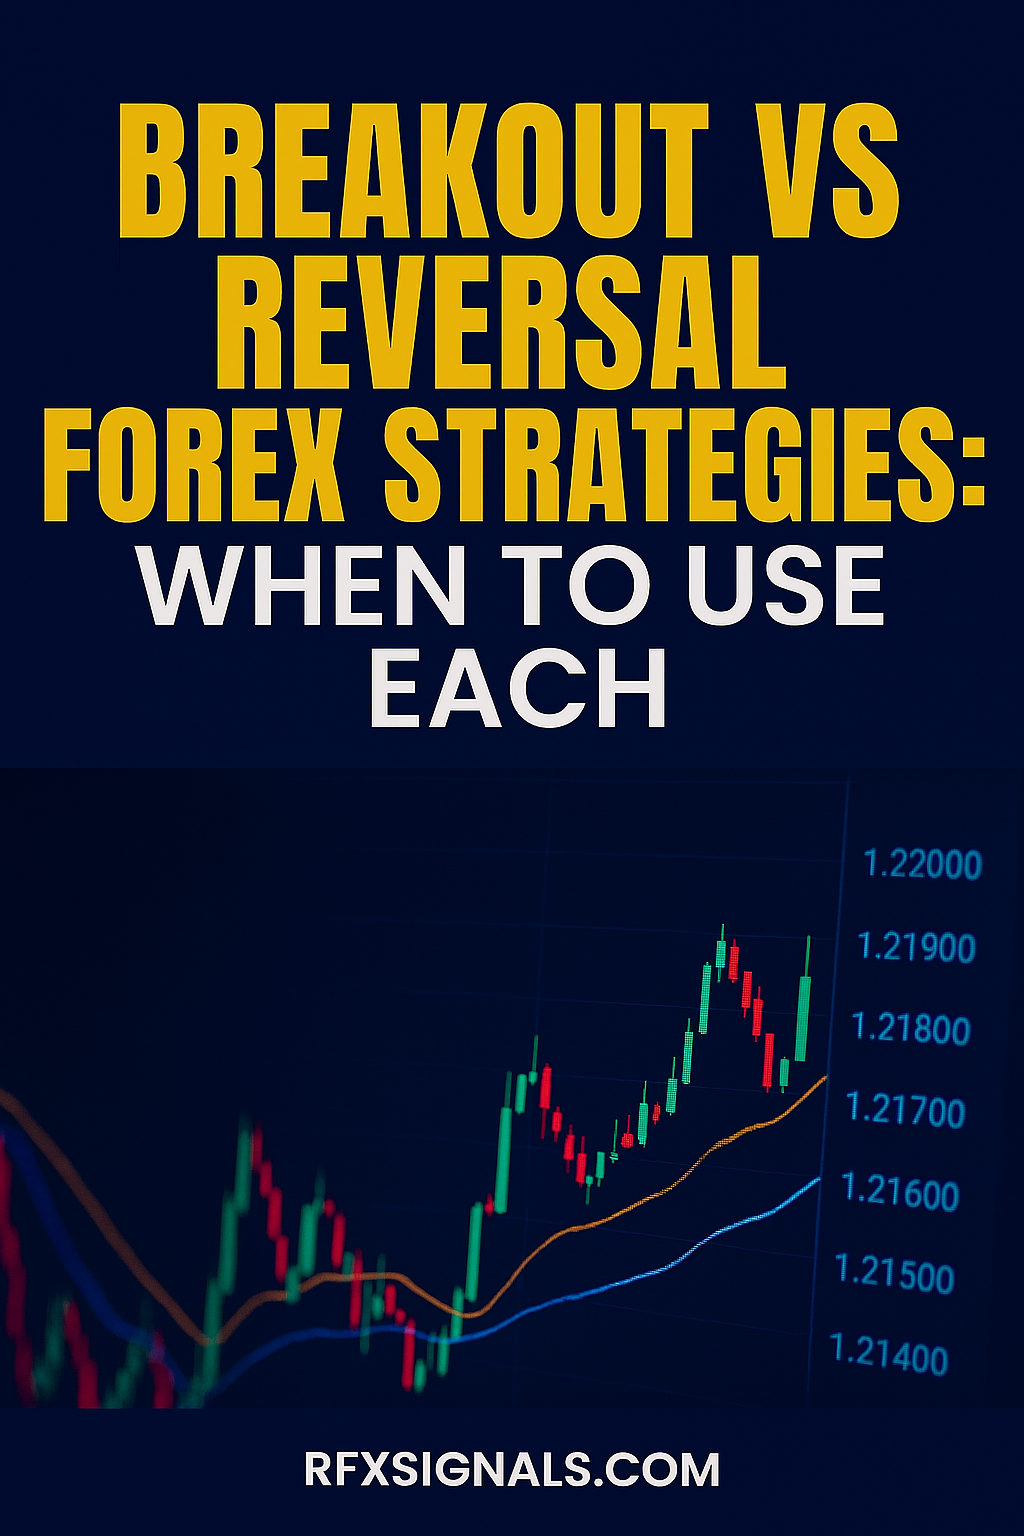
Forex traders often debate whether to focus on breakouts — trading in the direction of a new price movement — or reversals, capturing the turning points of market trends. Both have merit. The challenge is knowing when to use each approach and how to control risk. In this guide, we’ll explore definitions, mechanics, advantages, drawbacks, and how to decide which fits best in different market conditions.

Want Clear Breakout & Reversal Signals?

Join RFXSignals channels to receive real-time setups, including breakout entries and reversal alerts with annotated charts.

What is a Breakout Strategy?

A breakout strategy involves entering trades when price moves beyond a key support, resistance, or consolidation zone. The idea is that the breakout signals the beginning of a new trend, driven by an imbalance between buyers and sellers.

  • Types of breakouts: continuation breakouts (trend continues) and reversal breakouts (false range, new trend starts).
  • Common tools: support/resistance levels, trendlines, Bollinger Bands, and volume analysis.

What is a Reversal Strategy?

A reversal strategy aims to catch turning points in the market. Traders look for overextended trends that are losing momentum and prepare for price to shift in the opposite direction.

  • Reversal signs: divergence with RSI/MACD, candlestick patterns (e.g., hammer, engulfing), support/resistance holding strong, or failed breakouts.
  • Risk factor: picking tops and bottoms can be high risk; stops are essential.

Pros & Cons of Breakout Strategies

Advantages

  • Catches strong trends early.
  • High reward potential if breakout sustains.
  • Clear entry triggers from price levels.

Disadvantages

  • False breakouts are common.
  • Requires quick execution and discipline.
  • Choppy markets lead to repeated small losses.

Pros & Cons of Reversal Strategies

Advantages

  • Great risk-to-reward potential (tight stops).
  • Opportunity to profit before the crowd recognizes the trend change.
  • Useful in range-bound or overextended markets.

Disadvantages

  • High failure rate if trend is strong.
  • Psychologically tough — requires going against crowd sentiment.
  • Can result in frequent stop-outs if mistimed.

When to Use Breakout vs Reversal Strategies

Breakout Strategy is best when:

  • Price consolidates before a news event or session open.
  • Strong momentum builds after economic data releases.
  • Chart patterns form (triangles, rectangles, flags).

Reversal Strategy is best when:

  • Trend looks overextended (multiple consecutive candles).
  • Divergence between price and oscillators appears.
  • Price fails to break resistance/support multiple times.

Practical Examples

Breakout example: EUR/USD consolidates near 1.1000 for several sessions. On high volume, price breaks above resistance at 1.1050 — a breakout trader enters long with stop below the range.

Reversal example: GBP/USD rallies for days but forms bearish divergence on RSI. A bearish engulfing candle at resistance suggests reversal — trader shorts with stop above the swing high.

Risk Management for Both Approaches

  • Always use stop-loss orders: below the breakout level or above reversal entry.
  • Risk only 0.5%–1% per trade for consistency.
  • Take partial profits to lock in gains and trail stops for extended moves.
Pro Tip: False breakouts often become reversal setups. Don’t view the two strategies as opposites — they can complement each other if used with context.

Combining Breakout & Reversal Strategies

Smart traders use both depending on market context:

  • During high volatility sessions, breakout trades capture momentum.
  • In ranging conditions, reversal trades exploit boundaries.
  • Sometimes, a failed breakout immediately transitions into a reversal trade opportunity.

Link Building & RFXSignals Funnel

Checklist Before Entering

  • Is the market trending or ranging?
  • Is there strong confluence (volume, candlestick pattern, indicator)?
  • Is risk/reward favorable (at least 1:2)?
  • Am I prepared for false breakout or failed reversal?

Ready to Trade Breakouts & Reversals with Confidence?

Get live trade alerts and setups explained in detail — including breakout entries and reversal confirmations — directly in our community groups.

Conclusion

Breakout and reversal strategies are not rivals — they’re complementary tools. The best forex traders adapt to market conditions, applying breakouts in trending/high-momentum contexts and reversals in overextended or range-bound environments. Mastering both gives you a more flexible toolkit for 2025’s volatile markets.

Disclaimer: This article is for educational purposes only and not financial advice. Forex trading is risky. Test strategies in demo environments before committing real funds.