Forex Technical Analysis & Forecast 12.12.2019 (EURUSD, GBPUSD, USDCHF, USDJPY, AUDUSD, USDRUB, USDCAD, GOLD, BRENT, BTCUSD)
EURUSD, “Euro vs US Dollar”
EURUSD has chosen an alternative scenario to continue the ascending wave. Possibly, today the pair may grow towards 1.1150 and then start a new correction to reach 1.1111. Later, the market may continue moving upwards with the target at 1.1180.


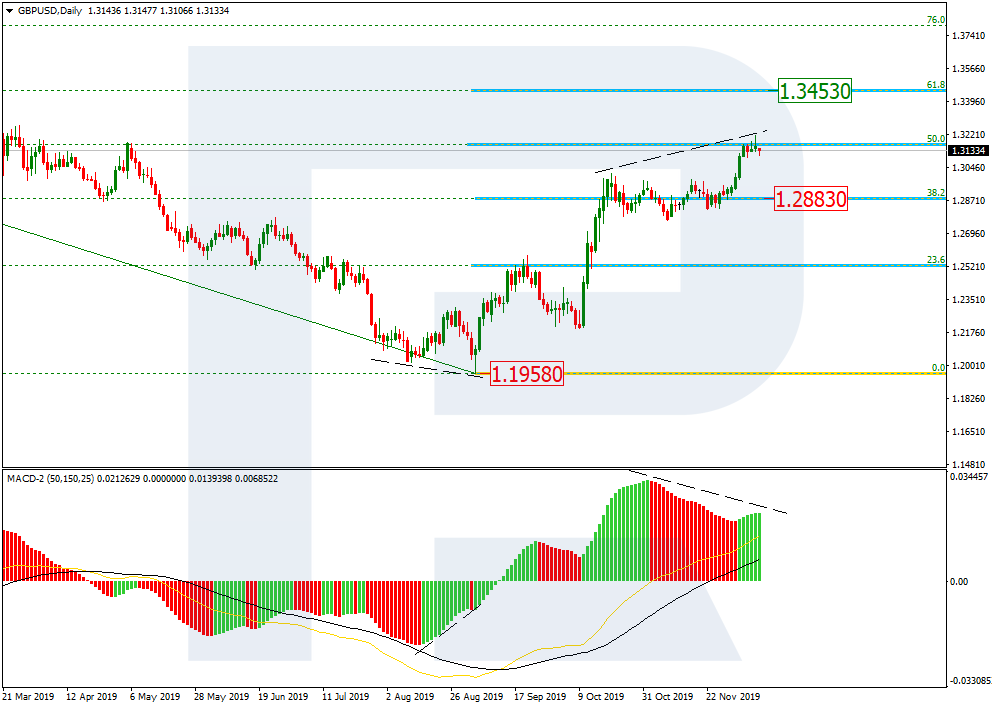
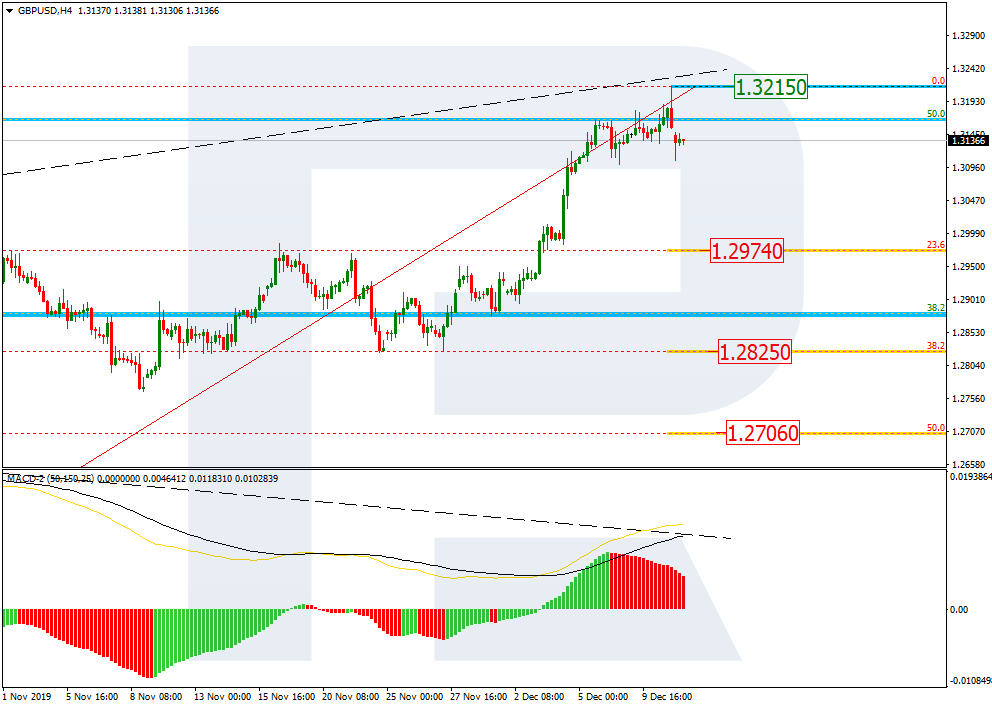
GBPUSD, “Great Britain Pound vs US Dollar”
GBPUSD is moving upwards. Possibly, the pair may extend the wave towards 1.3252. Today, the price may fall to reach 1.3200 and then start a new growth with the target at 1.3252.

USDCHF, “US Dollar vs Swiss Franc”
USDCHF has rebounded from 0.9861 to the downside; right now, it is still falling. Possibly, the pair may reach 0.9804 and then form one more ascending structure to return to 0.9860.

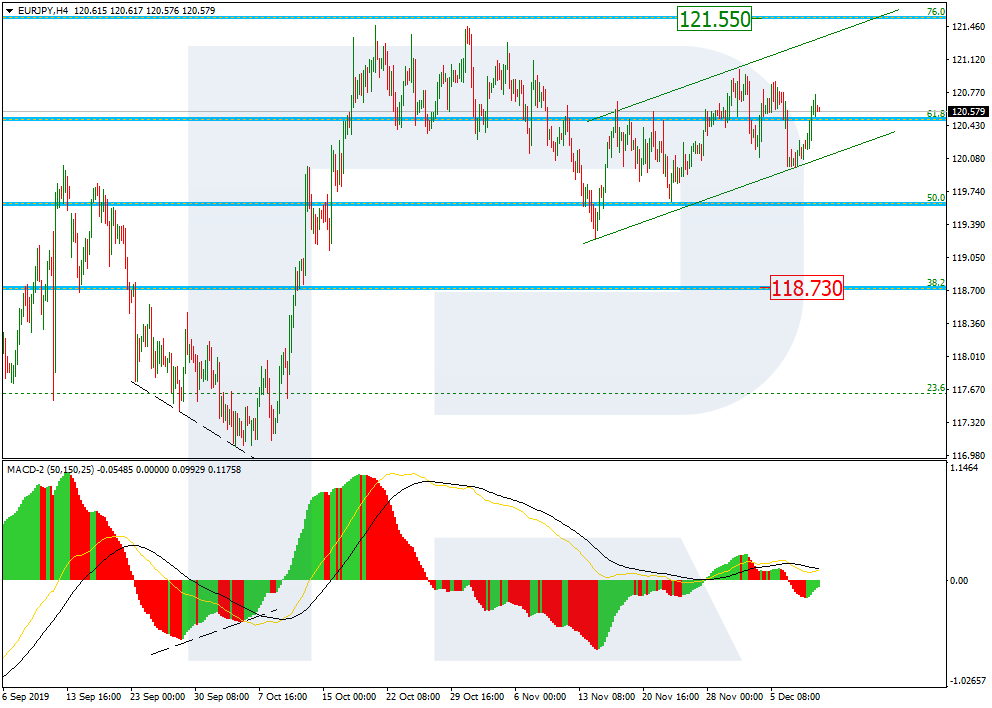
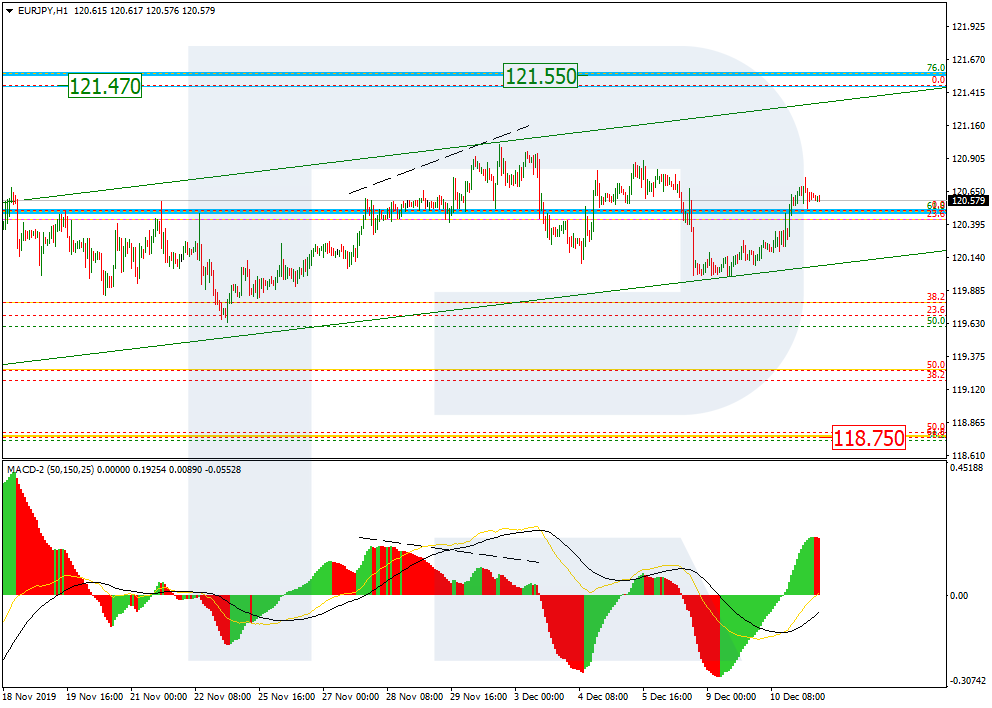
USDJPY, “US Dollar vs Japanese Yen”
USDJPY is forming another descending structure towards 108.27. Possibly, today the pair may reach 108.34 and then start another growth towards 108.57. After that, the instrument may continue moving downwards with the target at 108.27.

AUDUSD, “Australian Dollar vs US Dollar”
AUDUSD has broken 0.6850; right now, it is still growing. Today, the pair may test 0.6868 from above and then resume trading inside the uptrend with the short-term target at 0.6906.

USDRUB, “US Dollar vs Russian Ruble”
USDRUB continues forming the downside continuation pattern around 63.60. Possibly, today the pair may fall to reach 63.06 and then start another correction to return to 63.60. Later, the market may form a new descending structure with the short-term target at 62.75.

USDCAD, “US Dollar vs Canadian Dollar”
USDCAD is moving downwards to reach 1.3140. Later, the market may form one more ascending structure towards 1.3216, thus forming a new consolidation range between these levels. If later the price breaks this range to the downside, the market may resume trading downwards to reach 1.3108; if to the upside – continue the uptrend with the target at 1.3282.

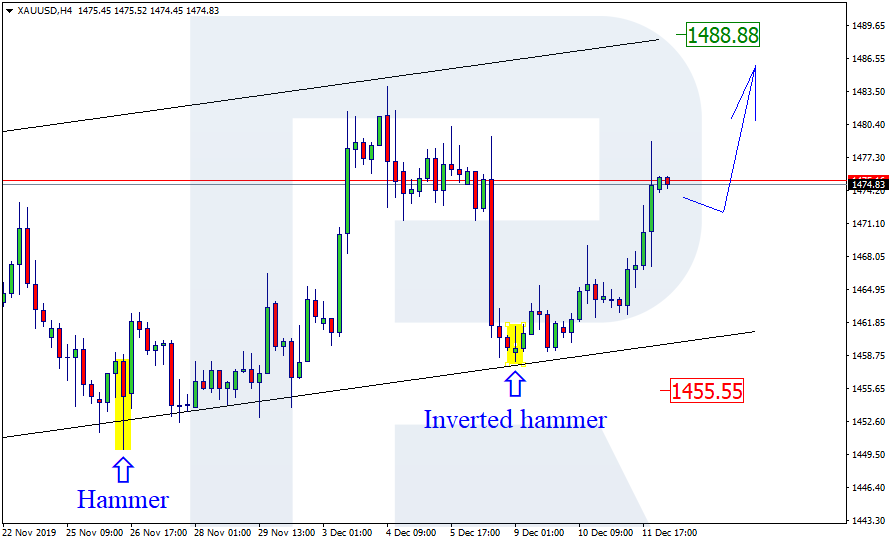
XAUUSD, “Gold vs US Dollar”
Gold has completed the ascending structure at 1470.60. Possibly, the pair may form an upside continuation pattern to start a new wave with the target at 1487.27. Today, the price may form a new descending structure to test 1470.60 from above and then and then resume moving upwards to reach the above-mentioned target.

BRENT
Brent has completed Flag pattern; right now, it is growing towards 64.88. After that, the market may start a new decline towards 64.12 and then form one more ascending structure with the short-term target at 66.77.

BTCUSD, “Bitcoin vs US Dollar”
BTCUSD is correcting towards 7000.00. Possibly, the pair may extend this structure down to 6900.00. After that, the instrument may resume moving upwards with the target at 8165.00.