rfxsignals April 4, 2020 No Comments

EURCHF Price Action Trading Strategy

​​​Characteristics of EURCHF

Much like the JPY currency pairs, it is nearly impossible to talk about the Swiss Franc or CHF pairs without mentioning its safe haven characteristics and the long-standing relation between risk sentiment in financial markets and the Swiss currency.

The Swiss Franc also has the desirable characteristics of a safe haven asset or currency like the Japanese Yen and the US Dollar. Any CHF currency pair in the Fx market, therefore, has a strong relationship with the general risk sentiment across markets. The typical behavior is a depreciating Swiss Franc (CHF pairs rising) in a risk appetite environment and a strengthening Swiss Franc (CHF pairs falling) in a risk-averse (risk-off) market environment.

As a result, EURCHF, to some degree, also behaves as a proxy currency pair for risk in the markets. The EURCHF pair tends to rise more gradually when risk appetite dominates and it tends to decline at a more aggressive pace when risk aversion is in the driving seat. When trading safe haven currencies this a usual behavior that one can expect and although there can be long periods of risk appetite and rising markets, traders should not be complacent because risk aversion can kick in suddenly.

When we talk about EURCHF we also have to note that we are talking about a currency pair comprised of two correlated currencies. The Euro and the Swiss Franc, being the currencies of two neighboring economies tend to be naturally correlated as their economies are closely linked to each other.

EURCHF price action trading

EURCHF Price Action Trading Strategy

The usual gradual and rangy behavior of the price action can be seen on this chart – EURCHF 4-hour timeframe
The price action on EURCHF is, therefore, most often gradual compared to some of the major and more volatile currency pairs although, as we noted earlier, somewhat more gradual in uptrends than in downtrends due to the risk sensitivity of the pair.

​As is often the case for Fx pairs comprised of two correlated currencies (with neighboring linked economies), the Euro/Franc exchange rate can also stay in ranges for prolonged periods of time. By the same token, the pair also tends to thoroughly test a certain technical area multiple times before moving on either higher or lower.

Support and resistance areas such as horizontal highs and lows as well as sloping rising or falling trendlines work well on EURCHF overall. Breakouts of such support/resistance zones normally result in continuation and fadeouts are not a common thing. Hence, trades taken based on a clear-cut trendline or a distinct horizontal support or resistance zone are likely to provide good results when trading the EURCHF currency pair.

Another common pattern on EURCHF is that the pair can often reach round numbers and reverse at the exact round numbers, such as for example, 1.2000 or 1.1500. That’s not to say that necessarily a sharp and complete reversal will occur at round numbers, but EURCHF often respects them at least in the shorter-term, like the daily and intra-day timeframes.

Round numbers commonly act as support or resistance across the different Forex pairs, but still, there are enough instances supporting the notion that this is more pronounced on the charts of the EURCHF pair compared to other currency pairs which have a smaller consistency of this effect.

​Trading conditions:

Long trade entries:

  • Look to enter on bullish patterns or signals at important technical areas including horizontal and trendline support. Rising support trendlines usually provide good entry points and EURCHF can often trade in rising channels.
  • Channels provide excellent trading opportunities as technical entries, stop loss and profit target levels are clearly known in advance.

Long trade stop loss:

  • Look to place the stops behind key support areas. Although support levels may be tested frequently by the price before a push higher, if the bullish move will continue support will probably hold, so it’s a prudent place to put a stop at.

Long trade exits and targets:

  • Target important technical (resistance) areas higher. Pivotal resistance highs are also normally respected on EURCHF, so taking profits at such points is likely to prove a profitable strategy.
EURCHF trading strategies

EURCHF Price Action Trading Strategy

The pair rallied supported by the rising trendline, then reached the 1.2000 round number level precisely and fell from there. The downside breakout below the trendline signaled that a stronger bearish move could occur – EURCHF 4-hour chart
Short trade entries:

  • Breakouts below key support areas usually precede quick and fast declines in the price, so these instances should be considered for entering potential short positions. A break of a rising support trendline is also normally a solid bearish signal for EURCHF.
  • Analyzing the market with core concepts of technical analysis in this way is a solid approach to find good trading opportunities on this pair.

Short trade stop loss:

  • Place stops above the bearish breakout points and distinct resistance areas on the charts. Additionally, EURCHF can commonly come back to a broken support level to retest it and that can provide a second chance to enter or even a better opportunity to sell and place a better stop loss order.

Short trade exits and targets:

  • Targets toward key support areas and round number psychological levels are generally good technical points to take profits.
EURCHF trading strategy patterns price behavior

EURCHF Price Action Trading Strategy

In a similar pattern as on the previous chart, EURCHF first broke the rising support trendline, and then the breakout of the horizontal range to the downside signaled the acceleration of the sell-off – EURCHF 4-hour timeframe

Don’t forget about SNB interventions

Another important aspect that must be discussed when talking about the Swiss Franc is central bank interventions. It wasn’t that long ago when we witnessed massive exchange rate moves in CHF pairs of over 1000 pips, (yes one thousand) in a matter of hours due to the actions and interventions of the Swiss National Bank (SNB).

Leaving the fundamental reasons aside, when it comes to technical analysis and price action trading, the SNB interventions caused massive disruptions in the charts on the EURCHF pair. Such instances when authorities directly intervene in the Forex market can make it harder to apply and make sense of the regular technical analysis tools and price action trading methods. For these reasons, many Forex traders completely abandoned the EURCHF pair (and other CHF pairs also) during the years when the SNB controlled the EURCHF exchange rate through the implementation of the 1.2000 floor.

Although in recent times the pair has reestablished its old “more normal” behavior to a large degree, still the possibility of interventions and the large spikes in the price action that the SNB can cause are still in the back of all CHF Forex traders.

rfxsignals April 4, 2020 No Comments

NZDUSD Price Action Trading Strategy

​The next commodity Fx pair that we will look at is NZDUSD as part of our series on the characteristics of price action of the major Forex pairs.

​​Characteristics of NZDUSD

The closest cousin of the AUDUSD pair, NZDUSD is highly correlated with AUDUSD. Its trading characteristics and the behavior of price action on NZDUSD are therefore very similar to the ones seen on the charts of AUDUSD. The price generally moves in orderly steps especially on the larger timeframes such as 4-hour, daily and higher, although fake breakouts can occur from time to time.

NZDUSD most of the time trades in a swingy fashion. That is the price tends to move in swings which is probably what makes the pair very well suited for swing trading. The quite often and frequent formation of trendlines and channels further strengthens the swing trading characteristics of the NZDUSD major pair, but also of other NZD pairs too.
NZDUSD price action swing forex trading

NZDUSD Price Action Trading Strategy

NZDUSD often trades in swings, forming trendlines and channels in the process – NZDUSD 4-hour chart
​This means that like AUDUSD, NZDUSD also retraces much of the moves, either up or down. Trendlines hold generally well. When a trendline that has held for a while is broken it’s a solid signal that the trend has reversed. Horizontal support and resistance also work well but are also overshot by the price sometimes (meaning the price can first push through them before reversing later). Fibonacci retracements and extensions ratios and patterns based on the Fibonacci levels such as the Harmonic patterns also tend to work very well on NZDUSD.

​​Trading conditions:

Long trade entry:

  • Look to catch the bullish swings at either good support areas or on breakouts above clear resistance levels (either trendlines, channels or ranges). Trendline support also works very well for joining bullish swings and bullish trends so traders should seek to take advantage of this when trading the NZDUSD pair.

Long trade stop loss:

  • Look to place the stops below the key distinct support zones after joining a trade. If a clear-cut support is broken (such as a rising trendline) then the long trade will most likely not work anymore as the trend would have probably reversed at this point.

Long trade exit and targets:

  • Target resistance areas to the upside as well as Fibonacci extensions/retracements. Taking some profits when a resistance or Fibonacci area is reached is generally a good strategy when trading NZDUSD since the pair retraces the moves frequently.
NZDUSD channels trendlines forex trading

NZDUSD Price Action Trading Strategy

Text-book like channels and trendlines are quite common on NZDUSD. This particular channel offered many good bullish opportunities to join the trend – NZDUSD 4-hour chart
Short trade entry:

  • ​Look to sell rallies (retracements) during downtrends and downswings. This can be done either at falling trendlines or key classical resistance and Fibonacci resistance zones.

Short trade stop loss:

  • Placing stops above key resistance zones works well. Once NZDUSD breaks a rising or falling trendline it will usually continue to travel in the new direction for a while before pausing. Thus, selling at resistance and placing the stops behind the resistance can offer great risk-reward trades.

Short trade exit and targets:

  • Target support zones and Fibonacci extensions/retracements to the downside. Most of the time support will be at least respected temporarily before being broken.
Trends NZDUSD forex trading trending

NZDUSD Price Action Trading Strategy

Channels like the one shown above frequently appear on the NZDUSD charts. A “selling at resistance” strategy provides excellent opportunities to profit during a falling channel – NZDUSD 1-hour chart

​Some of the typical behavior of NZDUSD on the charts

  • Many that hold true on AUDUSD are also true for NZDUSD. In this regard, due to the close correlation with AUDUSD, very often NZDUSD can rise or fall in tandem with AUDUSD without any NZD specific news and vice versa.
  • NZDUSD like the other commodity currencies (AUD and CAD) is affected by commodity prices, but in the NZD case, the main commodities that affect it are dairy and milk prices. The GDT Price Index which is released twice per month is the most watched economic data when it comes to the Kiwi currency. However, due to its correlation with the other commodity currencies, NZD can also trade on general commodity trends and trends in commodity currencies. So, staying generally updated with movements in commodity markets is also important when trading the NZD currency and the NZDUSD pair.
  • Also similar to AUDUSD. NZDUSD can also be sensitive to economic data released from New Zealand during the Asian overnight session. Dry liquidity during the Asia-Pacific trading session combined with big misses in economic data can cause large price spikes on the chats of NZDUSD. Due to the close connection between the Australian and the New Zealand economy, the NZ Dollar also reacts to economic data released from Australia. But again, like in the case of AUDUSD, price spikes during the Asian session are often fully reversed and by themselves can often mislead traders in the wrong direction.

  • The pair very often trends but the pace and slope of the price action is gradual. Like AUDUSD, most of the moves within the trend are retraced partially – offering nice trading opportunities to join the trend. Trendlines and channels are highly reliable technical tools to use for this on the NZDUSD currency pair as we discussed earlier.
rfxsignals April 4, 2020 No Comments

USDJPY Price Action Trading Strategy

USDJPY Price Action Trading Strategy

Whenever we are discussing the Japanese Yen and its trading characteristics in the Fx market, the first thing that comes to mind is risk sentiment. The USDJPY pair is the major Fx pair that is most famous for its sensitivity to risk. Risk on and risk off changes in the market are often the main drivers of the USDJPY exchange rate.

Risk appetite drives this currency pair up and a risk aversion mood can quickly send it tumbling lower. For the same reasons, USDJPY is also most of the time positively correlated with US stock indices such as the S&P 500 and with US bond yields such as the 10-year treasuries.

USDJPY is usually not the most volatile currency pair in Fx. In fact, it is one of the least volatile major currency pairs which makes it suitable for trading some specific strategies. However, its volatility can change suddenly due to risk-on – risk-off changes in market sentiment which can lead to sharp and unpredictable movements in some situations. During times of risk aversion, the volatility of USDJPY rises substantially. The good news is that these situations where the markets are falling can also be profitable for Forex traders.

The price action on USDJPY is generally gradual. Reversals can be sharp but most often they happen at an already established support or resistance zone and often come in the form of some pattern such as double top/bottoms, head and shoulders etc. This pair can trade in a sideways market often and for prolonged periods of time.

USDJPY price action trading forex

USDJPY Price Action Trading Strategy

USDJPY 1-hour chart – Normal volatility is low and support/resistance hold well. However, the volatility of USDJPY increases significantly when important fundamental news is released!
The risk sensitivity causes the USDJPY price action to behave in a way similar to stocks – meaning the price is rising slowly in uptrends but comes down quickly in downtrends. This has to do with the fear effect of markets and how panic causes prices to come down more quickly than optimism causes them to rise. In this regard, although correlated with global stock markets in general, USDJPY is most closely correlated with US stocks.

When considering these USDJPY behaviors, it’s important to be aware of the reasons for the trend. If it’s caused by global factors (such as stock markets falling or major countries entering a recession) then the above-described behavior is likely to prove true. But, currencies are often driven by central bank policies and other events as well, so in such cases, USDJPY could also rise just as quickly and powerfully due to reasons other than risk appetite (the BOJ quantitative easing program starting in 2013 is an example of this).

Trading USDJPY:

Long trade entries:
There are 3 typical situations that often occur on USDJPY which provide bullish trading opportunities:

  • Support/resistance zones and breakouts tend to work well in USDJPY. Thus, look to enter at established support zones on confirmation signals such as a bullish pattern or other bullish signals. You can also use the break, re-test continuation strategy on USDJPY quite successfully to trade breakouts. You can read more about it here.
  • The other situation that can work well for taking long trades on USDJPY is to buy a dip after a sharp sell-off on a strong bullish reversal candlestick. As discussed earlier sharp sell-offs in USDJPY are usually triggered by a risk-off event in the market, but after the dust settles USDJPY often reverses the bearish move fully – providing great buying opportunities. You can use this strategy explained here quite successfully to exploit sharp reversals in USDJPY.
  • Joining established trends in USDJPY can also work well in a risk-on environment. Once bullish trends start they can last for quite a while– allowing many traders to profit on the move. Uptrends usually progress at a steady pace for days without a big retracement. Sometimes, for these reasons it can be difficult to find a dip to buy in USDJPY, hence looking to just join in can be a better approach in such situations.
Long trade – stops and targets:
Placing stops and targets very much depends on the reasons for entering the trades and whether USDJPY is trending or ranging in that situation. Usually, it’s best to place stops behind a strong support area and target an important resistance to the upside.
USDJPY risk on bull trend

USDJPY Price Action Trading Strategy

USDJPY 1-hour timeframe – Typical risk-on bullish price action on USDJPY intraday charts
Although the acceleration in the middle of the chart looks sharp, the tallest candle is about 27 pips only, which is very low compared to highly-volatile days in Forex. Also, notice how there is almost no big retracement in the whole move from left to right which can leave dip-buyers frustrated.
Short trade entry:

  • Breakouts of important support levels rarely occur without a strong reason. It will be either JPY strength (usually due to risk-off) or USD weakness. In either case, fake-outs are not frequent on USDJPY, so once a bearish breakout has occurred further continuation is likely.
  • Look to join accelerating bearish momentum. Risk aversion is the most often cause of sharp bearish moves in USDJPY, but often such moves don’t last long. Hence, it’s wise to be quick and take profits as soon as some support area or the bearish target is reached.
  • When downtrends gather momentum the price action exhibits the typical characteristics of a trending market, so trend-trading strategies can be used to join. Bearish trends on USDJPY, however, tend to be more volatile and faster than bullish trends.

Short trade – stops and targets:
Look to place stops above a resistance area, or if it’s a trending market trailing the stop lower would also be an appropriate risk-management strategy. Key support areas lower can be used as targets.

USDJPY Forex price action risk aversion

USDJPY Price Action Trading Strategy

USDJPY 1-hour chart – Risk-off downtrends tend to be much steeper and much more volatile on the USDJPY pair

Conclusion

The intraday charts that are presented in this article shown the nature of USDJPY price action in different situations. These differences in USDJPY price behavior have been in existence for a long time and are likely to stay for longer as well.

Due to the nature of the currency pair and the fundamentals that underpin it different trading strategies can be used successfully. USDJPY is affected by all the usual factors that currencies are affected and additionally by risk sentiment. In many ways, trading price action on USDJPY requires to be aware of the fundamental reasons that caused the price to move.

rfxsignals April 4, 2020 No Comments

AUDUSD Price Action Strategy

AUDUSD Price Action Strategy

AUDUSD is the first commodity currency pair that we will discuss in our series on the characteristics of price action of the different major Forex currency pairs.

​Some characteristics of AUDUSD

Also known simply as the “Aussie”, the AUDUSD currency pair very often trends at a very gradual pace with the price moving back and forth – often drawing a stairways alike formation on the charts. Fast and sharp one-way moves are rather uncommon and instead, the price action tends to move in a zig-zag fashion.

For example, if the trend is down AUDUSD will usually take a gradual path of making two steps down and one step up rather than just moving straight down for a prolonged period of time.

​If the trend is bullish, the same tends to hold true and AUDUSD would most probably gradually move up – partially retracing many of the bullish swings along the way.

Picture

AUDUSD Price Action Strategy

AUDUSD 1-hour chart with the Zig Zag indicator plotted (blue line) – Typical AUDUSD price action of “walking the stairs” and trading in channels. Also common, as soon as the price breaks out of one channel, another channel starts to form.
AUDUSD often trades in channel formations with breakouts generally having a good reliability regarding follow-throughs in the direction of the breakout. Reversals are rarely sharp and usually, several attempts at a resistance or support zone are needed before a trend is reversed. Retests of the broken support or resistance after a breakout are also very common – offering Forex traders great trading opportunities with excellent risk-reward.

Support and resistance zones also hold well. Bullish signals appearing at support or bearish signals at resistance offer reliable trades in most cases.

​Trading conditions:

Long trade entry:

Enter on breakouts of key resistance areas with a stop below the breakout point. Bullish breakouts of falling channels also provide reliable buy signals most of the time. For this, you can also use this strategy that shows how to trade pullbacks after breakouts for getting the highest probability trades.

Trading AUDUSD requires patience on many occasions and moves may look hesitant but they sure continue to move up and up after a while. During trends, traders can use trendlines and key support levels to join in the party.

Long trade stop loss:

Place stops behind support areas, but be careful of whipsaws which can be quite common on AUDUSD. This pair tests and re-tests support and resistance zones before completing a reversal, very often pushing the price a few pips higher/lower to take out stops.

Patience in holding a trade and staying focused on the important aspects rather than on noise can be key in these kinds of situations.

Long trade exit and targets:

Target resistance zones on the chart which most often will be respected. Also, rising – resistance trendlines and the upper end of channels provide good levels to target with long trades. Taking profits at Fibonacci extensions and retracements is also a good strategy on AUDUSD.

Picture

AUDUSD Price Action Strategy

The re-test of the broken falling channel (marked with the black circle on the chart) provided a good entry point for buy trades – AUDUSD 1-hour chart
Short trade entry:

Look to enter near resistance lines or other resistance areas after bearish patterns or bearish signals form. Bearish breakouts of support also offer good opportunities to sell.

Short trade stop loss:
Look to place stops above a resistance zone or above a breakout point in case of trading bearish breakouts.

Short trade exit and targets:
Target horizontal support zones from previous key lows.

If existing, target channel/trendline support – it’s likely that it does exist in most cases on the AUDUSD currency pair.

Picture

AUDUSD Price Action Strategy

Resistance was formed around the 0.8050 – 0.8100 zone and the break below the support trendline confirmed the reversal offering a nice short opportunity to target the support at 0.7800 (dotted horizontal line on the chart) – AUDUSD Daily timeframe

​A few more words on AUDUSD

  • Chart patterns such as double and triple tops/bottoms, head and shoulders, harmonic patterns as well as channels and trendlines tend to work very well on the AUDUSD pair and are respected very often by the price. This is good news for chartists and pattern traders as they can rely on the information they receive from the charts and make profitable trading decisions based on it.
  • Taking profits at key support and resistance levels, therefore, makes sense in most situations when trading AUDUSD as retracements during trends are quite frequent. AUDUSD rarely trends without many retracements during the trend. This can be an advantage for trend-followers as they get a lot of points where they can join in the trend and profit.
  • Volatility is usually lower on this pair compared to the most volatile currency pairs such as GBPUSD, EURJPY or even EURUSD. But AUDUSD is very sensitive to economic data releases from Australia and very often huge spikes in the price can be seen during the Asia-Pacific trading session when AUD reports are published. Australian economic releases often miss expectations, either to the positive or the negative side, and in such cases, the price can frequently spike higher or lower by 50 – 100 pips or more.
  • Thin liquidity during the overnight session is certainly playing a large part in the occasional large spikes in the AUDUSD price action during this time of the trading day. Either way, it’s important for traders to be aware of that and keep it in mind when trading the AUDUSD pair. Though large, these price moves caused by Australian economic reports can quite often be completely reversed after only a few hours.
  • On a more long-term perspective, AUDUSD is famous for being correlated with metal prices (copper, iron ore and gold). Thus for determining longer-term trends in the Aussie and the AUDUSD pair, Forex traders should definitely keep an eye on the charts of the key metal exports from Australia.
rfxsignals April 4, 2020 No Comments

GBPUSD Trending Price Action Forex Trading Strategy

GBPUSD Trending Price Action Forex Trading Strategy

Every currency pair in Fx has a unique character. GBP is famously known among Forex traders as the most volatile major currency, and normally, most of the GBP Fx pairs are highly volatile, including the most popular one – GBPUSD. As a result, different trading strategies have been created purely based on this volatility of the Pound, a notable example being the London open breakout strategy.

A little bit about GBPUSD

GBPUSD usually exhibits very trending price action that is very specific to this pair only. When a trend starts on “Cable”, the price can travel great distances without much looking back or pausing. Trends are also often thrusting with tall candles followed by tight consolidation. Sometimes retracements are also volatile, with tall candles in the opposite direction of the trend. But, nonetheless GBPUSD trends don’t stop easily, and such retracements don’t last very long before the predominant trend continues and catches momentum traders on the wrong side of the market.

All of the above suggests that we should probably be using a different set of indicators in a slightly different way when trading different currency pairs. For example, chart patterns are often disrupted on GBPUSD due to the volatility. The structures are often in an irregular shape and it is not uncommon for GBPUSD chart patterns to fail miserably.

So trading reversals such as trying to pick top and bottoms can be very tricky and is not the best way to trade this pair. Using trending strategies on GBPUSD, however, tends to work much better. In this article, we’ll focus on this aspect of trading the GBPUSD currency pair.

gbpusd price action forex strategy

GBPUSD Trending Price Action Forex Trading Strategy

GBPUSD 4-hour chart – Once started, trends can often accelerate instead of reversing on the GBPUSD pair

Trading conditions:

Long trade entry:

  • Look for a trend to exist first. Best to confirm this on higher timeframes and then switch to a lower timeframe to look for entry signals. You can check out some of the trend-trading strategies found under the strategies section here which can also be applied on GBPUSD.
  • Look to buy the dips on retracements when bullish signals appear such as the price bouncing at support or a continuation chart pattern appearing.

Long trade stop loss:

  • Place the stop behind support levels in the overall context of the trend.
  • If there is a rising trendline that holds the trend from the start (in many cases there is) then that’s a great place to put a stop behind.
  • Moving averages and Fibonacci retracements also work well in trending markets and are well suited for determining stop loss levels.

Long trade exit and targets:

  • Using a trailing stop is also a good option for trading trends
  • Target important resistance levels and Fibonacci extensions
  • Take profits if a key resistance area has been reached
GBPUSD Fx price action trading strategy

GBPUSD Trending Price Action Forex Trading Strategy

GBPUSD 1-hour chart – Small retracements and bullish continuation are common when GBPUSD uptrends develop. The black rectangle in the middle indicates a retracement of a larger degree also visible on higher timeframes.
Short trade entry:

  • Find a solid trend on the higher timeframes
  • Look for continuation patterns/signals to sell the rallies
  • Enter at solid resistance levels or bearish (continuation) patterns


Short trade stop loss:

  • Place stop loss behind a resistance area.
  • Falling trendlines, moving averages and Fibonacci retracements can also be used to place a stop loss.


Short trade exit and targets:

  • Exit trade if the price crosses above a falling trendline or another indicator that was clearly acting as resistance during the trend
  • Take profits at important support areas
  • Target projections of previous swings and Fibonacci extensions to the downside
Price action trend trading GBPUSD

GBPUSD Trending Price Action Forex Trading Strategy

Cable follows the same script to the downside as well. Large candles take the price lower followed by tight (small) consolidation – GBPUSD 1-hour chart

Some additional guidelines:

Pound sterling is generally an unstable currency for trading due to its volatility. Sharp intra-day reversals happen often. For example, GBPUSD can surge in the morning and then give up all those gains. In the afternoon, it can fall further and at the end of the trading day, close in the red.

Sometimes booking profits early is a smart tactic on GBP pairs for these reasons. Price swings of 100 pips in both directions on the same day is something that can be regularly found on the charts of GBPUSD. This is especially true on big days when the economic calendar is packed with important events.

Horizontal ranges with tall candles and fast-paced price action in both directions can also be seen on this pair. Breakouts can be difficult to trade in such situations as the support and resistance lines of the ranges are rarely clear-cut.

GBPUSD price action Forex

GBPUSD Trending Price Action Forex Trading Strategy

GBPUSD doing its thing – 1-hour chart
On the above chart, notice how the candles inside of the channel are all tall – both green and red. Usually a tall candle is an indication of strong momentum, but unfortunately, on GBPUSD, that signal has proved to be rather ineffective and often misleading. In the middle of the chart, we can see a fake breakout, also a situation that is quite common on GBPUSD.

Generally, all GBP pairs are trending. It’s commonly known that GBPJPY and GBPNZD are one of the most volatile and most trending currency pairs in Fx. Instead of range-trading or top/bottom picking, look to trade powerful trends on GBPUSD such as the ones shown in the first 3 charts. Look for a tall bar followed by small candles (consolidation) and then another tall bar in the direction of the previous one. In such cases, trends on GBPUSD normally last for longer compared to other currency pairs.

rfxsignals April 4, 2020 No Comments

EURUSD Price Action Forex Trading Strategy

EURUSD Price Action Forex Trading Strategy

The EURUSD currency pair is the most liquid and most traded instrument in the Forex market. It, therefore, attracts a lot of attention from retail traders as well as pros, such as the big banks and institutions that professionally trade Fx.

If you are familiar with the Forex market to some degree, you probably already know or have come to understand that every currency pair behaves slightly differently on the charts, even when it looks similar. In a way, every currency pair has its own unique personality and most often behaves in line with this “personality”.

In this article, we will discuss strategies and patterns that are based on some of these unique characteristics of EURUSD which can be used specifically on the charts of the EURUSD currency pair. EURUSD normally has very consistent patterns on the charts and the price action is usually moving in an orderly manner. Chaotic price action is rare and probably you will only see it when big events catch the market off guard and surprise traders.

EURUSD also often trades in very well-defined channels across the different timeframes and charts, so keeping an eye on that perspective is also very valuable. Breakouts also often provide good trading opportunities. Support and resistance levels generally tend to hold well.

Forex Price Action Trading EURUSD

EURUSD Price Action Forex Trading Strategy

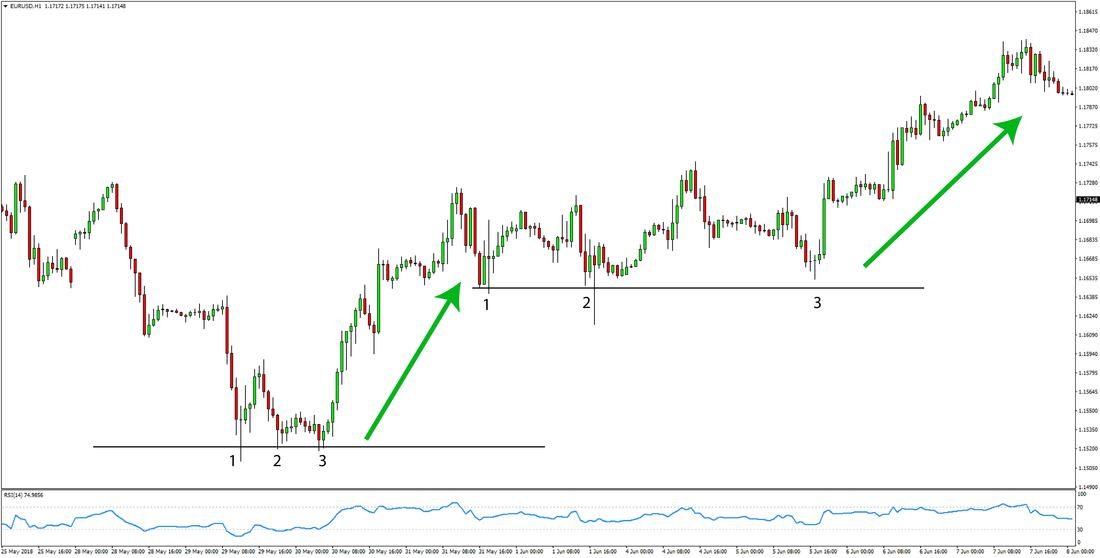
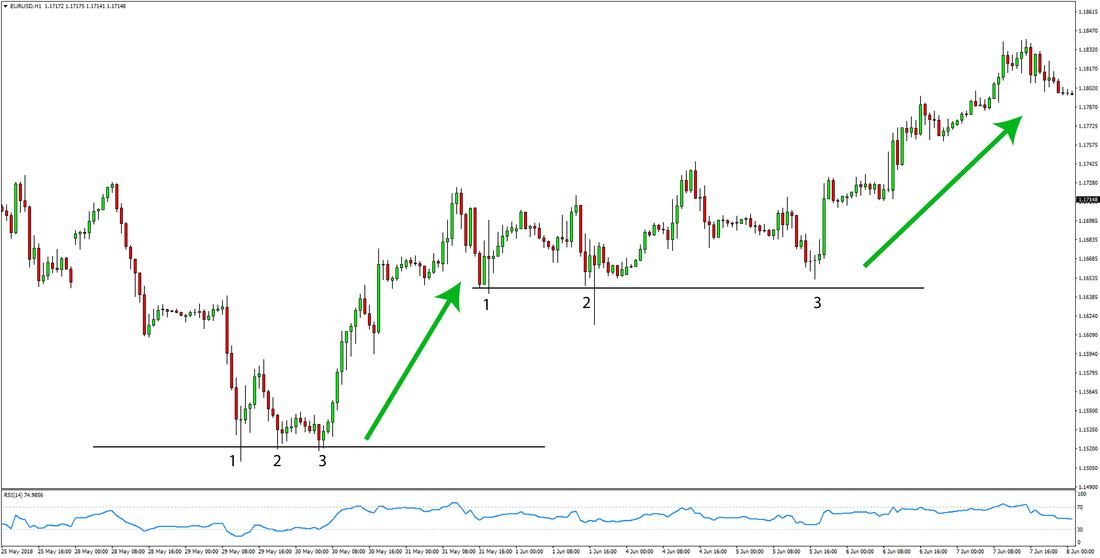
An example where EURUSD started two bullish legs after bottoming twice in a pattern of 3 lows – 1-hour chart

Trading conditions:

Long trade entry:
Wait for two consecutive lows to form on EURUSD and then on the 3rd bounce in the price you can enter long.

Bullish reversals usually form a basing pattern of 1 low then another lower low and then another higher low. This is also a chart pattern that works well on any other asset or currency pair generally but one that is also very specific to EURUSD just because it happens frequently. Sometimes it can also take the shape of an inverted head and shoulders pattern but that is not necessary for it to work.

The lows don’t all have to be at exactly the same level, but only need to be in roughly the same area.

Long trade stop loss:
Place the stop loss order below the lowest low of the 3 lows.

Long trade exit and targets:
Look to target the next resistance higher. Although powerful trends can start after this basing pattern on EURUSD, obviously it’s not always the case. So, taking some profits on the first sign of weakness on the bullish move is still an appropriate way to trade. Most often though, the next solid resistance higher will be reached after this basing pattern.

On the chart below, a bullish example of a long trade is shown:

EURUSD Price Action Patterns

EURUSD Price Action Forex Trading Strategy

The powerful bullish price action on the 1st and 3rd low (tall green candles that close near the highs) provide more conviction that the bottom will hold – EURUSD 4-hour chart
Short trade entry:
Wait for two consecutive highs to form on EURUSD and then on the 3rd bearish turn in the price you can enter short.

Short trade stop loss:
Put the stop-loss order above the highest high of the 3 highs.

Short trade exit and targets:
Target the next support to the downside. This support needs to be of the same size, meaning if the pattern has appeared on the 1-hour chart, then the target should be also based on the 1-hour chart.

An example of a short trade is shown below:

Forex Price Action Strategy

EURUSD Price Action Forex Trading Strategy

An example of a bearish leg starting after EURUSD formed 3 distinct highs – EURUSD 1-hour chart
On the above chart, notice how the two pairs of 3 highs (first marked with black numbers and the second in blue) are of the same nature. The first 3 highs are smaller and thus offer lower conviction for a top than the second pair of 3 highs. The second 3 highs (marked in blue) are taller and the shadows are longer. Thus the second pattern is more convincing than the first pair of 3 highs.

Additional guidelines:

  • An important aspect to keep in mind is that the 3 highs or 3 lows (depending on whether it is a bearish reversal or bullish reversal) will usually take the same shape. That is, if the first low is rounded and formed by several candles then the next two lows should also take the same shape. They don’t have to look exactly the same but should be similar in nature. If on the other hand, the lows are formed as sharp reversals with only 1 – 2 candles at it, then all 3 lows should be of this nature.
  • Keep an eye on the overall trend on the pair. If the trend on larger timeframes is bullish or bearish then the basing or topping pattern will work more accurately than the opposite. For example, if the trend on the daily and weekly is bullish and you see this 3 lows basing pattern on the 1-hour chart then it has a very high probability to provide a profitable trade. However, if you spot the same pattern while the weekly and daily charts are bearish, then the chances of it working will be lower simply because it’s going against the major trend in the market.
  • Adding a momentum indicator on the chart such as the RSI helps to read the power behind the price action. Bearish or bullish divergence often helps to pick better entries with this strategy as it confirms that the trend is losing steam and a reversal is near.
  • This pattern is also similar and often appears as the head and shoulders pattern. If you see the head and shoulders pattern on EURUSD then that’s potentially a very good trade, especially if the overall setup looks good and is confirmed by other indicators as well.
rfxsignals April 3, 2020 No Comments

Trading the Gap Forex Trading Strategy

The price always fills the gap.” This is a common quotation among traders on the financial markets. What this means is that when the day closes at a particular price and opens at another price, whether it is higher or lower than that previous close, once trading begins, the price will most probably move to fill the gap. The gap is the difference between the closing price on one day and the opening price on the following day.
Forex Gap

Stock Market and Gaps

Gaps are common in the stock market because trading usually only occurs between set market hours depending on which stock exchange trading is being conducted. For example, the New York Stock Exchange is only open between 9:30am and 4:00pm ET. every weekday.

​Even though trading may occur beyond this time, the charts would not have been updated. There is therefore a gap between the hours of 4:01pm and 9:29am on the following day. During this time, the ask and bid prices may change and this change is reflected in the opening price on the following day.

In general, all markets with set market hours are often a subject to gaps in prices between trading and non-trading hours.

Forex and Gaps

​Although the Forex market operates 24 hours per day, the markets are technically closed during the weekends on Saturdays and Sundays. However, the forex market is only closed to retail traders. The large banks and hedge funds may still trade during the weekend and this trading creates gaps.

Gaps tend to develop based on fundamental news during the period when the markets are closed to retail traders but may also be based on technical factors such as breakouts. Therefore, although there are usually no gaps in the Forex market during the weekdays, gaps are common during the weekends.

For example, the GBP/USD may close the week at a price of 1.2192 and open on late Sunday evening or the next Monday (depending on your broker) at a price of 1.1996, there would have been a gap down of 196 pips. When trading begins on Sunday or Monday, the price can tend to move upwards in order to fill that gap. You can clearly see such situation in the chart below. And if the gap was an upside gap, the price would tend to move downwards to fill that gap.

Forex Gap

Trading the Gap Forex Trading Strategy

​Types of Gaps in the Forex Market:

There are three different types of gaps that may be formed on any market.

Breakaway gap

The first type of gap is called a Breakaway gap. With a breakaway gap, it can indicate that a new trend is about to develop. Whenever the market is bound by ranges and the gap forms outside of this range, that is what is called a breakaway gap. ​
Breakaway Gap

Trading the Gap Forex Trading Strategy

​Runaway gap

​Another type of trading gap is the Runaway gap in which the gap forms in conformance with the current trend. For example, if the current trend is bullish and the gap that is formed is a gap up, then that gap is a runaway gap. Vice versa applies for bearish runaway gaps.
Runaway gap

Trading the Gap Forex Trading Strategy

​Exhaustion gap

The final type of trading gap is known as an Exhaustion gap. As the name suggests, this type of gap indicates a trend reversal following a long and prominent trend. The best way to trade the ​exhaustion gap is usually to watch the following candle and upcoming candlestick pattern or price action. In the chart below, you can see that the following candle after the exhaustion gap formed the Doji candlestick pattern. This was a clear reversal pattern.
​Exhaustion Gap

Trading the Gap Forex Trading Strategy

​How to Trade the Gaps

Trading the gaps is a matter of choice. While some traders swear by trading gaps, other traders avoid doing so. Some traders have found that, depending on the particular currency pair, the gap tends to be filled in the majority of cases. These traders therefore feel comfortable trading the gap.

On the other hand, other traders are of the view that the gaps don’t always get filled and that they tend to be filled less often than not. These traders avoid trading the gaps.

​The truth is that trading the gaps may be profitable if you choose the right currency pairs or stock indices and if those markets tend to fill the gaps more often than not. If you choose to trade the gaps, there are a few things that you should bear in mind.

Trading Forex Gaps

Trading the Gap Forex Trading Strategy

To begin with, it is best to use a currency pair or market that is very volatile. When this is the case, the gaps tend to be wider and the probability of most of them being filled is greater than with less volatile currency pairs or other markets. Once you have identified an appropriate currency pair, you should look for trading gaps on Sunday evening or Monday morning (depending on when your broker starts trading after weekends).

With this type of strategy, some traders believe that it is best to avoid using stop losses and take profits since the bottom and the tops of the gaps would naturally act as stop loss and take profit points. However, other traders believe that stop losses should always be used and should be set at key resistance or support levels to avoid huge losses. The choice depends on the choice of every trader based on his own risk assessment. However, in general, stop-loss orders should be definitely placed in every trade.

Forex Gap Trading Strategy

Trading the Gap Forex Trading Strategy

​When trading the gaps, you can keep the trade open until near the end of the weekly trading session. Five minutes before the week closes may be a good time to close the trade. Or another way is to close the trade as soon as the gap gets filled. Even both trade exit strategies can be combined and used for partial trade closure.
Forex Gap Trading System

Trading the Gap Forex Trading Strategy

If you decide not to trade the gaps, you may still meet the gaps when trading based on strong candlestick patterns such as strong dark cloud cover, a bullish abandoned baby, or bullish piercing or engulfing patterns.

​Conclusion

​Trading the gaps in the forex market may prove to be a profitable undertaking if the currency pairs have a relatively high level of volatility. However, there are no guarantees that the gaps will be filled and therefore, trading the gaps should be done with caution. For the more risk-averse trader, it is always best to use stop losses. For those who choose not to trade the gaps in the forex market, the gaps may still be used to identify and confirm strong candlestick patterns.
rfxsignals April 3, 2020 No Comments

Support and Resistance Forex Monthly Strategy

Support and Resistance Forex Monthly Strategy

Support and resistance on the monthly chart are very important technical indicators as they affect all lower timeframes. These areas on the chart usually indicate major multi-year highs or lows and the price almost certainly reacts at them on the lower timeframes.

Trading the monthly chart offers long-term trading opportunities that often provide profits of thousands of pips. Trading patterns and signals are much more reliable and fake-outs are far less common. These are some of the main reasons why many serious traders prefer to trade the monthly chart.

This strategy is quite simple and based only on solid technical trading principles that the big institutions and interbank Forex traders also trade on. The classic indicators and patterns on the monthly timeframe work very well because so many people are trading by them and there is no single player that can control the market to that degree to cause fake-outs on the monthly chart. In contrast, all lower timeframes can be affected and are often manipulated in this way.

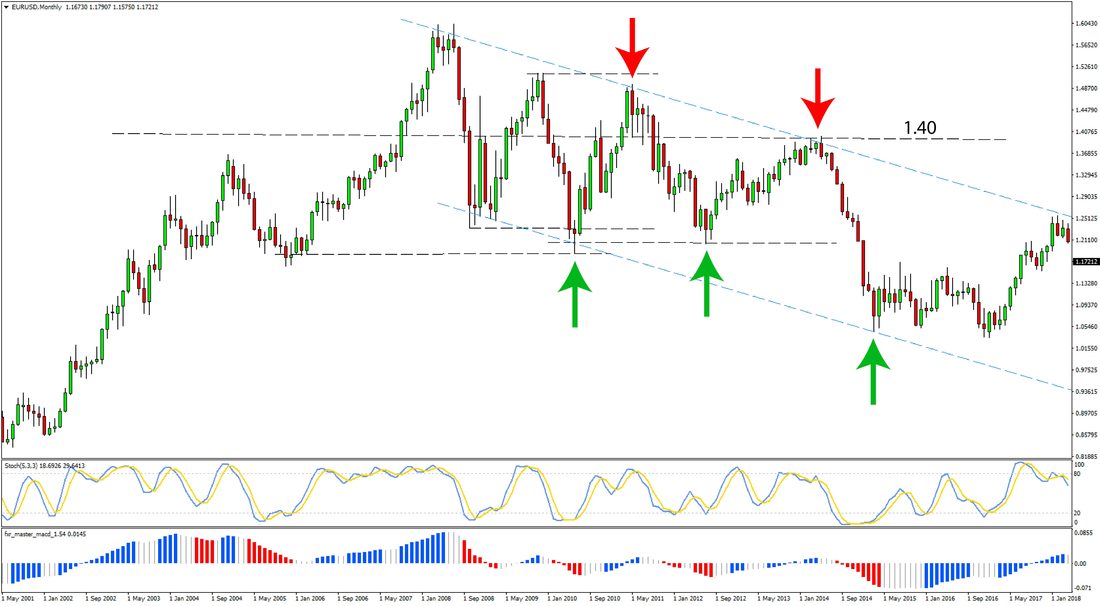
On the chart lower, we can see such trade examples on the monthly chart.

forex strategy monthly

Support and Resistance Forex Monthly Strategy

Horizontal lines indicate support and resistance levels, the significant 1.40 level is also shown on the chart. Green (up) and red (down) arrows indicate the long and short opportunities that existed – EURUSD Monthly chart
We can see several things on this monthly chart. The 1.40 level has been important for EURUSD on several occasions throughout the years. The pair topped and bottomed around this level multiple times as shown on the chart. Further, we can see that support and resistance hold up very well and when confirmed by indicators and patterns provided a number of good trading opportunities.

Trading techniques and indicators for the strategy:

The main idea with this strategy is to have an indicator that shows the trend and overbought oversold levels and use that together with the key support/resistance zones. Oversold overbought indicators also can show important areas where a consolidation or a reversal will start even without a support or resistance zone.

Big financial institutions and banks are trading based on these levels and indicators so high probability trades are generated. That’s why it’s important for any Forex trader to watch them and take note of any signals or patterns.

We are going to use the default MT4 Stochastic and the FxTR Master MACD indicators on the chart examples. The Master MACD can be download for free here.

Feel free to experiment with other indicators also. Only keep in mind to use a combination of a trend-showing indicator (Master MACD here) and an overbought/oversold momentum indicator (Stochastic here).

Regarding support and resistance, horizontal as well as trendline support/resistance zones are important. Also, turncoat support/resistance very often is a point of reversals and should also be watching and implemented in the strategy.

Trading conditions:

Long trade entry:

  • Identify where support zones exist on the monthly chart. That includes both horizontal support due to past lows/highs but also support due to falling or rising trendlines that connect several past lows or highs.
  • Look for a bullish signal to occur at the support zone. Either a bullish chart pattern or a bullish signal from the indicators.

Long trade stop loss:

  • Place stop below the low of the bullish pattern

Long trade exit and targets:

  • Place target at the next resistance higher
  • Or exit when overbought levels are reached on the indicators.

Here’s an example of a long trade taken on the monthly chart:

Forex monthly timeframe strategy signal

Support and Resistance Forex Monthly Strategy

The green up arrow indicates the long entry and the green down arrow indicates the exit. As can be seen on the chart, the exit was a resistance area and the Stochastic was in the overbought zone. The 100.00 level is also shown and how it was significant for USDJPY on multiple occasions over the years – USDJPY Monthly Chart
Short trade entry:

  • Determine the most important resistance zones on the monthly chart
  • Look for convergence of bearish signals at resistance
  • Enter once the above conditions are satisfied

Short trade stop loss:

  • Stop behind the top of the bearish pattern

Short trade exit and targets:

  • Target the next support down
  • An oversold signal on momentum indicators can also be a reason for an earlier exit

An example of a short trade is shown on the chart below.

Monthy chart trading strategy

Support and Resistance Forex Monthly Strategy

Green down arrow indicates short entry and green up arrow indicates the exit. The Stochastic and the Master MACD also confirm the trend change as can be seen on the chart – NZDUSD Monthly Chart

Keep in mind

  • Trades can last for a very long time since this is a strategy that is traded on the monthly chart. Thus it should be treated as such and the trader should be prepared and equipped both with capital and patience for trading the monthly chart.
  • A bigger deposit compared to trading the short-term charts will certainly be needed as stops will regularly be with a size of several hundred pips. The appropriate deposit can be calculated based on the maximum stop loss size and the position size (lots) intended to be traded.
  • Following the macro fundamentals and the main drivers behind large trends in the Fx market will also be helpful when trading large timeframes such as the monthly. There are plenty of resources and articles on the Fx Trading Revolution website that can help traders to understand and trade the fundamentals.
rfxsignals April 3, 2020 No Comments

Long-term Forex Trading Strategy Weekly Timeframe

Long-term Forex Trading Strategy Weekly Timeframe

The 50-week and the 200-week moving averages are some of the most important indicators that are always looked at by the pro traders. They act as support and resistance on the higher timeframes (most notably the daily, weekly and monthly) and crossovers between the two can also indicate major trend changes. This strategy is based on these two main principles related to the 50-period and the 200-week period averages and additionally uses the Stochastic Oscillator to determine potential trading opportunities.

Since it’s traded on the weekly chart, this strategy is of long-term nature which means that trades will not be generated frequently and trades need to be held for a longer period of time. You can expect trades to last anywhere between a few weeks and up to several months.

It’s fairly easy to trade this strategy and there is scope for a degree of subjectivity and additional tools/indicators to be used with it. The required alignment of the moving averages ensures that the trader is taking trades in the direction of the prevailing trend only and helps to filter out trading opportunities of better quality.

Below is an example of a trade generated with this strategy.

Forex Strategy Weekly Timeframe

Long-term Forex Trading Strategy Weekly Timeframe

Examples of long trades that were generated on the AUDUSD weekly chart – up and down arrows indicate entries and exits respectively, the numbers 1 and 2 indicate the 1st and 2nd profit exit points

Indicators to be used:

We are going to use 3 indicators as follows for this weekly timeframe Forex strategy:

  • 50-period simple moving average (SMA)
  • 200-period simple moving average (SMA)
  • Stochastic Oscillator

Trading conditions of the strategy:

Long trade entry:

  • Wait for the 50-week MA to cross above the 200-week MA
  • As long as the 50 SMA stays above the 200 SMA long trades can be taken as per the following two Stochastic criterions
  • Wait for a dip (retracement to the downside) and for the Stochastic to be in the oversold area
  • Buy the dip on a bullish pattern and a bullish crossover on Stochastic

Long trade stop loss:

  • Behind bullish pattern on the chart

Long trade exit and targets:

  • Target the 200-period or 50-period moving average to the upside
  • Or, if the price is already above the two moving averages, then hold the trade for as long as the signal doesn’t reverse – Stochastic makes a bearish crossover

Here are examples of long trades of this strategy:

Forex strategy weekly chart

Long-term Forex Trading Strategy Weekly Timeframe

Examples of long trades that were generated on the AUDUSD weekly chart – up and down arrows indicate entries and exits respectively, the numbers 1 and 2 indicate the 1st and 2nd profit exit points. Bullish crossover marked with the black circle.
Short trade entry:

  • Wait for the 50-week MA to cross below the 200-week MA
  • As long as the 50 SMA stays below the 200 SMA short trades can be taken as per the following two Stochastic criterions
  • Wait for a rally (retracement higher) and for the Stochastic to be in the oversold area
  • Sell the rally on a bearish pattern and bearish crossover on Stochastic

Short trade stop loss:

  • Behind bearish pattern on the chart

Short trade exit and targets:

  • Target the 200-period or 50-period moving average to the downside
  • Or, if the price is already below the two moving averages, then hold the trade for as long as the signal doesn’t reverse – Stochastic makes a bullish crossover

Here’s an example of several short trades that were generated on a daily chart of AUDJPY. This strategy is best used on the weekly chart but can be used successfully on other timeframes as well.

weekly trading strategy

Long-term Forex Trading Strategy Weekly Timeframe

AUDJPY Daily chart – Several profitable short trades were generated – Down arrows indicate sell entry and up arrows indicate the exits

General guidelines for the strategy:

  • Essentially, the principle of the strategy is to only take the Stochastic signals when they are in the direction of the larger market trend and only when the signals are in the same direction as the moving averages. That is we buy on the oversold Stochastic when the moving averages are bullish and we ignore bearish signals from the Stochastic. Conversely, we sell on the overbought Stochastic when the moving averages are bearish but no trades are taken on bullish signals from the Stochastic.
  • The reverse signals from the Stochastic, however, are used for taking profits if the price has surpassed the moving averages and there are no other distinct profit target levels on the chart.
  • A candlestick pattern or some other chart pattern confirming the stochastic signal is a great enhancement to any trading signal. Thus, whenever one occurs together with a signal from the Stochastic, it’s usually a much more solid signal than either one existing alone.
  • Being mindful of key support and resistance areas us always helpful, and especially on the weekly chart. Weekly support and resistance are normally significant levels that will almost surely produce a reaction in the market. So, although not required, aiming to align the trades with support and resistance levels will enhance the strategy even more.
rfxsignals April 3, 2020 No Comments

Overbought/Oversold Forex Daily Trading Strategy

Overbought/Oversold Forex Daily Trading Strategy

The daily timeframe gives an opportunity for longer-term traders to profit from the Forex market. The following strategy is to be used on the daily chart only, on which it can generate great trading opportunities and profits.

Since it is based on a relatively large timeframe, patience will be needed when trading this strategy as not many trades will be generated compared to trading strategies based on smaller timeframes. The advantage is that the strategy is very simple and almost anyone can use it to take trades and profit with it.

It consists of several simple rules which when followed will provide good trades and offer the potential for profit. It’s recommended to use it on the major pairs only because chart patterns work better due to the good liquidity and volume on these currency pairs. The strategy can be enhanced by combining it with other tools and indicators as we shall see later in this article.

Four trades that were generated by this strategy are shown on the chart below.

Forex Daily Chart Trading Strategy

Overbought/Oversold Forex Daily Trading Strategy

The vertical lines indicate the generated trades with this strategy from entry to exit (marked as “LONG” and “SHORT” on the chart) – EURUSD Daily Timeframe

Indicators to be used:

  • Bollinger Bands with standard settings (Blue lines on the chart) –Period – 20, Standard Deviation – 2

The Stochastic oscillator can also be used to get an additional perspective on the momentum in the market but is not necessary for this strategy. A “nice” bullish or bearish crossover from inside the oversold or overbought area on the Stochastic can be additional confirmation that a trade setup is a good opportunity to buy or sell.

Trading conditions of the strategy:

Long trade entry:

  • Wait for FxTR overbought/oversold indicator to fall in the oversold area and the line to turn green – this is an indication that buying opportunities will probably exist
  • Wait for price to be at the lower band of the Bollinger Bands indicator

Long trade stop loss:

  • Place the stop below the bullish reversal pattern

Long trade exit and targets:

  • 1st target – the middle line of the Bollinger Bands indicator
  • 2nd target – the opposite end of the Bollinger Bands indicator (upper line)

The chart below shows an example of a long trade taken with this Forex strategy

Forex strategy daily timeframe

Overbought/Oversold Forex Daily Trading Strategy

The two sections indicated by the vertical lines on the chart show two buy trades that were generated with this Forex strategy – GBPUSD Daily timeframe
Short trade entry:

  • Wait for FxTR overbought/oversold indicator to enter the overbought area and the line to turn red – indicating that we should look for bearish trading opportunities
  • Wait for price to be at the upper band of the Bollinger Bands indicator
  • Enter when a bearish candlestick pattern forms on the chart

Short trade stop loss:

  • Place the stop above the bearish reversal pattern

Short trade exit:

  • 1st target – the middle line of the Bollinger Bands indicator
  • 2nd target – the opposite end of the Bollinger Bands indicator (lower line)

Here’s an example of a short trade:

Picture

Overbought/Oversold Forex Daily Trading Strategy

The section between the two vertical lines show a sell trade generated by this strategy – USDJPY Daily Timeframe

Things to keep in mind when trading with this Forex strategy:

  • Since this strategy is based on the daily timeframe it will need relatively larger capital due to the usual size of the stops. This has to be taken into consideration from a risk management perspective.
  • During strong trends in the market, the price can take a path of “walking the bands”. This can occur either with the upper or lower Bollinger Band and essentially, the price doesn’t reverse even though it stays at the Bollinger Bands for several trading sessions in a row. Such situations can be the cause for unprofitable trades with this strategy, however, even in such cases of “waling the bands”, the probability that a reversal candlestick pattern will form during a strong trend is very low, so essentially this is the advantage of the strategy. Thus, when a reversal pattern does actually form at one of the Bands, it will likely be followed by at least a few more candles of consolidation if not a full reversal.
  • The Bollinger Band is a dynamic indicator, so this is an aspect that must be taken into account. That is, the distance to the profit targets will change with every new bar, so that means that the profit targets should be updated accordingly. Sometimes this may result in trades with very small to near breakeven profit or no profit at all. What is important, however, is that the signals generated with this strategy accurately predict tops and bottoms, so in most cases, the trades will offer nice profits.