The Stochastic Forex Scalping Trading Strategy will allow Forex traders to make incremental profits over short time frames. Over time, these small profits can add up to substantial amounts and can prove to be very lucrative for forex traders.
For this particular trading strategy, the timeframe that should be used is the 15-minute chart. It can also work well as a scalping strategy on the 1-minute and 5-minute timeframes. You may use any currency pair that you like for this strategy.
Chart Setup
It is important that you set up your charts right in order to get the best results from this trading strategy. You may choose any trading session that you desire to use, and it is recommended that you work with the 1-minute, 5-minute, and 15-minute charts.
We will be using MetaTrader4 Indicators for this setup. Here are the indicators to use:
- The Stochastic with the following parameters: slowing 16.0, %K 26.0, %D 18.0
- The 120 EMA (purple on the charts) and the 50 SMA (orange on the charts)
Below is what a buy trade strategy would look like:

15 Minute Stochastic Forex Scalping Trading Strategy
The first circle indicates the entry (buy) signal, while the second circle is the exit signal
Now it’s time to reveal the actual trading strategy:
The Buy Trading Strategy
Use the above chart to follow along. Proceed to buy only when both of the following conditions exist:
- A clear buy signal is if the fast blue line of the Stochastic Indicator crosses the slow red line to the upside from inside the oversold region (below 20 level on the Stochastic). It should break and remain above the oversold region (above 20). Once this condition has been satisfied, you should proceed to buy.
- Another buy signal is the existence of bullish pressure. This may be evidenced by the 50 SMA (orange line) crossing the blue line of the 120 EMA (purple line) to the upside.
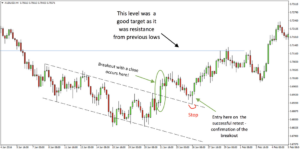
You should place your stop loss about 2 pips below the support level.
When to Sell
The following scenarios are indicators that you should sell:
- If the blue line of the Stochastic crosses the red line to the downside and from inside the area above the 80.00 level. It should break and remain below the 80.00 level on the Stochastic.
- Another sell indicator is if the 50 SMA (orange line), goes across the blue line of the 120 EMA (purple line) to the downside. This indicates that there is selling pressure in the market.

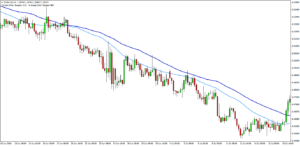
15 Minute Stochastic Forex Scalping Trading Strategy
Two short trade examples are shown here. Circles 1 and 3 are the entry (sell) signals and circles 2 and 4 are the exit signals
For a short trade, you should place your stop loss 2 pips above the resistance.
The Strategy for Exiting a Trade
If any of the following scenarios take place, you should exit the trade or take profit.
- When the blue line of the Stochastic crosses the red line from inside of the overbought region (exit signal for short trades) or the oversold region (exit signal for long trades).
- Another signal to exit the trade is if the 50 SMA indicator (orange line) crosses over the purple line of the 120 EMA from the bottom up during a bearish trend or from the top down during a bullish trend. This is an indication that the existing trend is losing strength. You should take profits and exit the trade at this point.