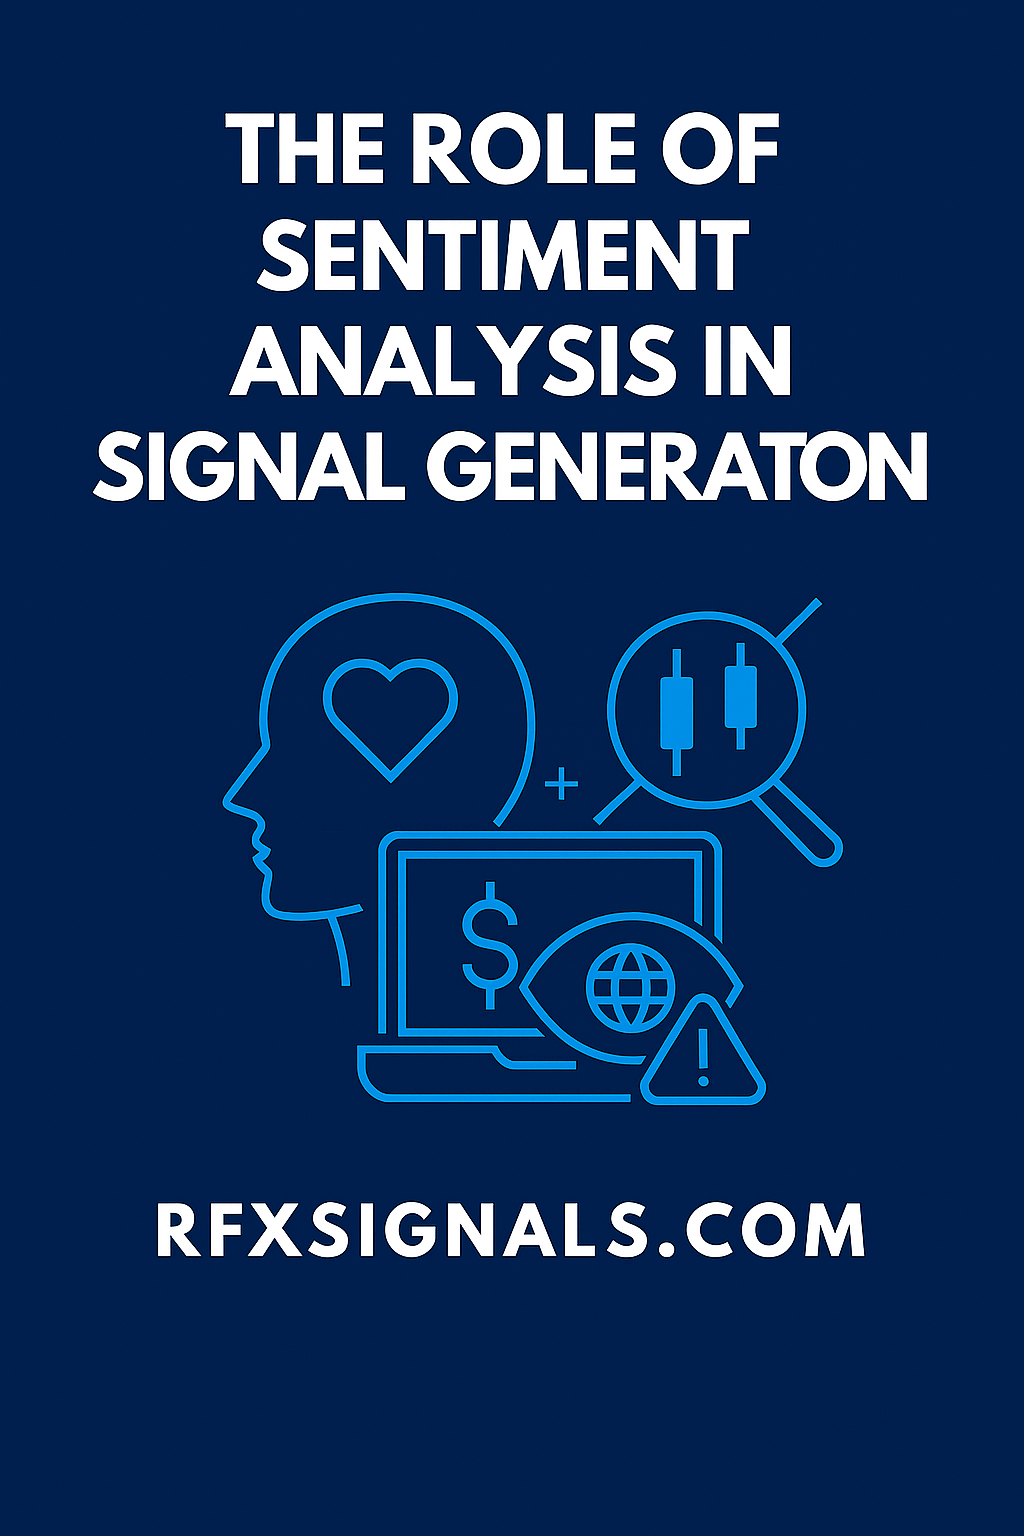
The Role of Sentiment Analysis in Signal Generation
By RTech RFX Signals ·
Sentiment — from news, social media, positioning and options markets — is a powerful input for trading signals when engineered properly. This guide explains what to use, how to convert it into features, how to backtest and how to avoid common pitfalls.
Why sentiment matters
Price reflects information and expectations — and sentiment is the market’s aggregated expectations, fear and greed. Quantifying sentiment gives you a view of crowd behaviour that complements price-based technical indicators and fundamental macro data. When used carefully, sentiment features can provide early warnings of momentum shifts, overextended positioning, or regime changes.
Sources of sentiment
Sentiment is not a single thing — it comes from multiple channels. The most useful sources for FX signal generation are:
- News sentiment: headlines, article tone and event coverage intensity (NFP, CPI, central bank minutes).
- Social sentiment: Twitter/X, Reddit, Telegram channel chatter and other public forums (volume, polarity, velocity).
- Positioning: Commitments of Traders (COT), broker aggregated positions and proprietary flow indicators.
- Options & derivatives: skew, implied volatility shifts, put/call ratios — these reveal hedging demand and tail risk pricing.
- Search & consumer signals: Google Trends spikes or search volume for terms like “buy EURUSD” can be supporting evidence.
Feature design — convert raw sentiment into trading inputs
Raw text or large tables are not directly useful for backtests. Convert them into normalized, time-aligned features:
1. Sentiment polarity and intensity
Use NLP (lexicon + transformer-based classifiers) to assign polarity scores (−1 to +1) and an intensity/confidence metric. Aggregate at chosen timeframes (e.g., 5-minute, hourly, daily).
2. Volume & velocity
A sudden spike in mentions (velocity) often matters more than the average polarity. Create features for mention volume, rolling z-score of volume, and cross-source corroboration (news + social spike).
3. Event flags and surprise scores
For macro events, derive surprise scores: actual − consensus (e.g., CPI surprise). Use both signed surprise and absolute surprise as features — the former suggests direction, the latter suggests volatility.
4. Positioning imbalance
Convert COT or broker flows into net positioning ratios and percentile ranks (where does current net long/short sit relative to the last N years?). Extremes often precede mean reversion.
5. Options-derived signals
Track changes in implied volatility, skew, and large block implied moves. Rapid increases in IV before scheduled events can indicate elevated tail-risk pricing.
Signal construction patterns
There are several robust ways to combine sentiment with price data:
Filter signals
Use sentiment as a filter: only take a technical breakout if sentiment polarity and volume confirm the move. This reduces false breakouts triggered by noise.
Contrarian signals
Extreme bullish social sentiment combined with crowded long positioning can be a contrarian sell signal — especially when sentiment is unanimous and lacks nuance.
Momentum augmenters
Use positive sentiment velocity to increase sizing on momentum trades; reduce size when sentiment turns flat or negative.
Event-driven overlays
Around macro events, use sentiment + surprise to determine trade posture: if a rate decision surprises together with positive news and positive social sentiment, bias long in the short-window trade.
Backtesting sentiment-based signals — special care
Sentiment backtests require careful engineering to avoid look-ahead bias and survivorship pitfalls:
- Time alignment: ensure your sentiment timestamps reflect when information would be available (publish time, not crawl time).
- Data persistence: keep historical snapshots — social platforms allow edits and deletions; news articles can be updated.
- Latency modelling: include ingestion latency. If you only receive social feeds with a 30s delay, simulate this delay in backtests.
- Out-of-sample testing: use rolling walk-forward validation because sentiment regimes change (e.g., pre- and post-a regulatory event).
- Pre-commitment: document your feature pipeline and refrain from heavy post-hoc feature engineering on the whole dataset.
Evaluation metrics that matter
Standard ML metrics are useful, but in trading focus on money metrics:
- Net P&L after transaction costs and slippage
- Sharpe / Sortino ratio
- Max drawdown and time-to-recover
- Signal latency impact on fill price (simulate slippage)
- Consistency of performance across regimes (stress tests)
Common pitfalls & how to avoid them
Many developers trip on the same traps:
- Echo-chamber bias: relying on a single social platform that reflects retail chatter only; always corroborate across sources.
- Overfitting lexicons: building a tone classifier tailored to historical jargon that doesn’t generalize.
- Positioning data gaps: treating incomplete COT data as complete — always check coverage and reporting lag.
- Ignoring non-stationarity: sentiment meaning can change (e.g., memes vs. serious news); monitor feature drift.
Practical workflow example
A practical pipeline might look like this:
- Collect feeds: news wires, curated Twitter stream, COT reports, options chain snapshots.
- Preprocess: deduplicate, timestamp normalize, filter by language and region.
- Score: NLP polarity + confidence, volume z-scores, surprise calculations, positioning percentiles.
- Fuse: combine sentiment scores with technical indicators into a composite signal with weights or a trained model.
- Backtest: time-aware validation with latency and cost models.
- Deploy: run in demo mode first, monitor feature drift and live fills, and set retraining cadence based on performance decay.
Case study (illustrative)
In backtests, a EURUSD strategy that required both a 1-hour RSI confirmation and a positive news polarity spike within the prior 60 minutes reduced false breakouts by ~30% and improved net P&L after costs versus the technical-only variant. The tradeoff was fewer signals — but better quality and lower drawdown.
Conclusion — sentiment amplifies but rarely replaces
Sentiment analysis is a powerful amplifier when combined with price and fundamental data: it helps filter low-probability signals, detect crowd extremes, and gauge event impact. But it’s an input, not a silver bullet. Robust pipelines, careful backtesting, latency modelling and continuous monitoring are essential. Start small, test in realistic demo conditions, and treat sentiment as one pillar of a multi-faceted signal generation system.
Want our sentiment starter pack?
Download sample sentiment features, demo notebooks and a timestamped feed template to accelerate your testing.
Further reading (authoritative outbound links)
For NLP and financial text analysis background, reputable resources include arXiv, Investopedia, and practical tutorials from libraries like Hugging Face and Stanford NLP.