
Triangles are chart patterns that most of the time form in sideways markets as part of the consolidative process. Although triangles tend to be broken in the direction of the previous trend (if there is a strong prior trend), it’s not a definitive rule and triangle breakouts can occur in either direction. In technical analysis there are 3 types of triangle patterns and trading each of the triangle patterns is similar, although there are some subtle differences between them. |  |
Symmetrical triangle
It forms when a rising support trendline and a falling resistance trendline converge into one another, hence price action gets squeezed into a tighter and tighter space awaiting a breakout.
As with most corrective patterns, price action inside of the symmetrical triangle tends to be choppy and highly unpredictable.
- Because it is a continuation pattern it can be a valid strategy to take a trade in the direction of the prior trend before the breakout of a symmetrical triangle occurs. But remember that this is a riskier strategy and appropriate protective measures should be taken such as a stop loss behind a key nearby technical level.
- Waiting for the triangle to break in the direction of the trend is the classic way to trade this formation and it does have a higher rate of success. However, the downside of this approach is of course that you get to enter much later (at a worse price) and potentially give away a large portion of the profit.
- If for some reason the symmetrical triangle is broken in the counter-trend direction then no trade should be taken.

The Triangle Pattern Forex Trading System
- If the trade has been initiated using the first approach (before the breakout occurs) then the stop loss should be placed a few pips behind the appropriate trendline (the upper falling trendline in a short trade and the bottom rising trendline in case of a long trade).
- When trading the breakout stop-loss should be placed behind most recent swing high (in a downtrend) or swing low (in an uptrend).
Managing the trade:
- Since the symmetrical triangle most often appears during trends, it is wise to utilize some kind of a trend-following strategy to manage the trade, like using a trailing stop.
- If price returns back inside of the triangle after it broke out it means that it’s a fake breakout and the trade should be closed when this happens.
Profit targets:
- Measure the height of the triangle at its starting point and project it from the breakout point to the right of the chart (from the breakout point).
- Already existing important support and resistance levels must be taken into account for managing the trade and determining profit targets.
Ascending triangle
It can be a sign of continuation in an uptrend, but it’s very unlikely to form as a consolidation during a downtrend. In fact, in a downtrend, it will more likely signal the onset of a reversal and the start of a new bull trend.
Statistically, most of the time price breaks out of ascending triangles to the upside, though as anything in trading it’s not a definite rule and protective measures like stop loss orders should always be taken.
Entry rules:
- Identify an ascending triangle formation as described earlier.
- Wait for price to break out of the triangle.
- Enter when the candle closes outside of the triangle in a so-called “breakout on a close”.
In our example of the ascending triangle on the EURGBP 4 hour chart, the pattern appeared at the beginning of an uptrend. After the breakout, the price reached the first target (the width of the triangle) then paused before resuming the trend to reach the second target (2x the width of the triangle).

The Triangle Pattern Forex Trading System
- behind the most recent swing high (in a bearish breakout) or
- behind the most recent swing low (in a bullish breakout)
Managing the trade:
- If price returns back inside of the triangle the trade should be closed.
- If price struggles to reach the target for a prolonged period of time, then it’s prudent to fully or partially close the position.
Profit targets:
- 1st target – Measure the height of triangle and project it to the right on the chart (from the breakout point).
- 2nd target – 2x the height of the triangle.
As with any trading strategy, it’s crucial to be aware of key support and resistance levels on higher timeframes and make sure that no such obstacles lie ahead of the targets.
Descending triangle
The price will most of the times break a descending triangle to the downside. This is mainly due to the selling pressure that tries to penetrate the horizontal support several times until it’s finally stronger and cracks it.
However, as we’ve said other times that is not always the case and descending triangles can be just as easily broken to the upside.
Entry rules:
- Identify a descending triangle formation as described earlier.
- Wait for price to break out of the triangle.
- Enter when the trading period closes outside of the triangle in a so-called “breakout on a close”.
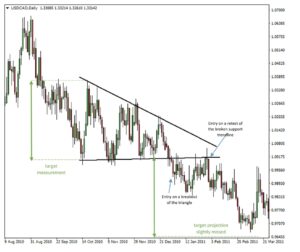
In the following example on the USDCAD daily chart, price broke the descending triangle to the downside as is the case most of the time with descending triangles. However, instead of plunging down immediately price returned to the broken support trendline and “retested” it from below. This is not an uncommon scenario and it’s a great opportunity to enter the trade at a much more attractive price.
- behind the most recent swing high (in a bearish breakout) or
- behind the most recent swing low (in a bullish breakout)
Managing the trade:
- If price returns back inside of the triangle the trade should be closed.
- If price struggles to reach the target for a prolonged period of time, then it’s prudent to fully or partially close the position.
Profit targets:
- 1st target – Measure the height of triangle and project it to the right on the chart (from the breakout point).
- 2nd target – 2x the height of the triangle.
If there is a strong support or resistance level on the way to the target, the price might reverse even before reaching it. This is why it’s very important to make sure that there are no such obstacles in the way.