|
Trading chart patterns is about profiting from repeated occurrences in the markets that are known to yield a certain kind of results over and over again.
As with anything in technical analysis, it’s always good to combine chart patterns with other tools like support and resistance to filter out the best setups. The flag and the wedge are two very popular chart patterns among traders, and they both have their bullish and bearish versions. |

|
Continuation Pattern: The Flag
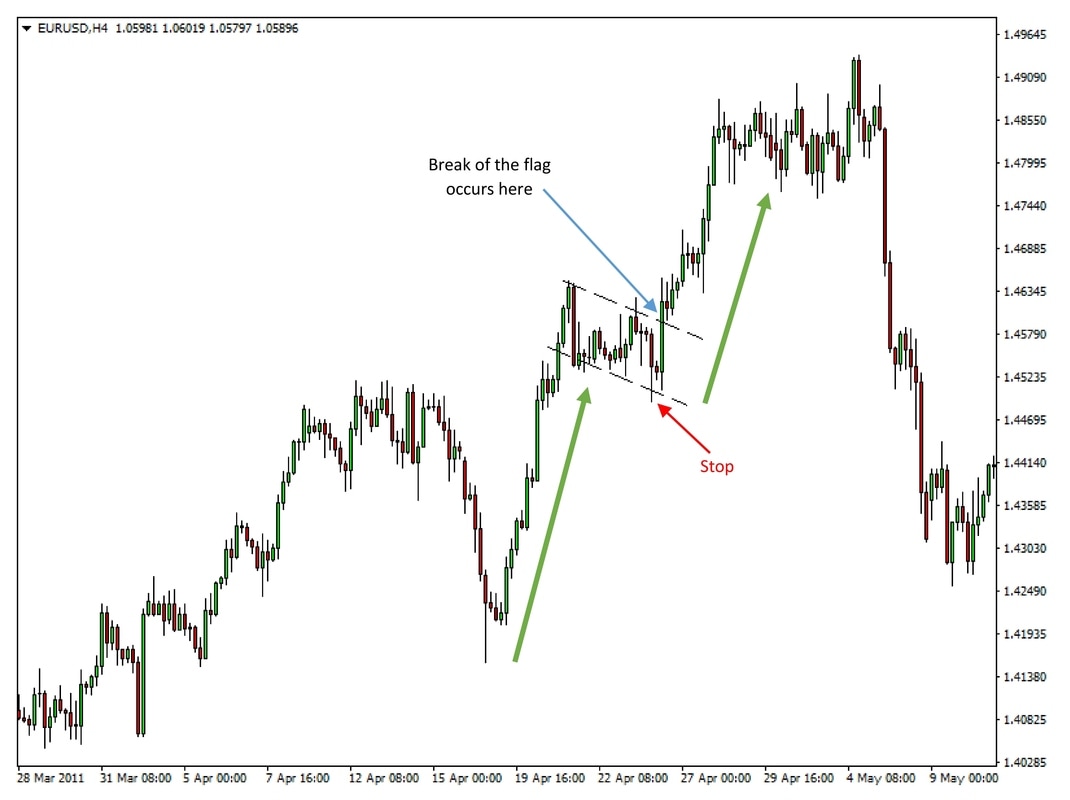
The flag is a formation on the charts with two horizontal or rising parallel trendlines in a bearish flag, and two falling or horizontal parallel trendlines in a bullish flag.
A falling flag (bullish) occurs during an uptrend and a rising flag (bearish) will occur during a downtrend.
Flags will usually form after a sharp move in the market and most often because of overbought or oversold levels. With the flag formation the market sort of digests the previous sharp move and is ready to continue the trend for another swing.
The breakout of the flag is our signal to join the trend and enter a trade.
- Find a strong trending swing on the chart.
- Identify a flag (as shown on the chart) and wait for a breakout of the flag in the direction of the preceding trend.
- After the breakout occurs enter a trade in the direction of the previous trend.
- Do not enter if price breaks out in the opposite direction. In such cases, it’s better to stand aside and don’t trade.
- behind the last swing high (in a bearish flag) or
- behind the last swing low (in a bullish flag).
- If price returns inside of the flag after breaking out then the whole trade idea would become invalid and the trade should be closed.
- After price moves in your favor by the amount of the stop loss, move the stop to breakeven.

Trading the Flag and the Wedge Chart Patterns
To calculate profit targets measure the height of the most recent previous swing in the direction of the trend
- First target is 1x the height of the swing
- Second target is 2x the height of the swing
- Third extended target is 3x the height of the swing
Note: If present, important support or resistance levels (especially from higher timeframes) on the way of the trade should be viewed as targets themselves.
Reversal pattern: The Wedge
The wedge is a formation on the charts with two rising trendlines in a rising wedge and two falling trendlines in a falling wedge.
A rising wedge forms in uptrends and is a signal of a bearish reversal, while a falling wedge forms during downtrends and signals that a rebound in prices is likely to occur soon.
So, the trend still continues in a wedge formation however at a slower rate. The trendlines that limit the price swings in a wedge are sloped in the same direction (up or down) and contract into one another hence leading to choppy price action inside of the wedge.
Most often the reason for a wedge forming is an exhaustion of the trend, an oversold or overbought market and change in underlying market sentiment. Volatility will also tend to drop in wedge before expanding again when the price breaks out of the wedge.
How to trade it?
Entry rules:
- Identify a wedge (as shown on the chart) and wait for a breakout of the wedge in the counter-trend direction.
- After the breakout occurs we can enter a trade either on a close outside of the wedge or simply open a trade at the market price as soon as the price breaks out.
- Keep in mind though, the second tactic is riskier!
- Note: It’s also a good idea to keep check of the fundamentals when the breakout occurs. Try to find out why the breakout happened and if a major shift in fundamentals caused it. This can help you avoid fakeouts which happen quite often in the Forex market.

Trading the Flag and the Wedge Chart Patterns
Initial stop placement:
- behind the last swing high (in a bearish rising wedge) or
- behind the last swing low (in a bullish falling wedge).

Trading the Flag and the Wedge Chart Patterns
- If price returns inside of the wedge after breaking out then the trade scenario of a wedge would become invalid and the trade should be closed.
- After price moves in your favor by the amount of the stop loss, move the stop to breakeven.
Profit targets:
To calculate profit targets measure the width of the wedge at its starting point
- The first target is 1x the width of the wedge
- The second target is 2x the width of the wedge
- The third extended target is 3x the width of the wedge
Note: If present, important support or resistance levels (especially from higher timeframes) on the way of the trade should be viewed as targets themselves.