
Sthree Sakthi (SS-160) 04/06/2019

DAILY FREE FOREX SIGNALS FOR 07-06-2019 сигнал форекс ежедневно
GBPUSD BUY -1.27372
SL-1.26759
TP1-1.27561
EURUSD BUY -1.13159
SL-1.12728
TP1-1.13405
TP2-1.13646
USDJPY SELL-108.130
SL-108.550
TP1-107.952
TP2-107.761
USDCHF SELL-0.98833
SL-0.99367
TP1-0.98504
TP2-0.98136
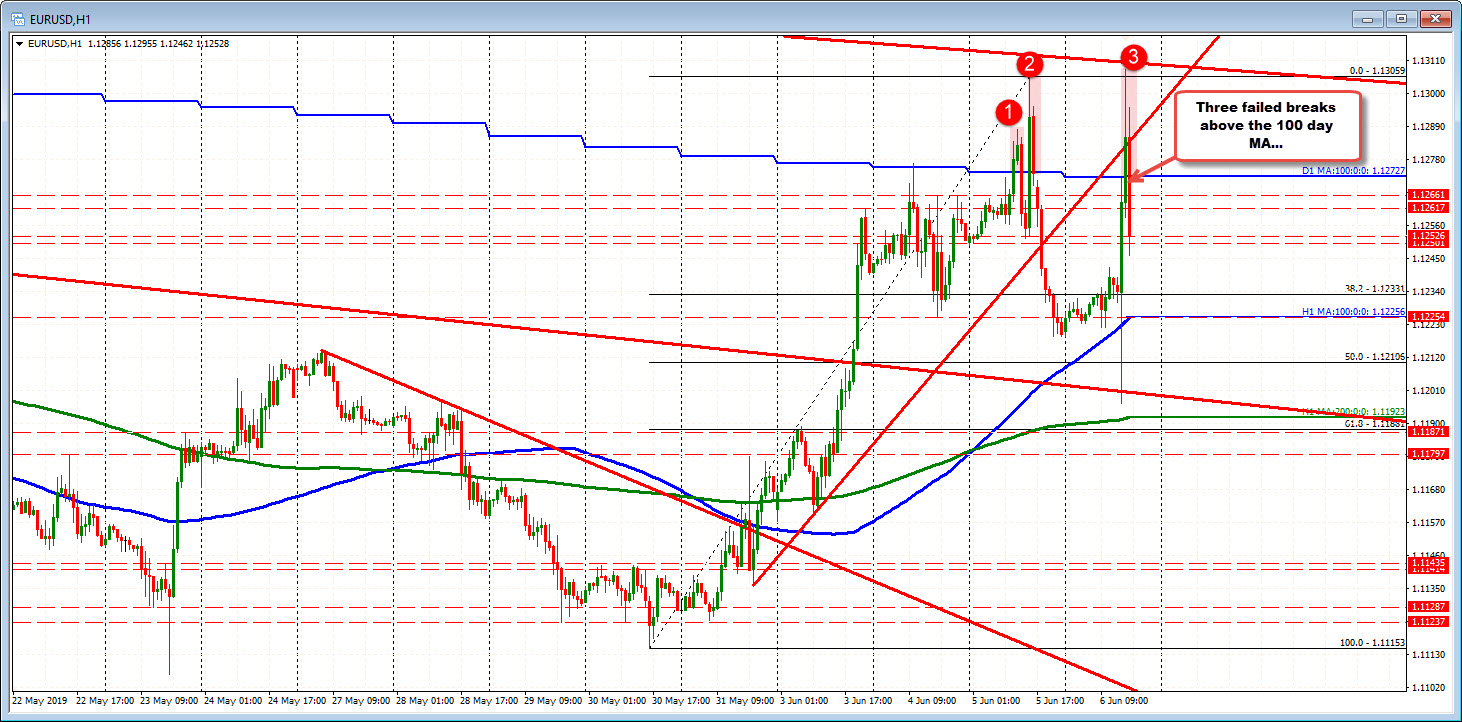
EURUSD backs off as markets digest Draghi
Another failed run above the 100 day MA?
The EURUSD moved above the 100 day MA on disappointment that the TLTRO rate was not as low as it could have been (I guess). However, comments in the presser had a little for bulls, but also bears.
The price is digesting the comments and have now moved back below the 100 day MA (again). Recall yesterday, there were two runs above, but each failed.
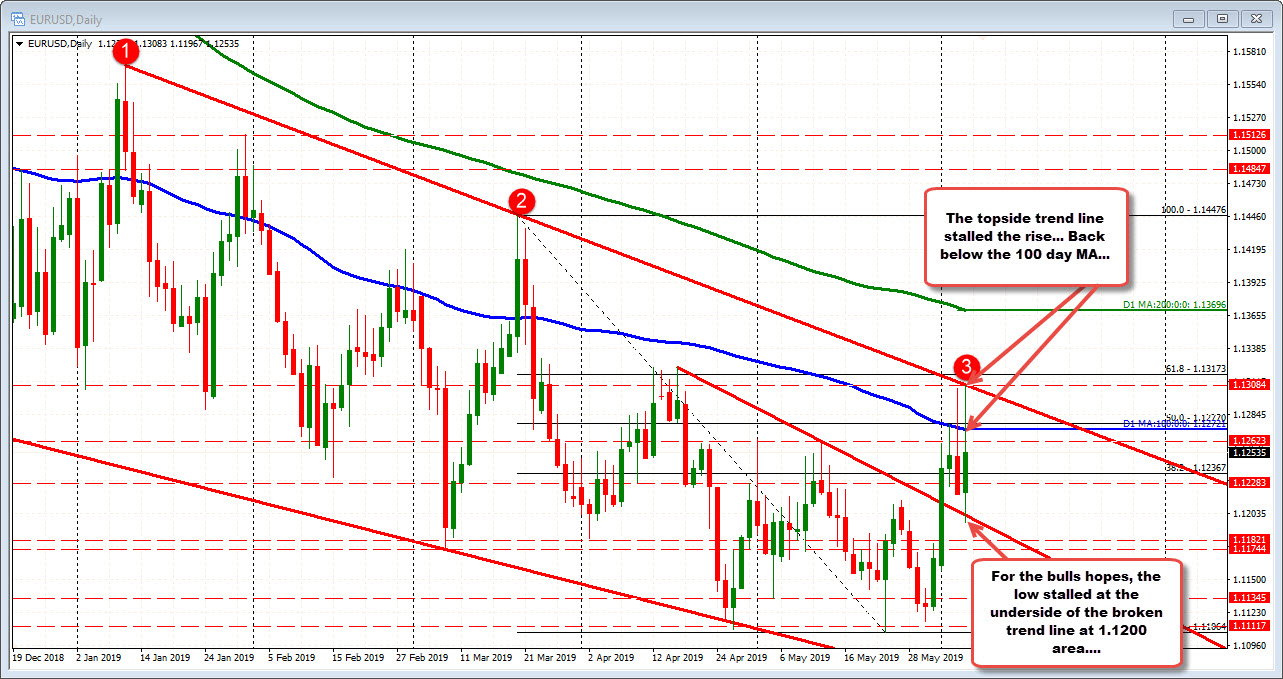
On the daily chart, the pair also tested a topside trend line and that line held at 1.1308 area (see chart below).
The stall at the trend line. The fall back below the 100 day MA are both bearish. Until the price action can get – and stay above – the 100 day MA AND break that trend line after that, can the buyers be taking control? No. Sellers are still in control.
The couple things working in the buyers favor is that the market is short EUR. That could lead to a squeeze higher. Also, USD may weaken too on expectations of Fed easing.
Also technically, the low today did test the underside of a broken trend line at 1.1202 (call it 1.1200 -see daily chart). So there is some hope that buyers hold that 1.1200 area (risk for bulls), and the 100 day MA is broken for good (or at least for a little while).

DAILY FREE FOREX SIGNALS FOR 06-06-2019 сигнал форекс ежедневно
EURUSD SELL-1.12225
SL-1.12569
TP1-1.12053
TP2-1.11906
GBPUSD SELL-1.26678
SL-1.27168
TP1-1.26480
TP2-1.26259
USDJPY SELL-108.184
SL-108.640
TP1-107.971
TP2-107.719
NZDUSD SELL-0.66257
SL-0.66607
TP1-0.66091
TP2-0.65907
GBPCHF SELL-1.25999
SL-1.26313
TP1-1.25810
TP2-1.25623
EURAUD SELL-1.61006
SL-1.61358
TP1-1.60825
TP2-1.60643
NZDJPY SELL-71.700
SL-72.095
TP1-71.516
TP2-71.250
EURCAD SELL-1.50564
SL-1.50857
TP1-1.50393
TP2-1.50207
GBPAUD SELL-1.81812
SL-1.82215
TP1-1.81563
TP2-1.81326
GBPCAD SELL-1.70074
SL-1.70387
TP1-1.69883
TP2-1.69651
cryptocurrency #bitcoin #news #fx #education
business #today #btc #blockchain #ethereum #ico
love #tech #rating #oil #daytrading #rfxsignals
DDay75thAnniversary
Euro Year-long Trend Nearing Decision Point
The long slow bearish channel in the euro is getting close to breakout decision, notes Al Brooks.
The EURUSD currency pair has been in a bear channel for a year. Protracted bear channels often end with a sharp break below the channel and then a reversal up. There is no sign yet that the pattern of two- to three-week rallies and two- to three-week selloffs is about to end.
The EURUSD weekly chart has been forming lower highs and lows for a year. This is a bear channel and there is no sign that it is about to end. Consequently, traders continue to buy reversals up from every new low and sell reversals down from rallies to above the 20-day exponential moving average. The legs up and down have lasted two to three weeks.
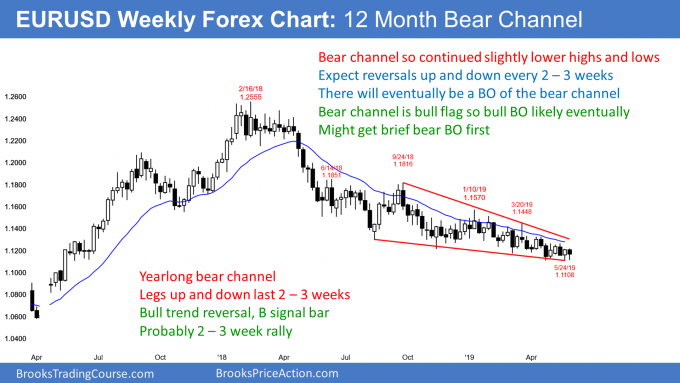
The daily chart has been in a tight trading range for a month. Every trading range has both buy and sell setups. The bears have a double top with the May 1 and May 13 highs. The bulls have a double bottom with the April 26 and May 23 low.
Because the chart is now near the 52-week low, traders are expecting a reversal up. The reversal can come from above or below the May 23 low. But, a two- to three-week reversal up is more likely that a strong break below the May low.
Possible sell climax below yearlong bear channel
When a bear channel lasts a long time, it often ends with a sell climax. There can be a strong break below the bear channel, but 75% of the time, a bear break below a bear channel reverses up within five bars.
Five bars, but on what time frame? It is the highest time frame that shows the channel. That is the weekly chart.
If traders see a strong selloff over the next few weeks that breaks strongly below the 52-week low and the bear channel, they should be ready for a reversal up. If there is a reversal up, it usually leads to a swing up. The minimum goal would be 10 bars and two legs. It could last longer and go much higher.
Since the weekly chart is in a Spike and Channel bear trend, traders will expect a reversal up to test the start of the bear channel. That is the June 14, 2018 high of 1.1851. Since that is far above, any rally would take many months to get there.
Bear channels usually evolve into trading ranges. Therefore, even if the bulls get a strong reversal up, it will probably be a bull leg in a trading range that will last a year or more.
Trading Room


kerala lottery result -POURNAMI (RN-394)- 02/06/2019
KERALA STATE LOTTERIES – RESULT
www.keralalotteries.com PHONE:- DIRECTOR OFFICE FAX
www.kerala.gov.in 0471-2305230 0471-2305193 0471-2301740
POURNAMI LOTTERY NO. RN-394th DRAW held on 02/06/2019 AT GORKYBHAVAN NEAR BAKERY
JUNCTION, THIRUVANANTHAPURAM
1st Prize- Rs :7,000,000/- RY 360244 (KASARGODE)
Consolation Prize- Rs. 8,000/- RN 360244 RO 360244 RP 360244 RR 360244
RS 360244 RT 360244 RU 360244 RV 360244
RW 360244 RX 360244 RZ 360244
2nd Prize- Rs :500,000/- RR 299912 (MALAPPURAM)
3rd Prize- Rs :200,000/- RN 600012 (ERNAKULAM)
FOR THE TICKETS ENDING WITH THE FOLLOWING NUMBERS
4th Prize- Rs. 5,000/- 0140 0601 1846 3241 5434
5464 5481 5738 7272 7538
8920 9260
5th Prize- Rs. 2,000/- 1007 1426 2273 3560 8654
9378 9479
6th Prize- Rs. 1,000/- 0196 1553 1880 2011 2921
3141 3335 3871 3952 4558
4873 5180 6325 6518 6819
7059 7398 7425 7986 8354
8999 9142 9168 9214 9251
9765
7th Prize- Rs. 500/- 0061 0092 0142 0220 0887
0911 0941 1002 1220 1327
1494 1569 1949 2225 2251
2271 2406 2623 2722 2831
2844 3280 3386 3462 3600
3807 4364 4410 5000 5296
5344 5502 6104 7343 7384
8055 8442 8624 9024 9112
9668 9954
8th Prize- Rs. 100/- 0075 0094 0128 0163 0260
0434 0485 0534 0662 0714
0726 0832 0848 0850 0889
0926 1473 1897 1927 1935
2080 2086 2193 2203 2285
2333 2336 2546 2690 2733
2739 2835 2855 2861 2906
3034 3069 3071 3079 3152
3260 3429 3499 3518 3555
3608 3761 3820 3980 4087
4146 4278 4289 4533 4757
4781 4935 4984 5085 5159
5216 5342 5433 5468 5556
5577 5623 5710 5899 5951
5957 5977 6175 6374 6420
6429 6472 6504 6563 6672
7018 7249 7291 7315 7374
7452 7501 7679 7697 7713
7823 8565 8653 8707 8894
9088 9206 9515 9524 9584
9675 9784 9878 9902
The prize winners are advised to verify the winning numbers with the results published in the Kerala Government
Gazatte and surrender the winning tickets within 30 days.
Next POURNAMI Lottery Draw will be held on 09/06/2019 at GORKY
BHAVAN NEAR BAKERY JUNCTION THIRUVANANTHAPURAM
Sd/-
T.A PADMAKUMAR
Deputy Director
Directorate Of State Lotteries , Vikas Bhavan,tvm

DAILY FREE FOREX SIGNALS FOR 04-06-2019 сигнал форекс ежедневно
NZDUSD SELL-0.65851
SL-0.66257
TP1-0.65692
TP2-0.65528
GBPUSD SELL-1.26648
SL-1.26953
TP1-1.26453
TP2-1.26260
NZDJPY SELL-71.055
SL-71.410
TP1-70.844
TP2-70.617
GOLD SELL-1323.45
SL-1329.79
TP1-1320.87
TP2-1317.65
GBPAUD SELL-1.81428
SL-1.81812
TP1-1.81209
TP2-1.80945
GBPCAD SELL-1.69968
SL-1.70387
TP1-1.69729
TP2-1.69439
GBPNZD SELL-1.92014
SL-1.92436
TP1-1.91776
TP2-1.91537
GBPJPY SELL-136.675
SL-137.019
TP1-136.518
TP2-136.381
GBPCHF SELL-1.25613
SL-1.25999
TP1-1.25432
TP2-1.25212
USDJPY BUY -108.084
SL-107.719
TP1-108.312
TP2-108.530
USDCHF BUY -0.99377
SL-0.99054
TP1-0.99604
TP2-0.99847
EidMubarak
HayırlıBayramlar
ByJinIsComing #cryptocurrency #bitcoin #news #fx #education
business #today #btc #blockchain #ethereum #ico
love #tech #rating #oil #daytrading #rfxsignals
Fibonacci Retracements Analysis 04.06.2019 (GOLD, USDCHF)
Fibonacci Retracements Analysis 04.06.2019 (GOLD, USDCHF)
03.06.2019
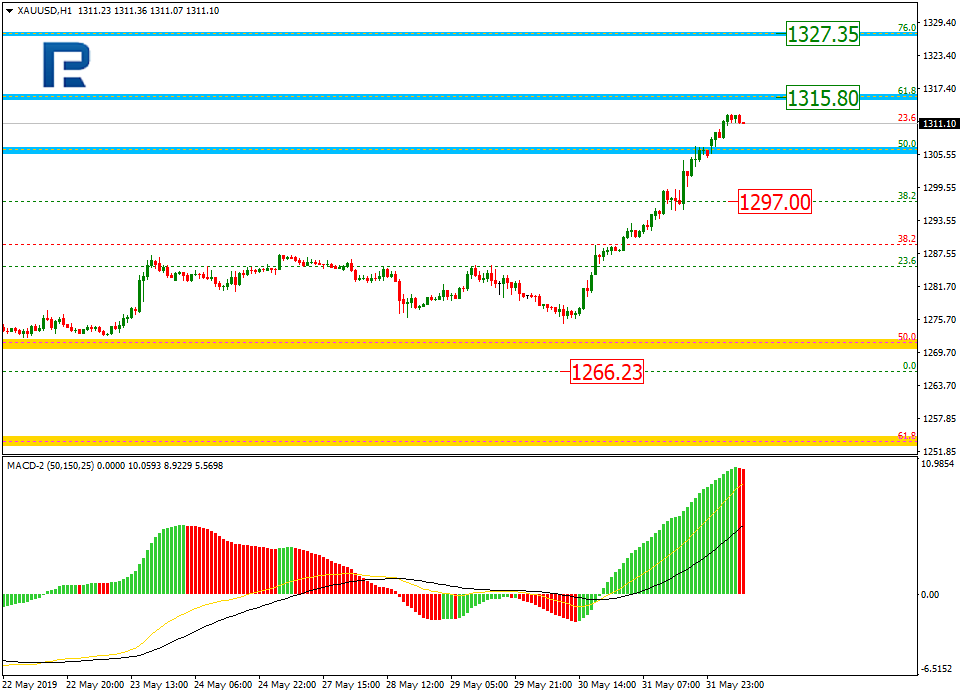
XAUUSD, “Gold vs US Dollar”
As we can see in the H4 chart, the pair is quickly trading upwards to update the high at 1346.68. Right now, XAUUSD is getting closer to the retracements of 61.8% at 1315.80.the next upside target may be the retracement of 76.0% at 1327.35. The support is at 1266.23.
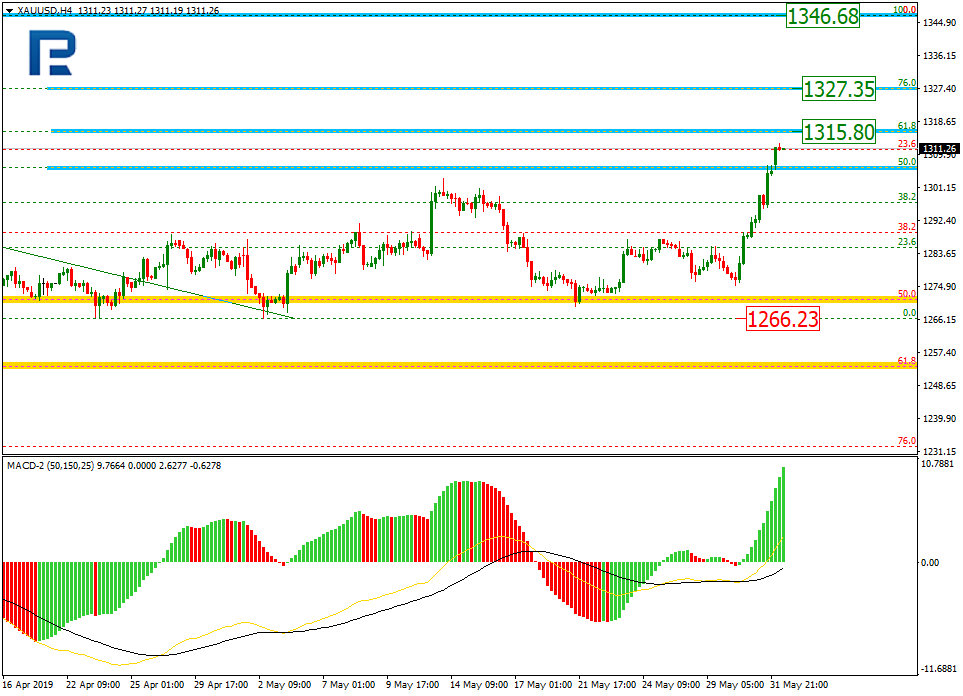

In the H1 chart, the pair is rising steadily. The closest target is the retracement of 61.8% at 1315.80. The support level is the retracement of 38.2% at 1297.00.
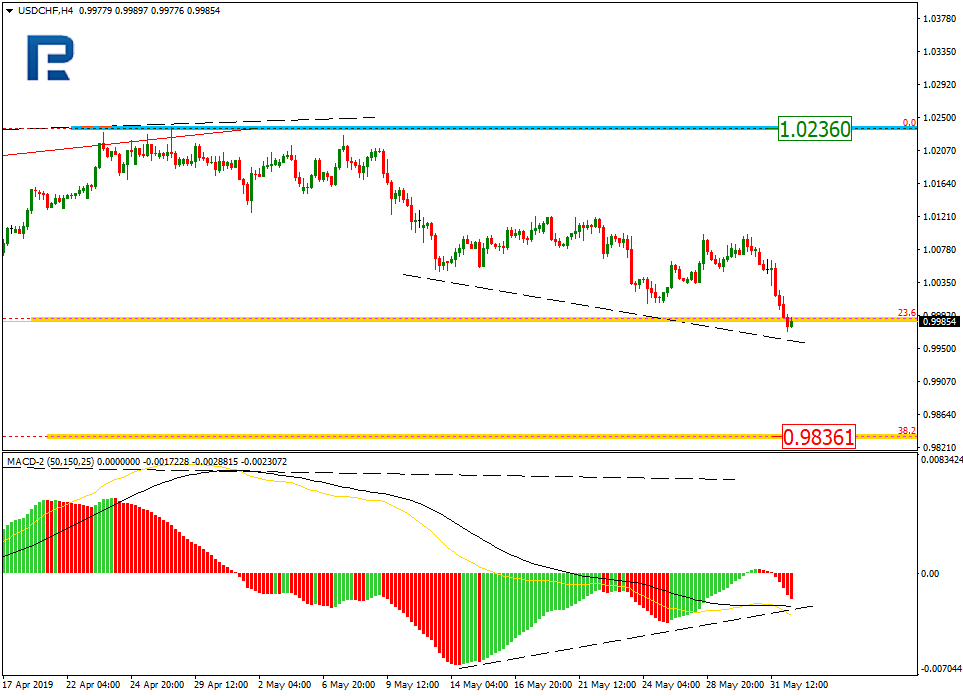
USDCHF, “US Dollar vs Swiss Franc”
In case of the USDCHF, the after reaching the long-term retracement of 23.6%, USDCHF is trading close to 1.0000. The next downside target may be the retracement of 38.2% at 0.9836. At the same time, there is a convergence on MACD, which may indicate a possible pullback.
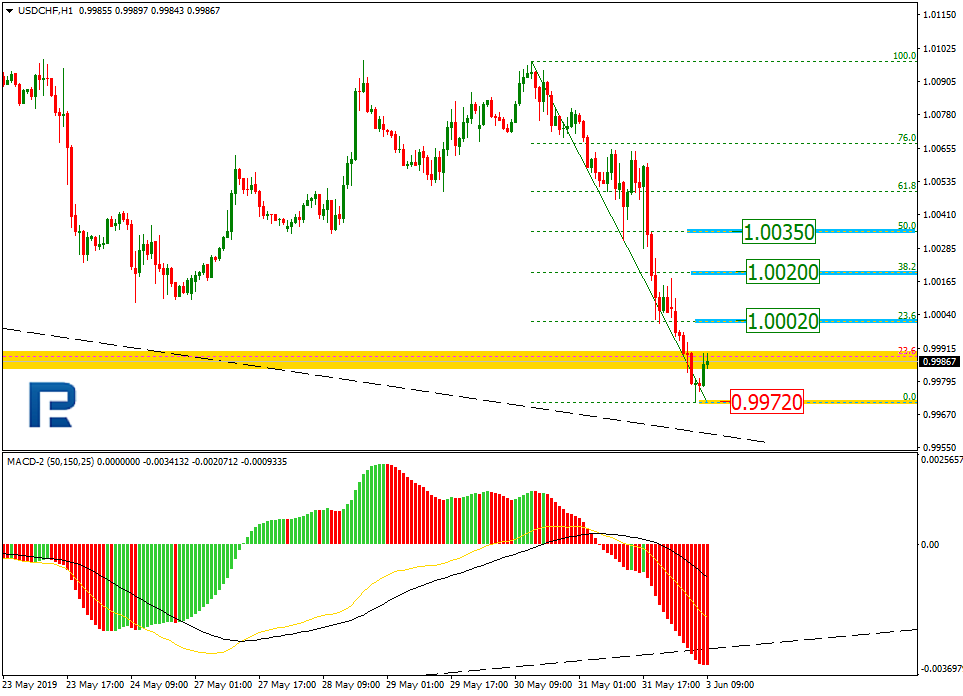
In the H1 chart, the pair is starting a new short-term rising correction. The upside targets may be the retracements of 23.6%, 38.2%, and 50.0% at 1.0002, 1.0020, and 1.0035 respectively. The local support is the low at 0.9972.

DAILY FREE FOREX SIGNALS FOR 03-06-2019 сигнал форекс ежедневно
GBPAUD SELL-1.82054
SL-1.82519
TP1-1.81812
TP2-1.81581
GBPNZD SELL-1.92967
SL-1.93377
TP1-1.92717
TP2-1.92481
EURNZD SELL-1.70408
SL-1.70707
TP1-1.70233
TP2-1.70040
AUDNZD SELL-1.05954
SL-1.06300
TP1-1.05629
EURAUD SELL-1.60737
SL-1.61168
TP1-1.60563
TP2-1.60377
CADJPY SELL-80.035
SL-80.496
TP1-79.835
TP2-79.596
NZDJPY BUY -70.960
SL-70.617
TP1-71.133
TP2-71.343
GBPUSD SELL-1.26384
SL-1.26766
TP1-1.26189