Fibonacci Retracements Analysis 03.10.2019 (AUDUSD, USDCAD)

03.10.2019

AUDUSD, “Australian Dollar vs US Dollar”

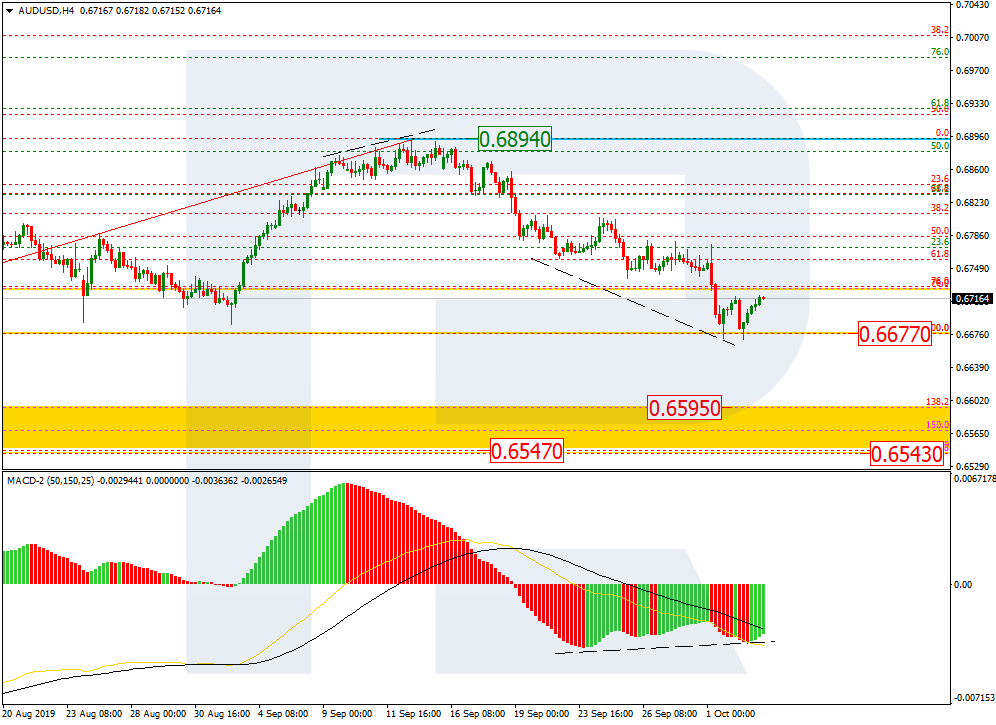
As we can see in the H4 chart, the descending wave tested the mid-term low at 0.6677 and then there was a convergence, which may indicate a new pullback in the nearest future. After the pullback, the price may continue falling towards the post-correctional extension area between 138.2% and 161.8% fibo at 0.6595 and 0.6543 respectively.

AUDUSD_H4
Risk Warning: the result of previous trading operations do not guarantee the same results in the future

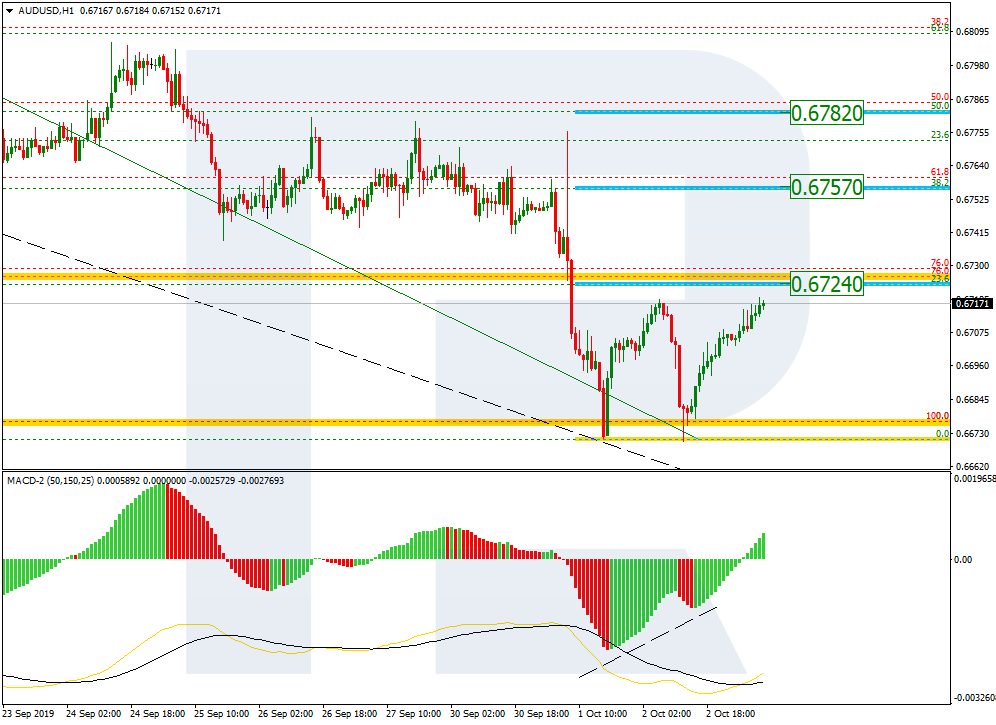
Taking into account the convergence on MACD in the H1 chart, we may assume that AUDUSD may correct towards 23.6%, 38.2%, and 50.0% fibo at 0.6724, 0.6757, and 0.6782 respectively.

AUDUSD_H1
Risk Warning: the result of previous trading operations do not guarantee the same results in the future

USDCAD, “US Dollar vs Canadian Dollar”

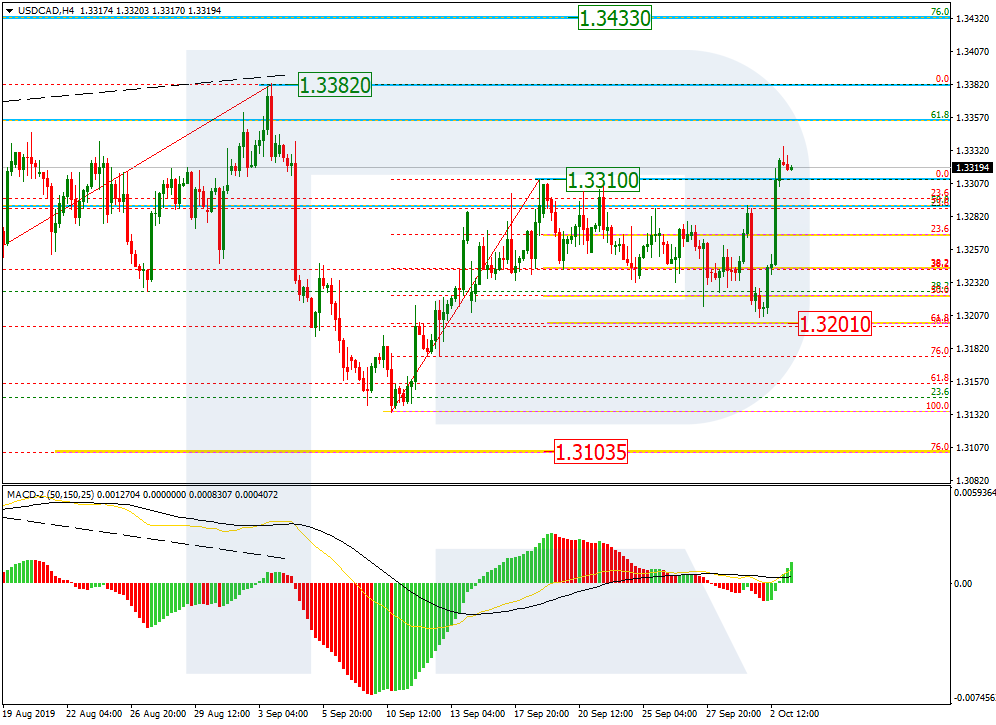
As we can see in the H4 chart, after failing to reach 50.0% fibo at 1.3201, USDCAD started a new rising impulse, which has already broken the local high and may reach the high at 1.3328. After breaking it, the instrument may continue the ascending tendency towards 76.0% fibo at 1.3433.

USDCAD_H4
Risk Warning: the result of previous trading operations do not guarantee the same results in the future

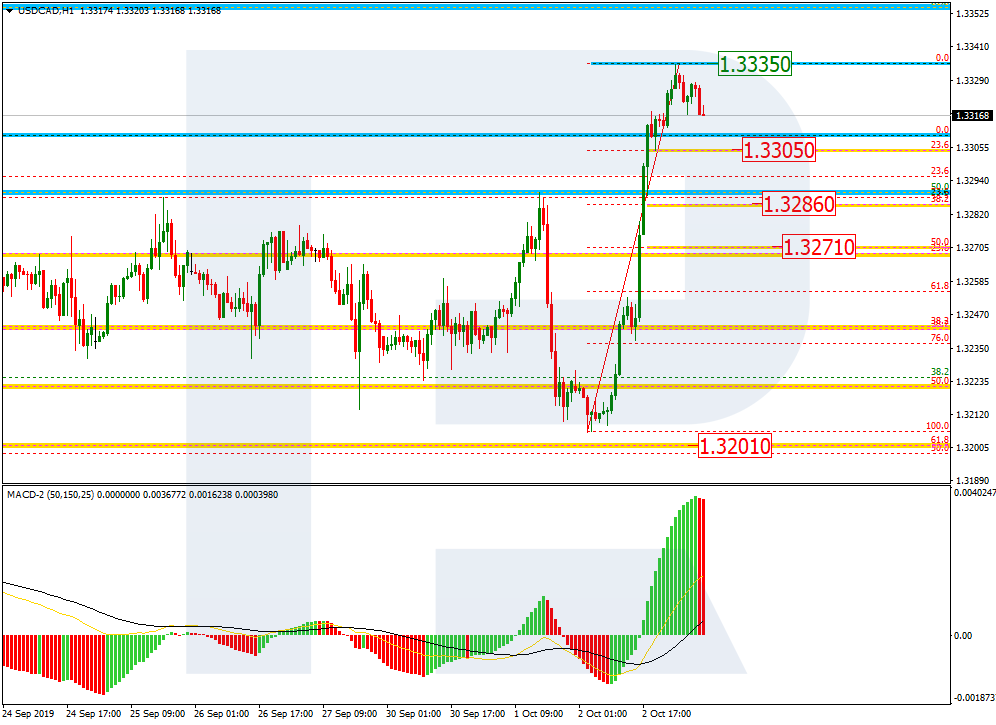
In the H1 chart, after finishing the ascending impulse, the pair is correcting. The target may be 23.6%, 38.2%, and 50.0%, fibo at 1.3305, 1.3286, and 1.3271 respectively. After breaking the resistance at 1.3335, the price may continue growing.

USDCAD_H1
Risk Warning: the result of previous trading operations do not guarantee the same results in the future

Fibonacci Retracements Analysis 23.09.2019 (GOLD, USDCHF)

Fibonacci Retracements Analysis 23.09.2019 (GOLD, USDCHF)

23.09.2019

XAUUSD, “Gold vs US Dollar”

As we can see in the H4 chart, after updating the local low, XAUUSD is back to trading inside the previous correctional range. During the correction, the pair has got very close to 50.0% fibo, but may yet continue moving to reach 61.8% and 76.0% fibo at 1528.90 and 1539.25 respectively. However, if the price breaks the low at 1483.49, the instrument may continue the mid-term descending tendency towards 50.0% and 61.8% fibo at 1478.85 and 1460.25 respectively.

GOLD_H4
Risk Warning: the result of previous trading operations do not guarantee the same results in the future

In the H1 chart, after testing 50.0% fibo at 1520.20, the pair may start a new short-term pullback. The targets may be 23.6% and 38.2% fibo at 1511.00 and 1505.75 respectively.

GOLD_H1
Risk Warning: the result of previous trading operations do not guarantee the same results in the future

USDCHF, “US Dollar vs Swiss Franc”

As we can see in the H4 chart, the divergence made the pair reverse after it tested the post-correctional extension area between 138.2% and 161.8% fibo at 0.9980 and 1.0010 respectively. By now, USDCHF has already reached 23.6% fibo and may continue falling towards 38.2%, 50.0%, and 61.8% fibo at 0.9860, 0.9821, and 0.9783 respectively.

USDCHF_H4
Risk Warning: the result of previous trading operations do not guarantee the same results in the future

In the H1 chart, after reaching mid-term 23.6% fibo, USDCHF is correcting and has already reached 50.0% fibo. If the price breaks the local low at 0.9889, the instrument may continue falling.

USDCHF_H1
Risk Warning: the result of previous trading operations do not guarantee the same results in the future

Fibonacci Retracements Analysis 02.10.2019 (GBPUSD, EURJPY)

GBPUSD, “Great Britain Pound vs US Dollar”

As we can see in the H4 chart, GBPUSD has almost reached a very significant correctional level, 61.8% fibo at 1.2197. If the pair is able to reach the next short-term correctional level, 76.0% fibo at 1.2108, it may try to test the low at 1.1958 and once again enter the post-correctional extension area between 138.2% and 161.8% fibo at 1.2019 and 1.1788 respectively. However, in case of a new rising impulse, the targets will be the high at 1.2582 and then 61.8% fibo at 1.2710.

GBPUSD_H4
Risk Warning: the result of previous trading operations do not guarantee the same results in the future

In the H1 chart, the convergence made the pair start a new correction. The rising impulse tried to reach 38.2% fibo at 1.2349, but was forced to pull back. The next rising impulse may reach the above-mentioned level and then continue growing towards 50.0%, 61.8%, and 76.0% fibo 1.2393, 1.2437, and 1.2491 respectively. The key support is the low at 1.2205.

GBPUSD_H1
Risk Warning: the result of previous trading operations do not guarantee the same results in the future

EURJPY, “Euro vs. Japanese Yen”

As we can see in the H4 chart, after slowing down its decline at 61.8% fibo, EURJPY has formed a triangle consolidation range, which means that the pair is about to start a new rising wave. The key upside target may be the high at 120.01 and 61.8% fibo at 120.50. However, one shouldn’t exclude a possibility of further decline towards 76.0% fibo at 116.86 in the short-term. In this case, the instrument may later fall to reach the low at 115.86 or even deeper.

EURJPY_H4
Risk Warning: the result of previous trading operations do not guarantee the same results in the future

In the H1 chart, the price started a new short-term correction, which has already reached 38.2% fibo. The next correctional wave may be heading towards 50.0%, 61.8%, and 76.0% fibo at 118.72, 119.02, and 119.39 respectively.

EURJPY_H1
Risk Warning: the result of previous trading operations do not guarantee the same results in the future
rfxsignals October 2, 2019 No Comments

DAILY FREE FOREX SIGNALS FOR 02-10-2019 | Форекс – Сообщество Трейдеров |إشارات الفوركس|외환 신호

GBPCAD SELL-1.62218
SL-1.62802
TP1-1.61914
TP2-1.61600

GBPAUD SELL-1.82820
SL-1.83724
TP1-1.82570
TP2-1.82355

GBPNZD SELL-1.96281
SL-1.97057
TP1-1.95954
TP2-1.95595

GBPCHF SELL-1.21921
SL-1.22680
TP1-1.21676
TP2-1.21440

NZDJPY BUY -67.525
SL-66.989
TP1-67.741
TP2-67.96411:26 02-10-2019

GBPJPY SELL-132.298
SL-133.090
TP1-131.984
TP2-131.684

RESULT

Yesterday GBPCAD SELL SIGNAL reaches target 1 and we got 20 pips profit now 🙂

Yesterday GBPjpy SELL SIGNAL reaches target 2 and we got 60 pips profit now 🙂

Yesterday GBPAUD SELL SIGNAL reaches STOPLOSS 🙁

rfxsignals October 1, 2019 No Comments

DAILY FREE FOREX SIGNALS FOR 01-10-2019 | Форекс – Сообщество Трейдеров |إشارات الفوركس|외환 신호

USDCAD SELL-1.32687
SL-1.33062
TP1-1.32482
TP2-1.32223

GBPCHF SELL-1.22018
SL-1.22680
TP1-1.21729
TP2-1.21440

GBPJPY SELL-131.949
SL-133.090
TP1-131.684
TP2-131.453

TODAY PREMIUM SIGNALS

EURCAD BUY -1.44708
SL-1.43942
TP1-1.44949
TP2-1.45193
PENDING ORDER

CHFJPY SELL-108.220
SL-108.715
TP1-108.008
TP2-107.757
INSTANT ORDER

EURUSD BUY -1.09010
SL-1.08546
TP1-1.09185
TP2-1.09422
PENDING ORDER

EURJPY BUY -118.122
SL-117.627
TP1-118.311
TP2-118.514
PENDING ORDER

EURCHF BUY -1.09113
SL-1.08238
TP1-1.09310
TP2-1.09579
PENDING ORDER

GOLD BUY -1465.23
SL-1452.84
TP1-1468.64
TP2-1472.35
PENDING ORDER