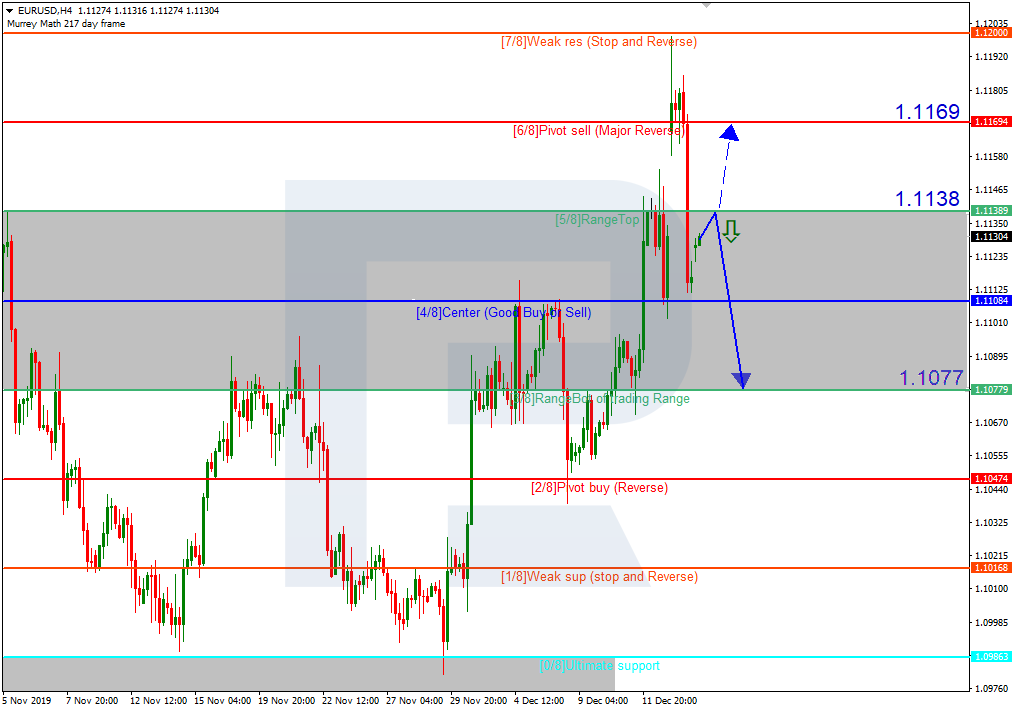
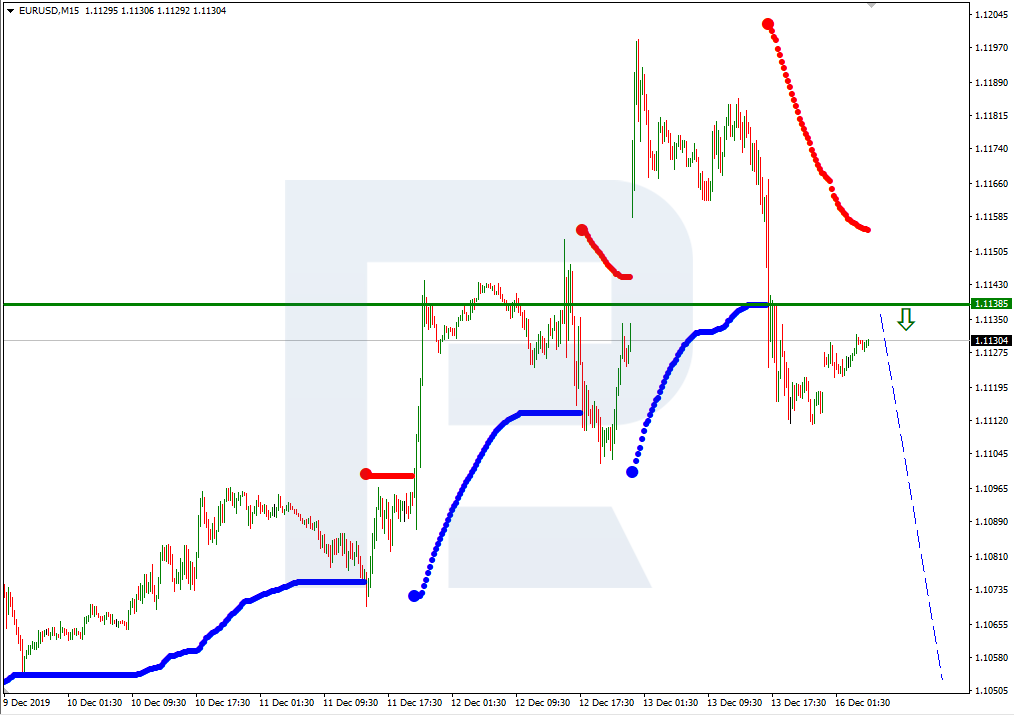
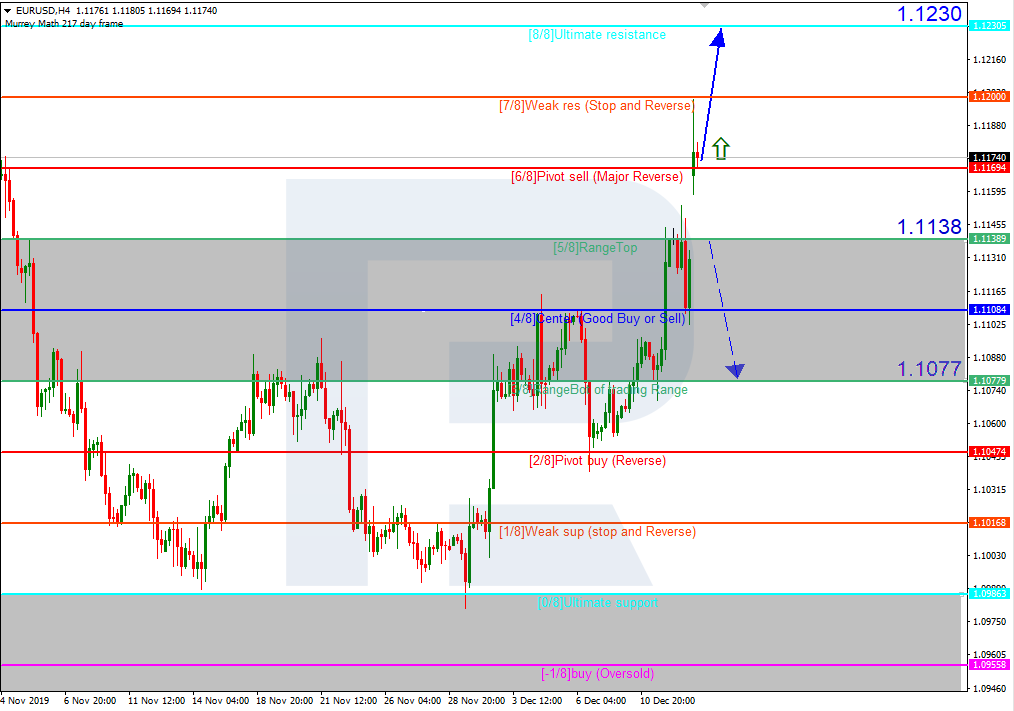
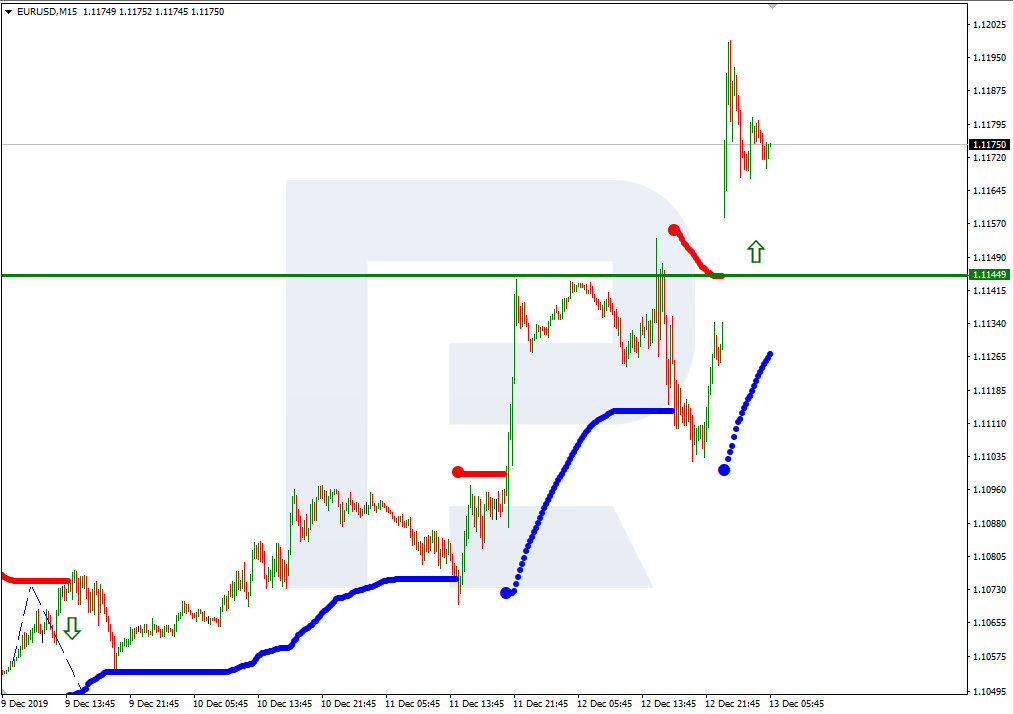
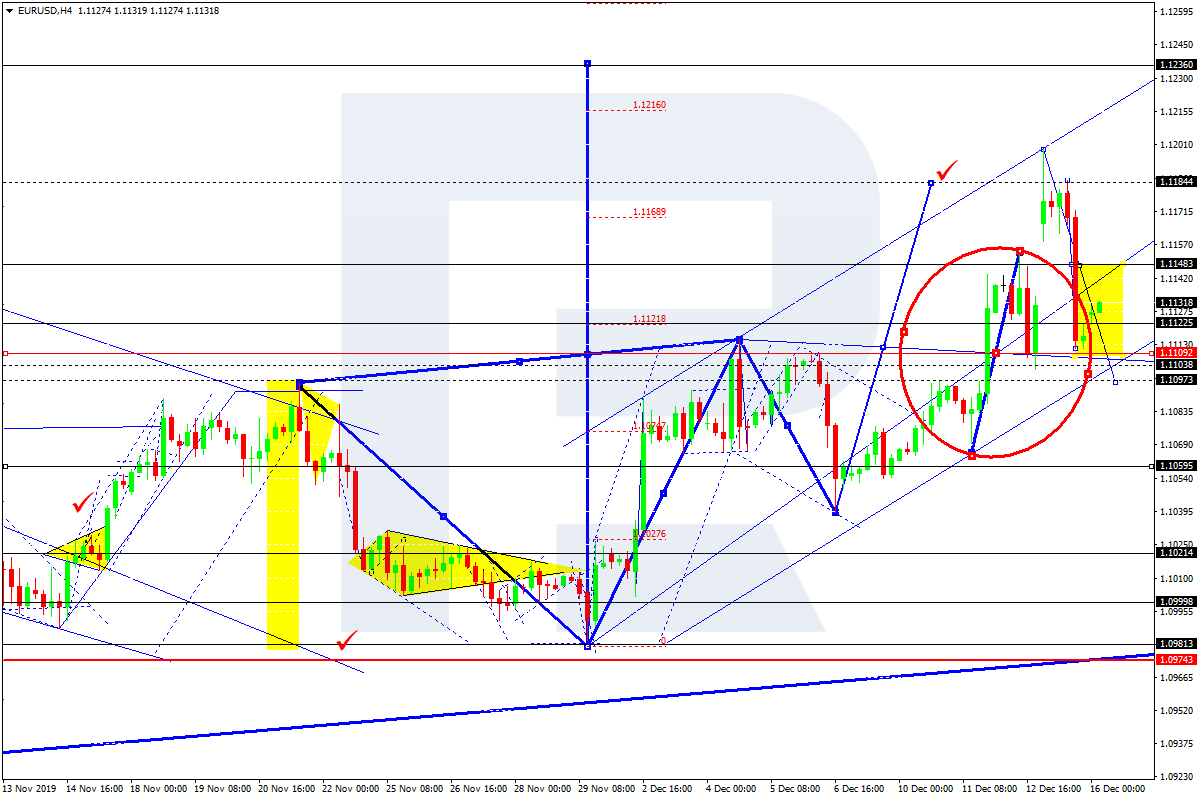
EURUSD, “Euro vs US Dollar”
EURUSD is correcting with the target at 1.1100. Possibly, today the pair may move upwards to reach 1.1146 and then form a new descending structure towards the above-mentioned target. Later, the market may start the fifth wave to the upside to reach the key target at 1.1236.

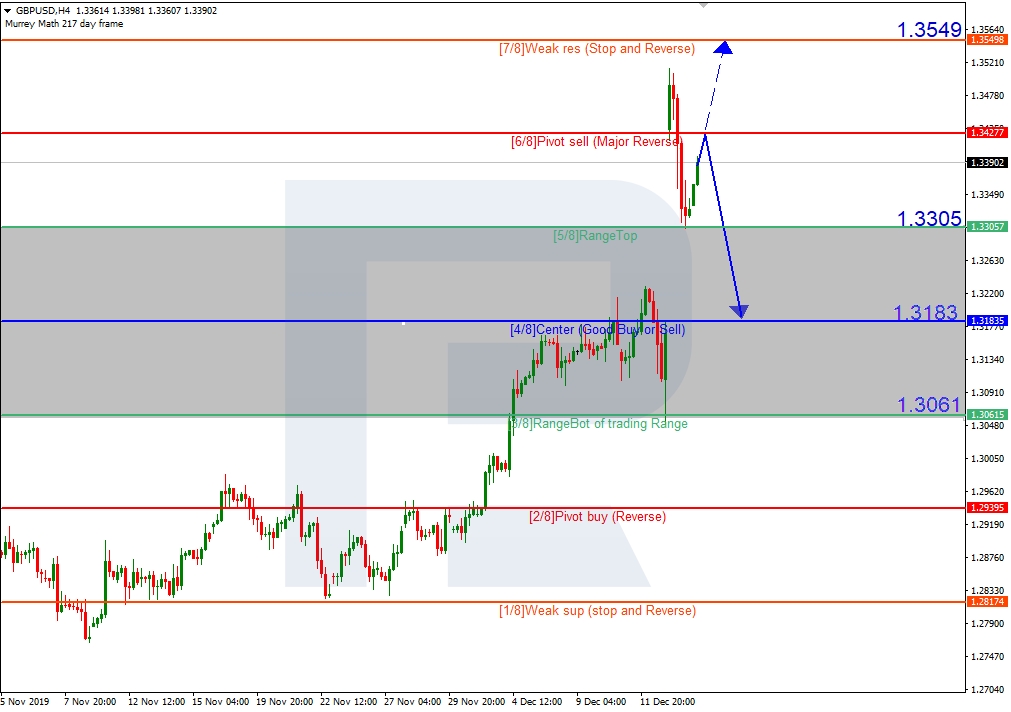
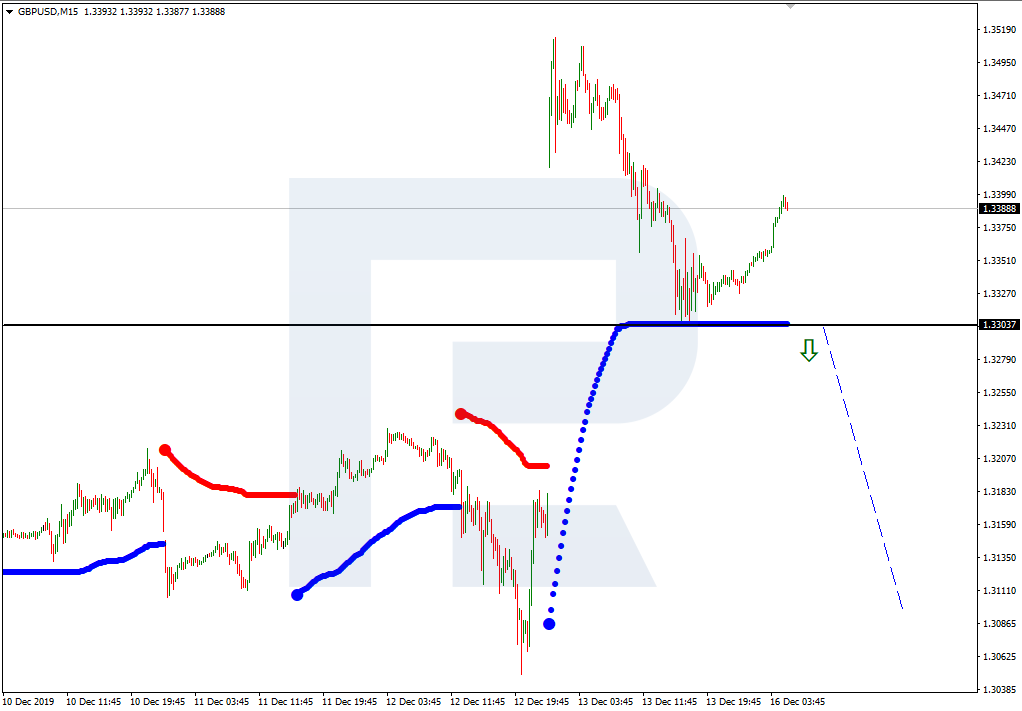
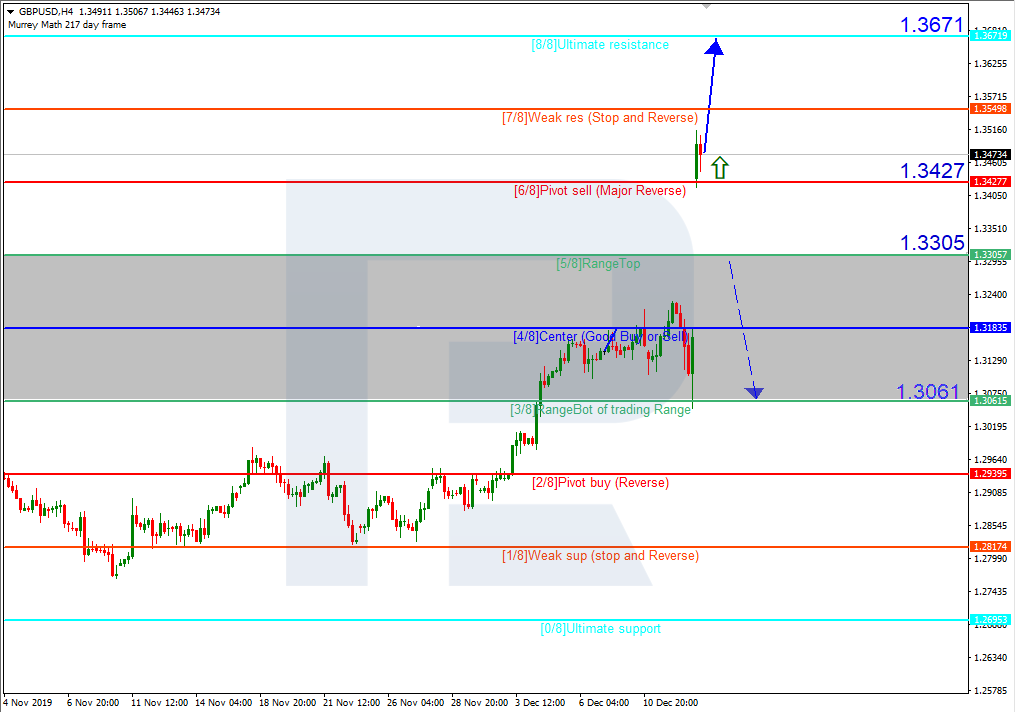
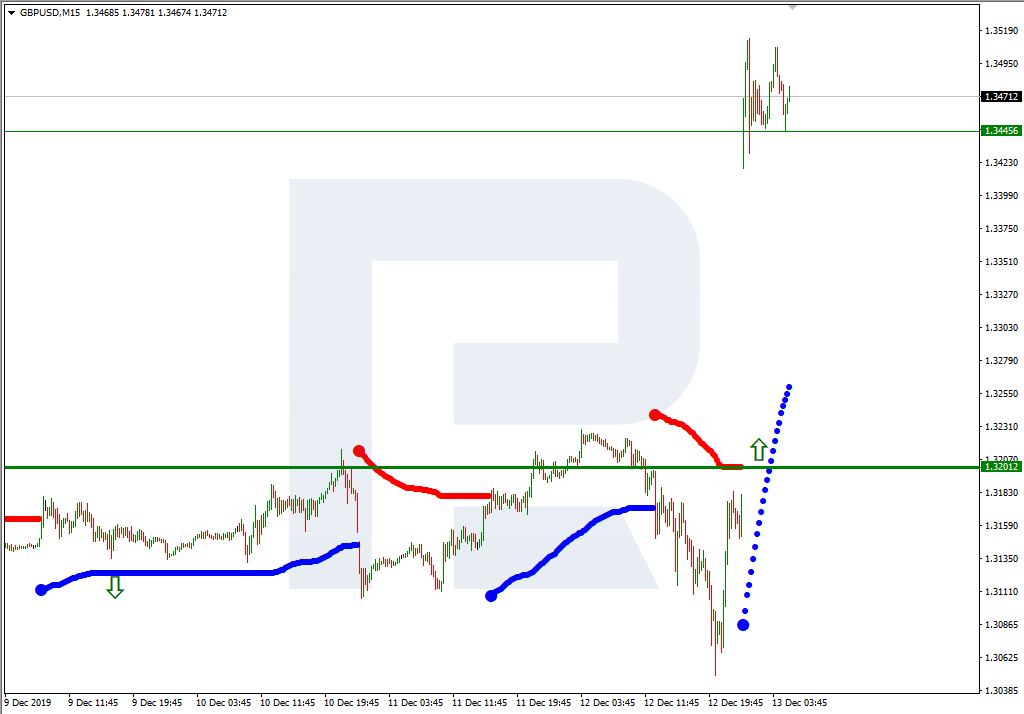
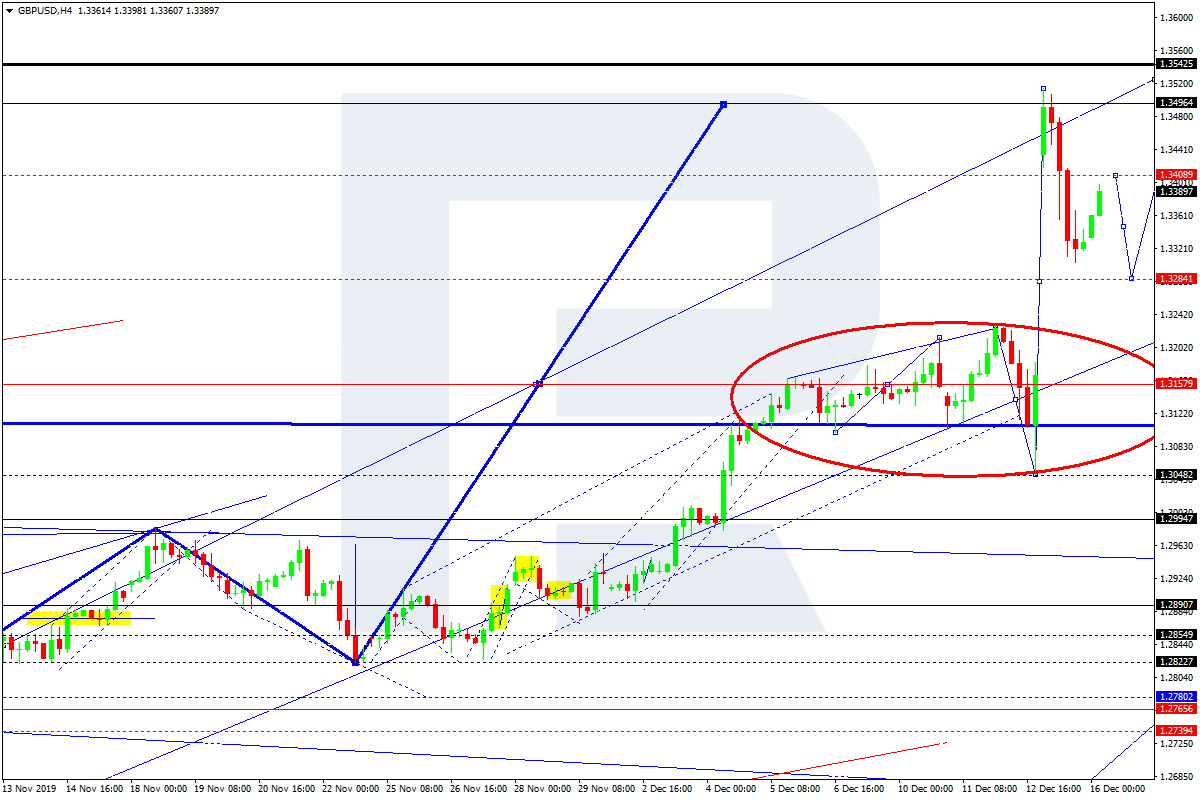
GBPUSD, “Great Britain Pound vs US Dollar”
GBPUSD is correcting with the target at 1.3288. Today, the pair may grow towards 1.3400 and then resume moving downwards to reach the above-mentioned target. After that, the instrument may form one more ascending structure towards 1.3542.
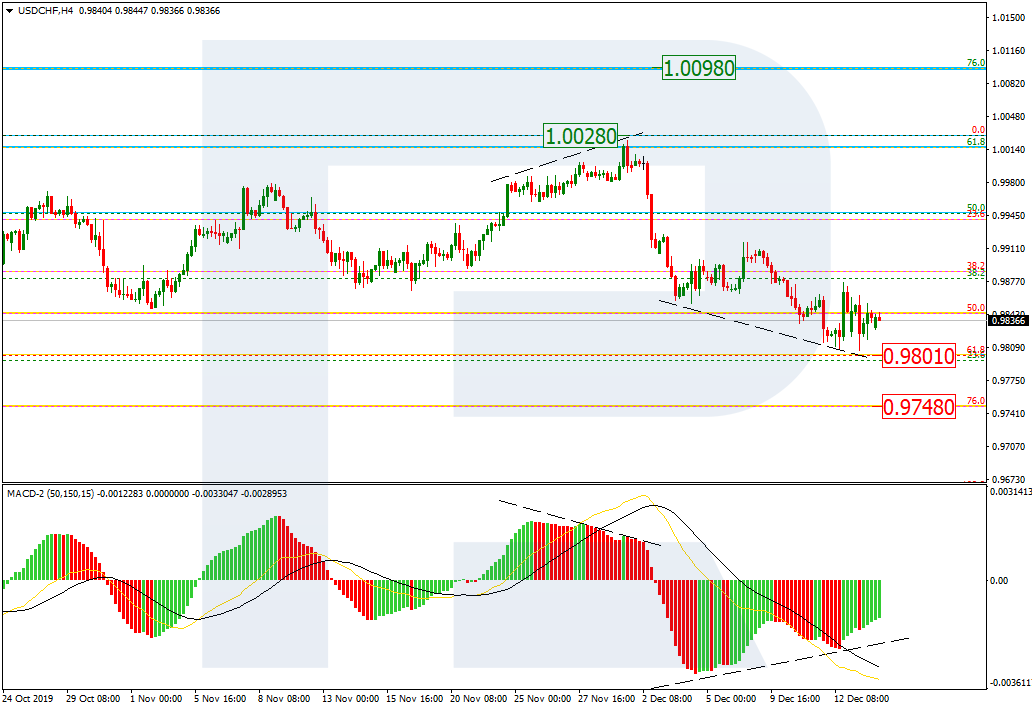
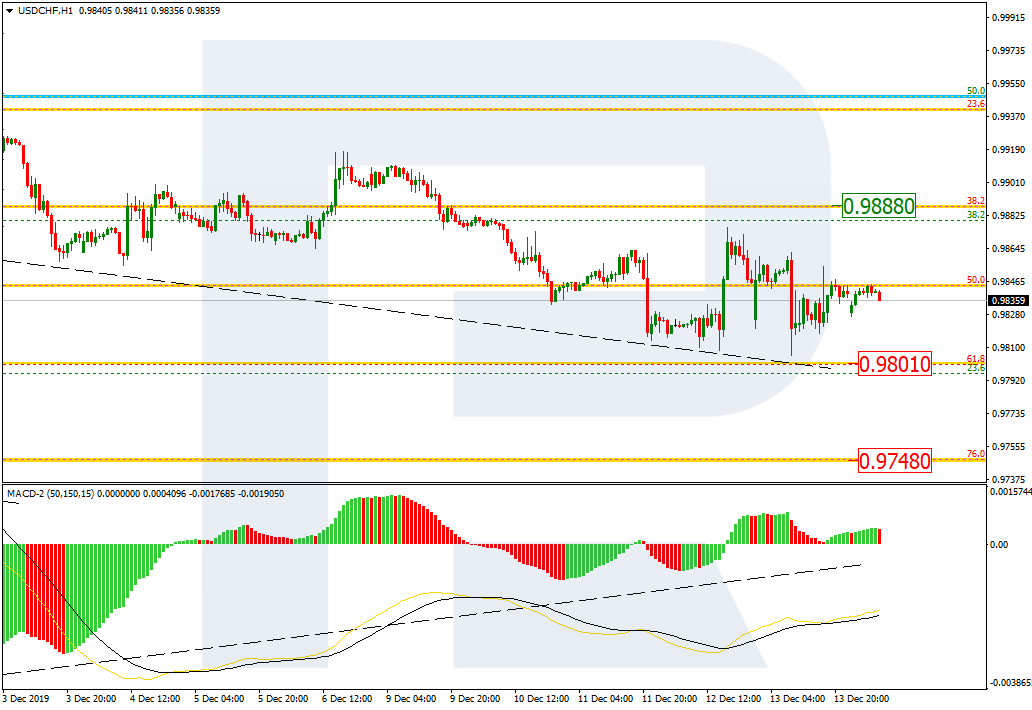
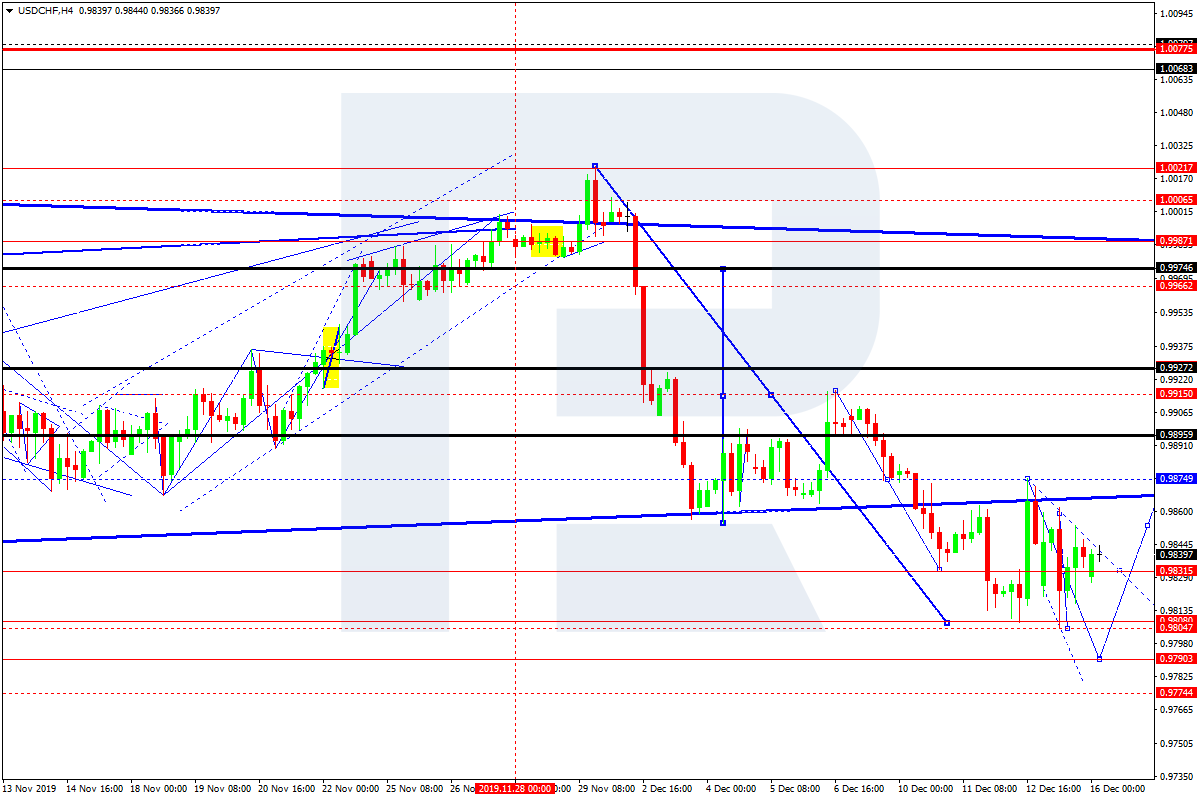
USDCHF, “US Dollar vs Swiss Franc”
USDCHF is consolidating around 0.9830. Possibly, today the pair may expand this range towards 0.9870. Later, the market may start a new decline with the target at 0.9790 and then resume trading upwards to reach 0.9915.
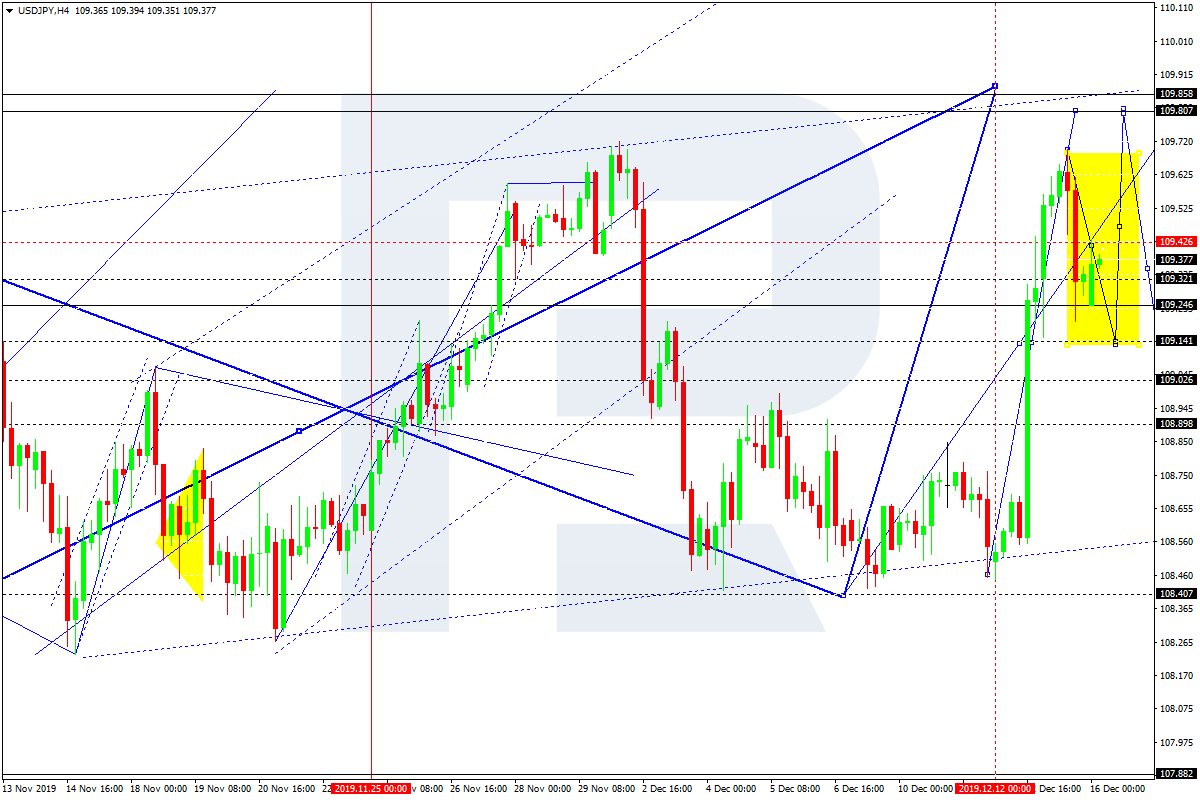
USDJPY, “US Dollar vs Japanese Yen”
USDJPY is correcting with the target at 109.14. Today, the pair may reach 109.44 and then start a new decline to reach the above-mentioned target. After that, the instrument may form one more ascending structure with the short-term target at 109.80.
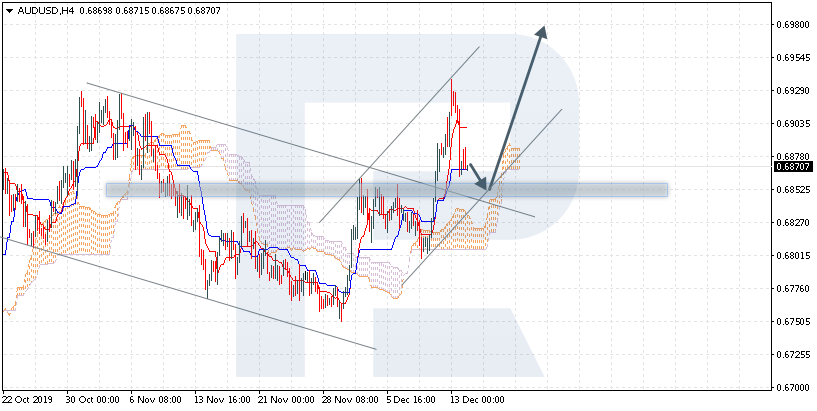
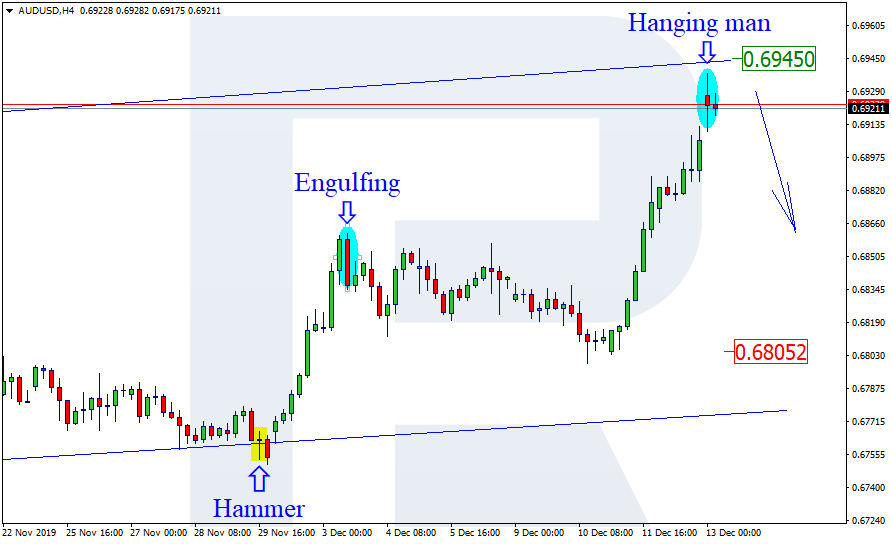
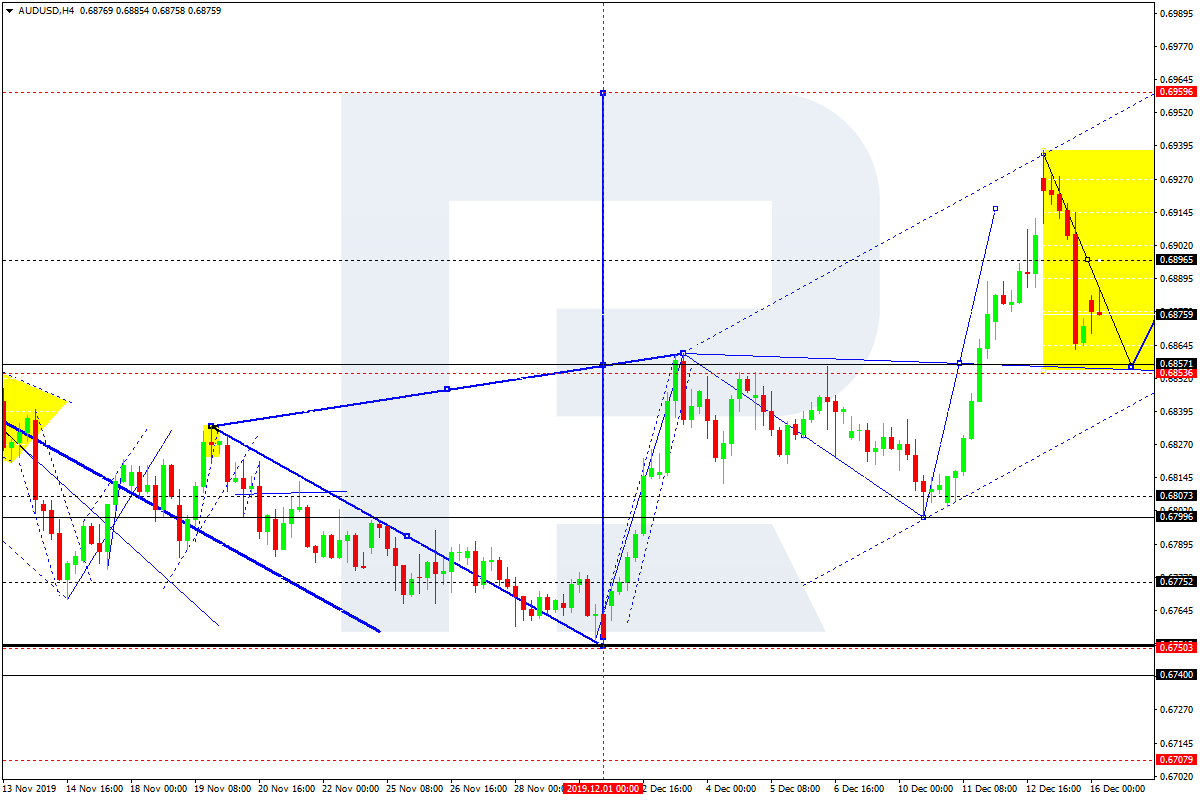
AUDUSD, “Australian Dollar vs US Dollar”
AUDUSD is correcting towards 0.6856. Later, the market may resume moving upwards with the key upside target at 0.6959.
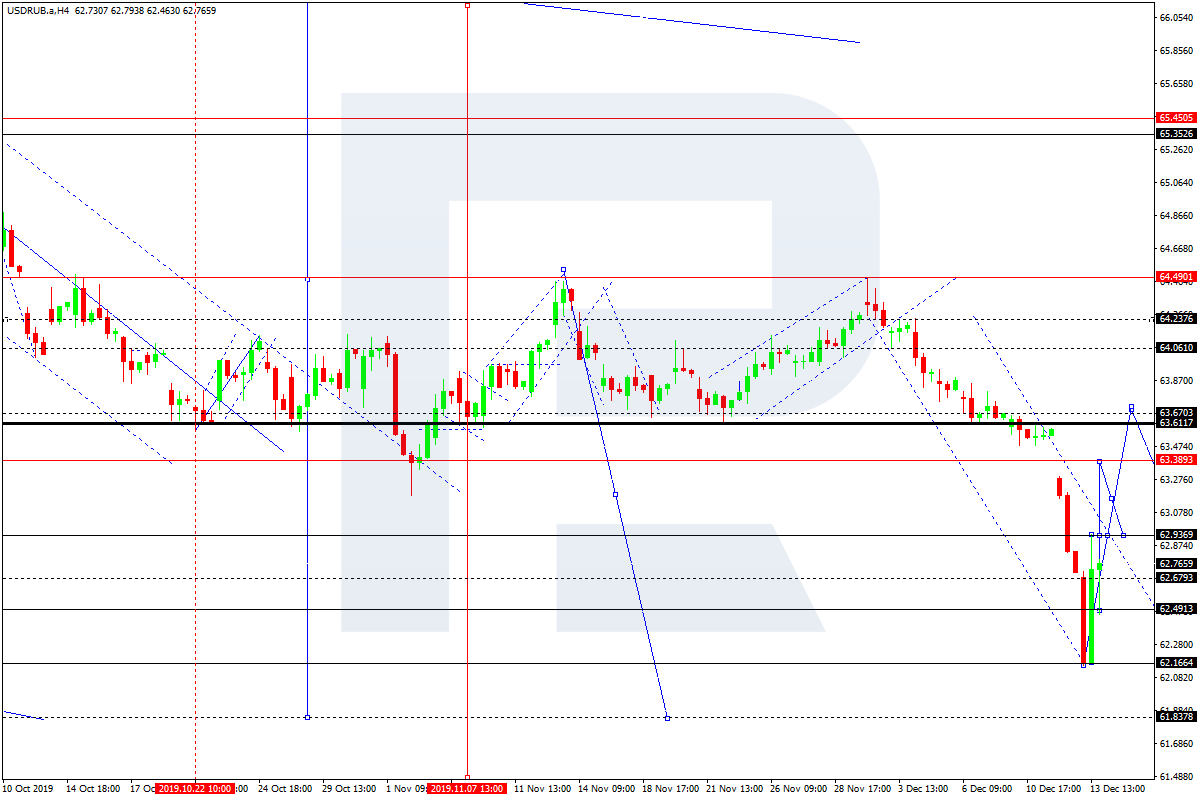
USDRUB, “US Dollar vs Russian Ruble”
USDRUB has completed the ascending impulse at 62.91 along with the correction towards 62.50, thus forming a new consolidation range. If later the price breaks this range to the upside at 62.90, the market may start a new growth with the short-term target at 63.37.
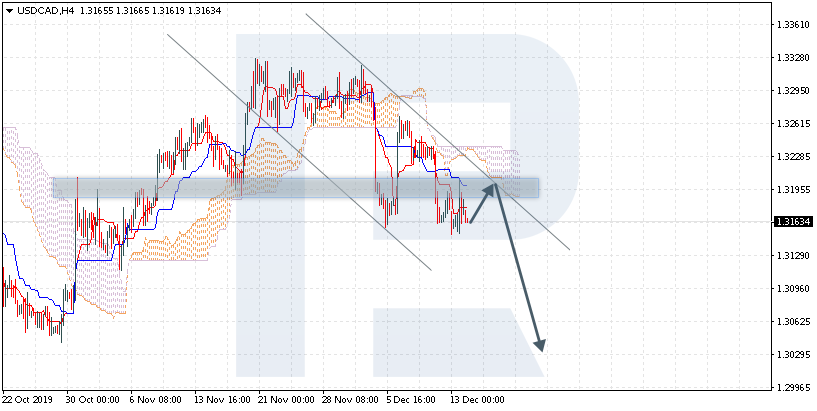
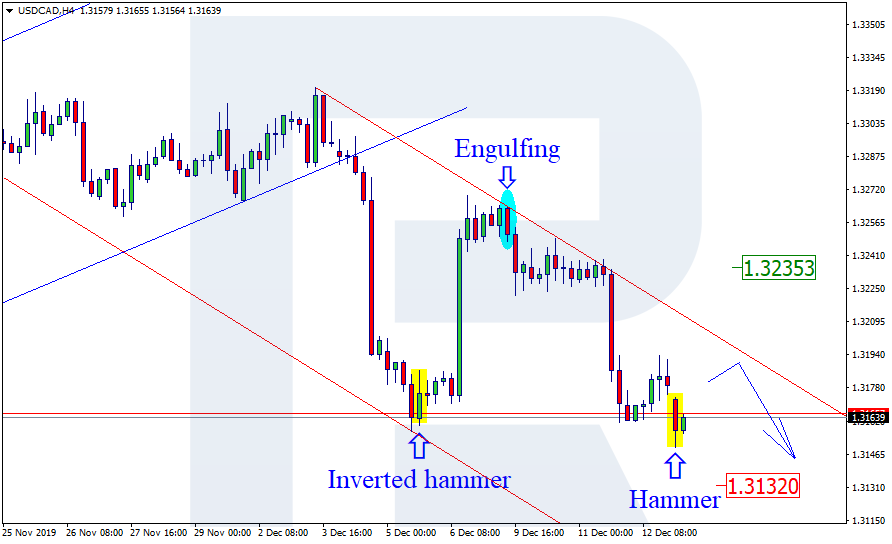
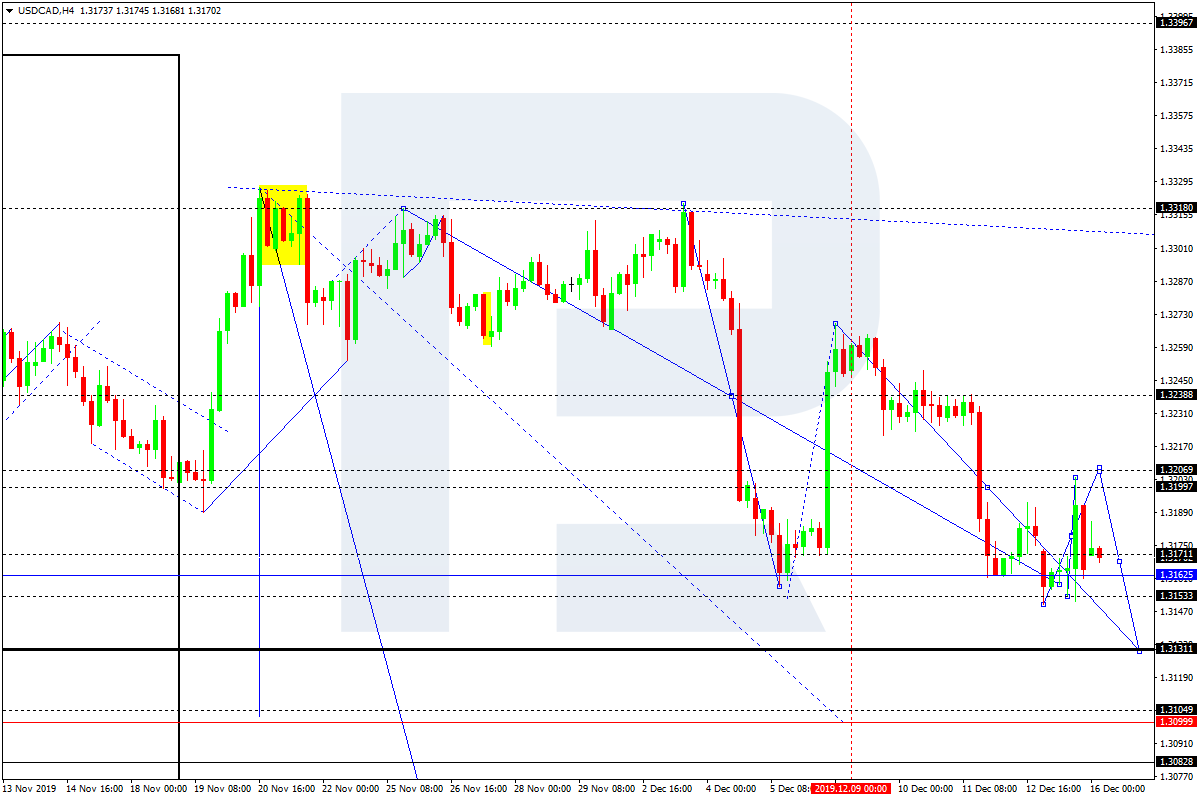
USDCAD, “US Dollar vs Canadian Dollar”
USDCAD is consolidating around 1.3177. Possibly, the pair may reach 1.3200 and then form a new descending structure towards 1.3131. Later, the market may start another correction with the target at 1.3232.
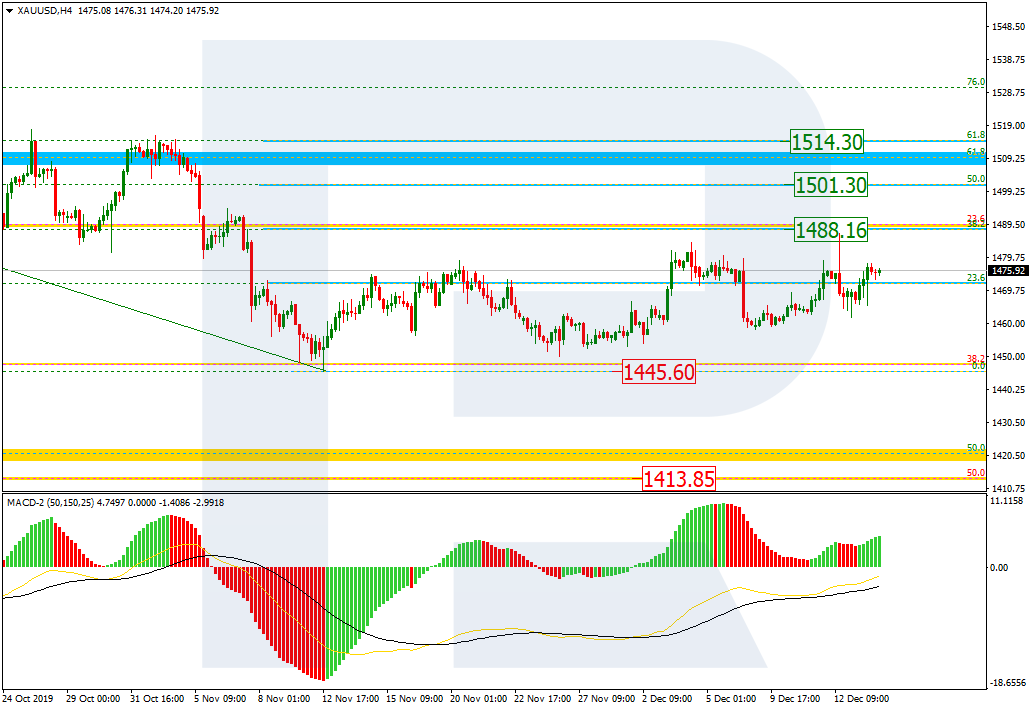
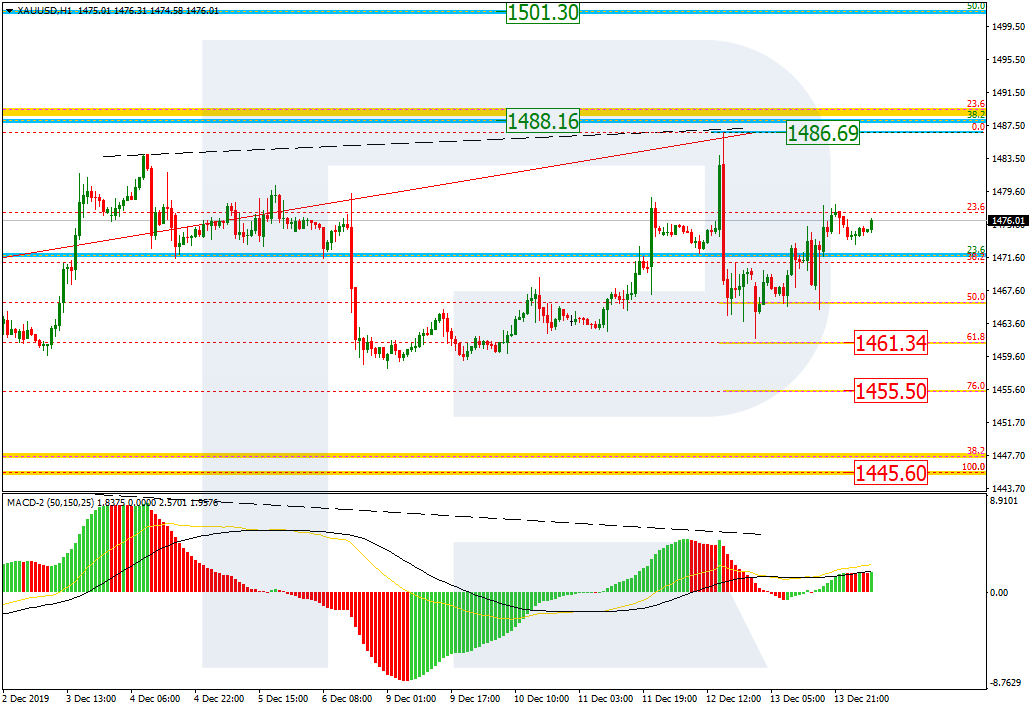
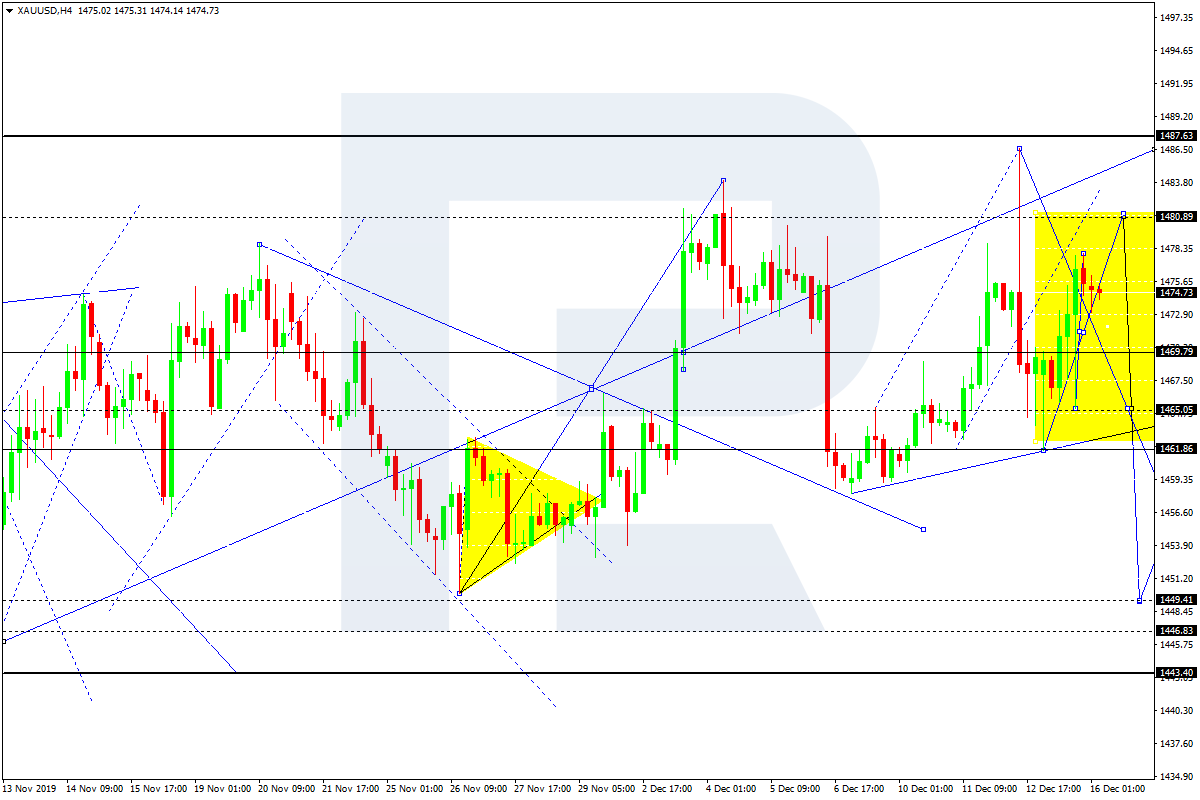
XAUUSD, “Gold vs US Dollar”
Gold is correcting towards 1480.88. After that, the instrument may form a new descending structure to break 1465.05 and then continue moving downwards with the target at 1449.40.
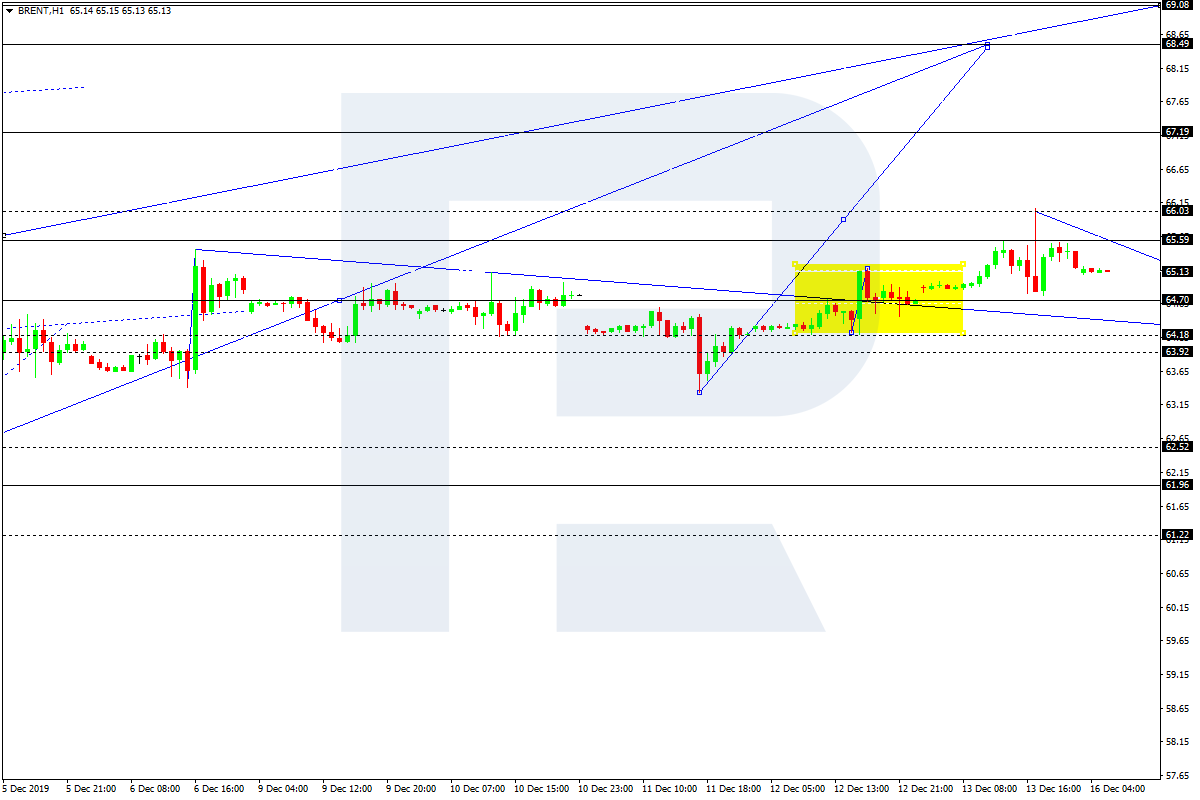
BRENT
Brent has finished the ascending impulse at 66.00; right now, it is correcting downwards to reach 64.77. After that, the market may start a new growth with the short-term target at 67.20.
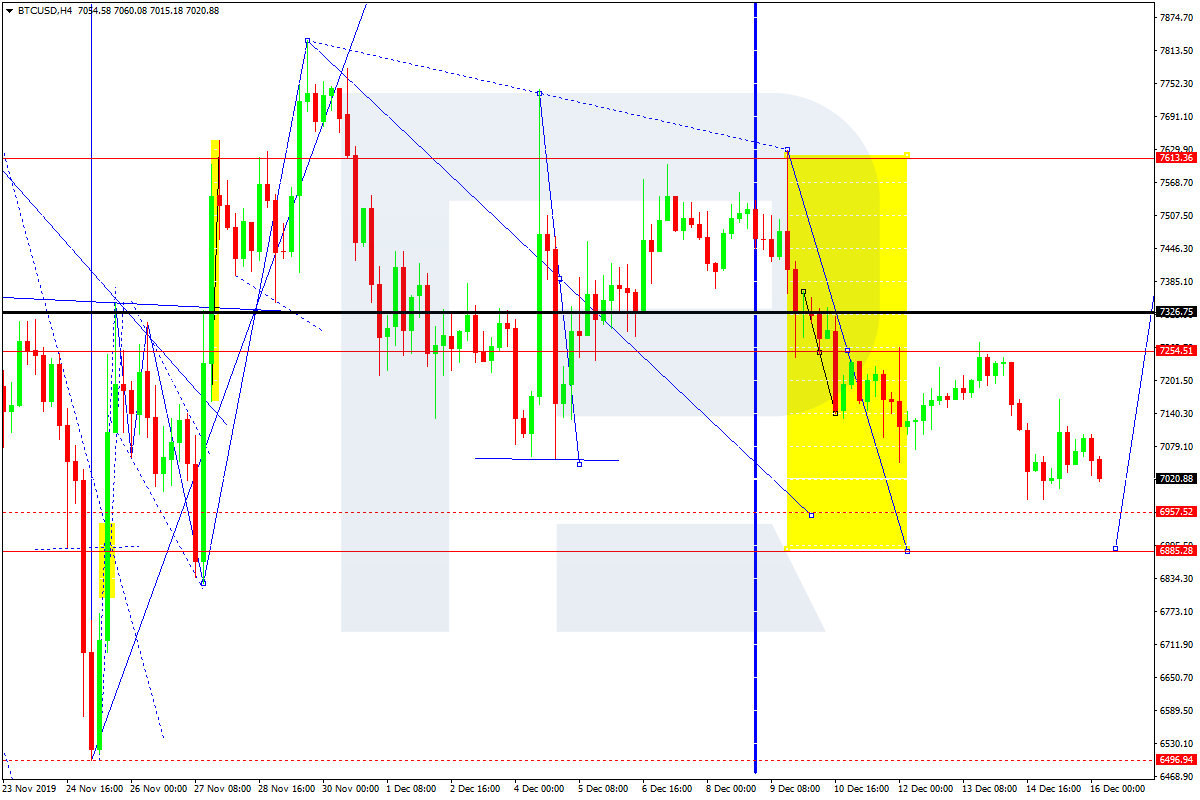
BTCUSD, “Bitcoin vs US Dollar”
BTCUSD is moving downwards with the target at 7000.00. Later, the market may form one more ascending structure to break 7600.00 and then continue trading upwards to reach 8165.00.