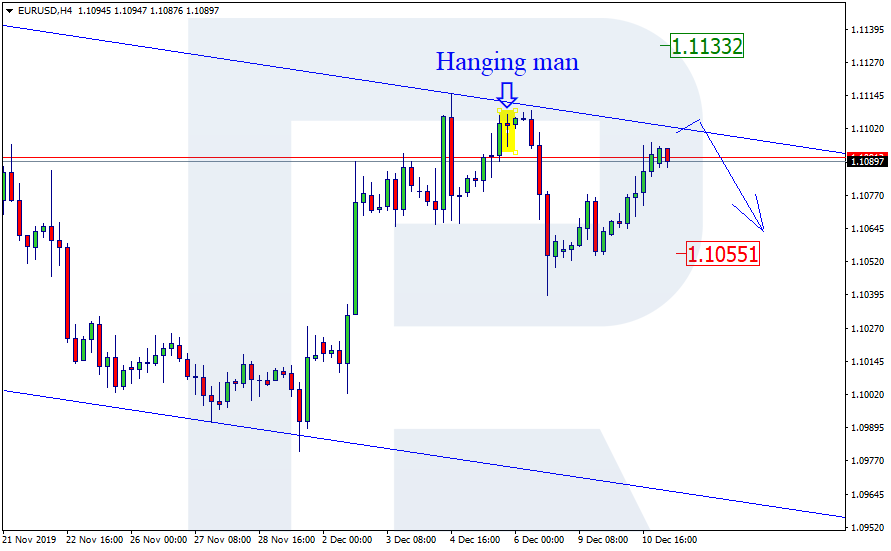
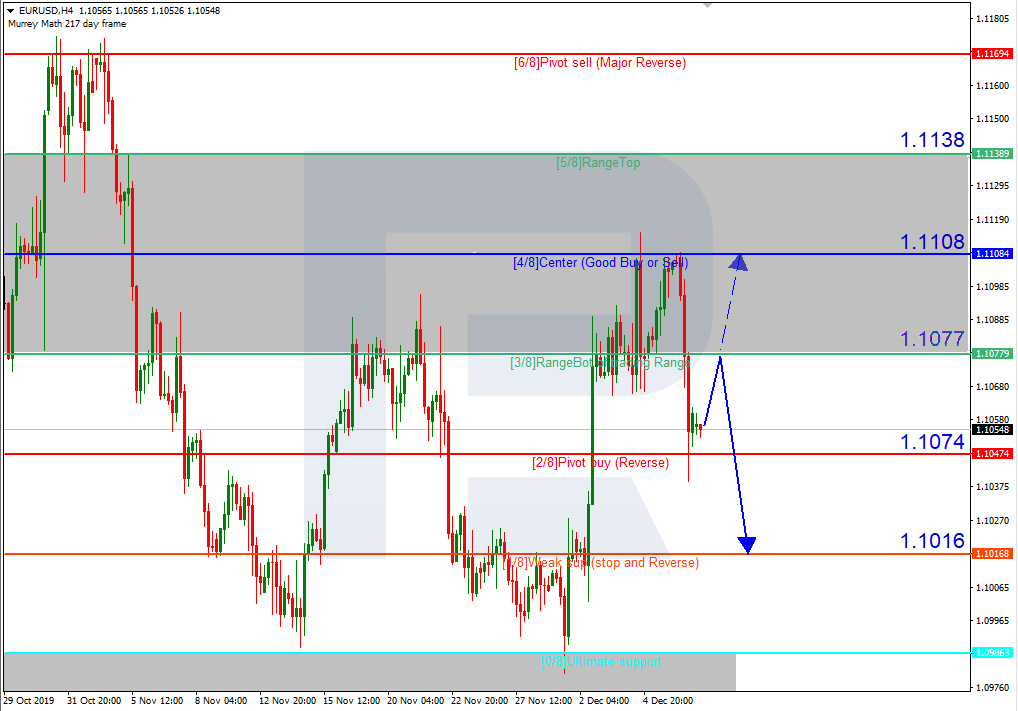
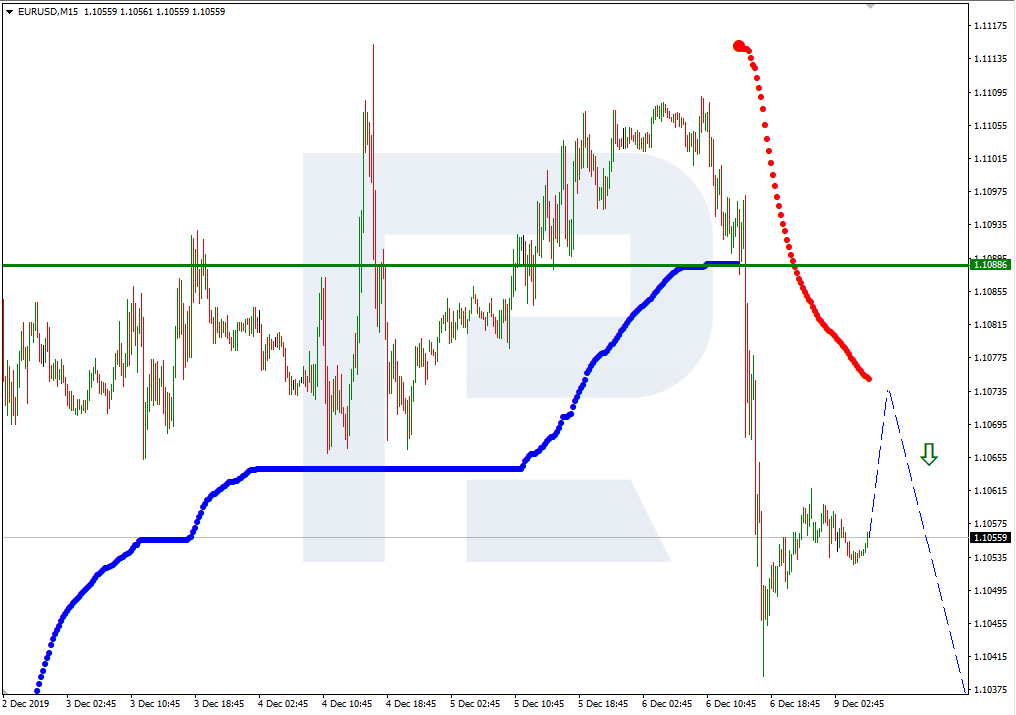
EURUSD, “Euro vs US Dollar”
EURUSD has completed the ascending wave at 1.1097; right now, it is consolidating at the top. Possibly, the pair may expand this range downwards and upwards, 1.1074 and 1.1084 respectively. If later the price breaks this range to the upside, the market may choose an alternative scenario and continue moving upwards to reach 1.1114; if to the downside – resume trading inside the downtrend with the first target at 1.1065.


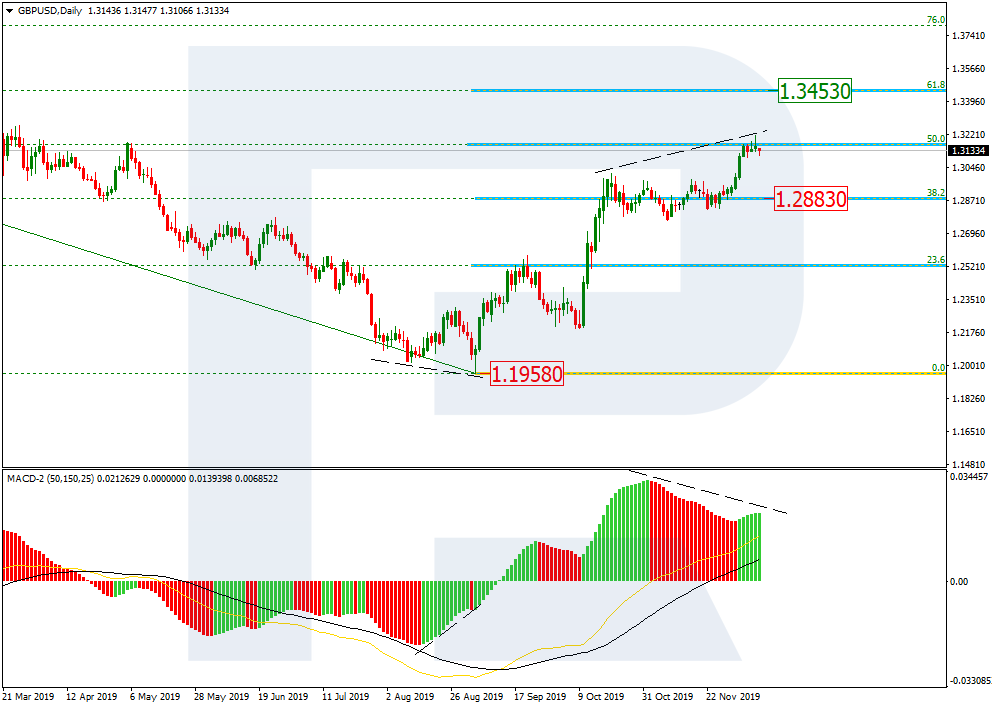
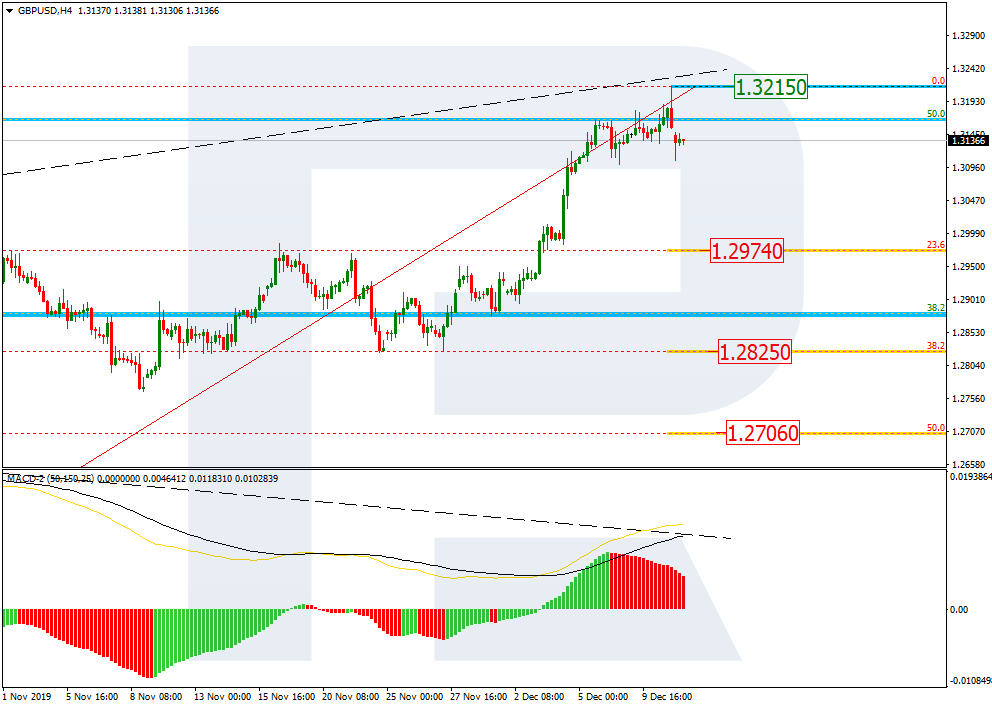
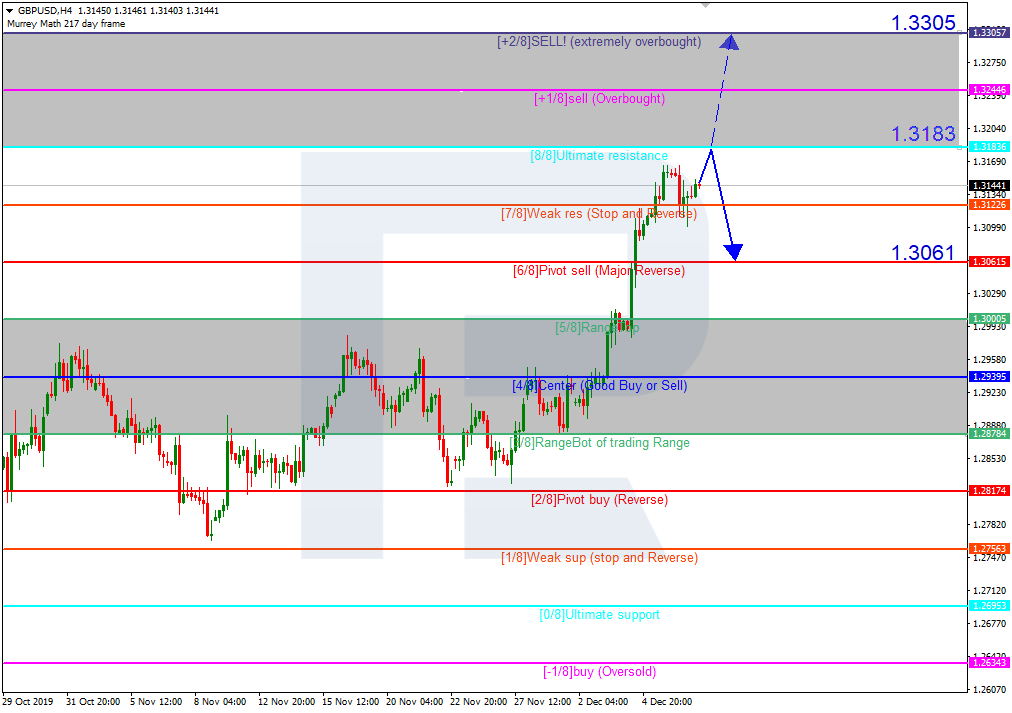
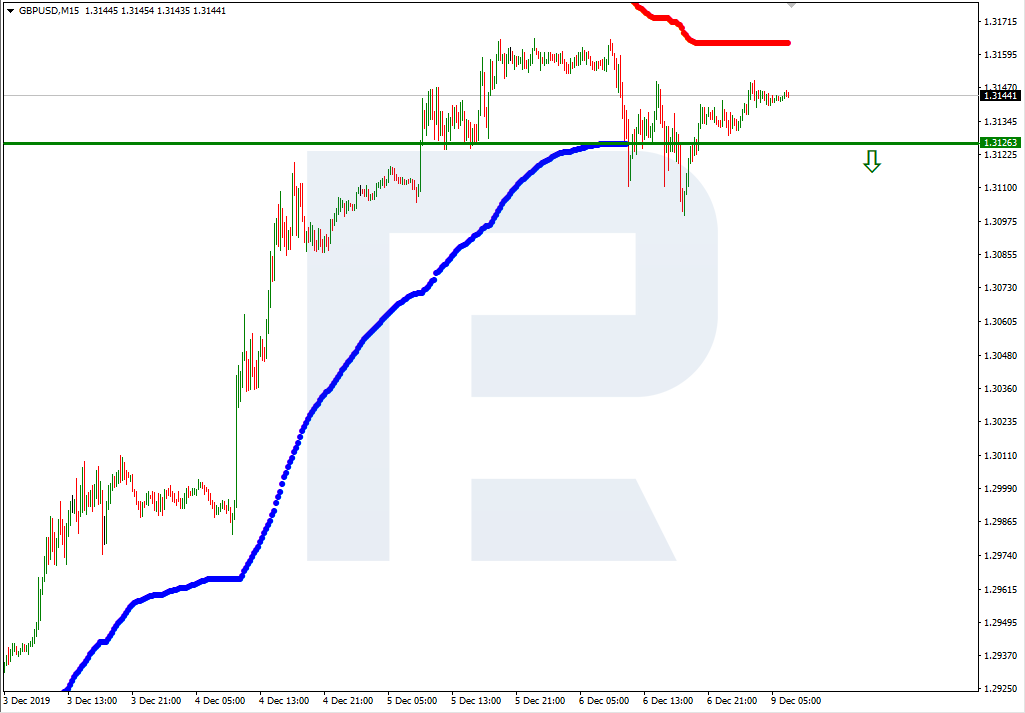
GBPUSD, “Great Britain Pound vs US Dollar”
After reaching 1.3200, GBPUSD is quickly falling and has already formed two descending impulses. Today, the pair may correct towards 1.3154 and then start a new decline with the first target at 1.3090.

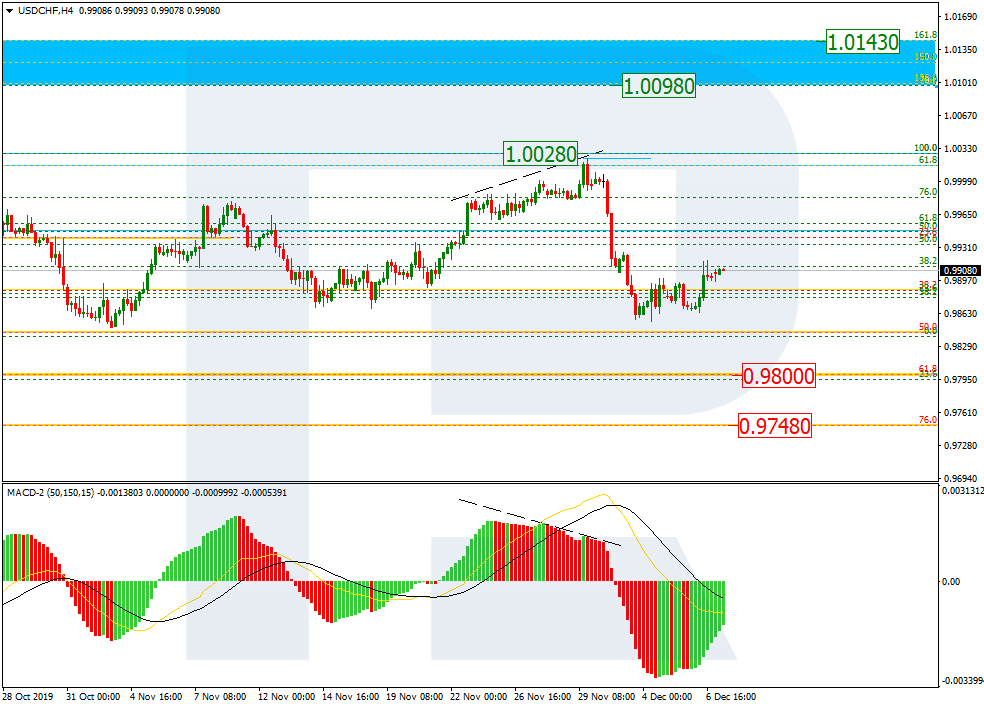
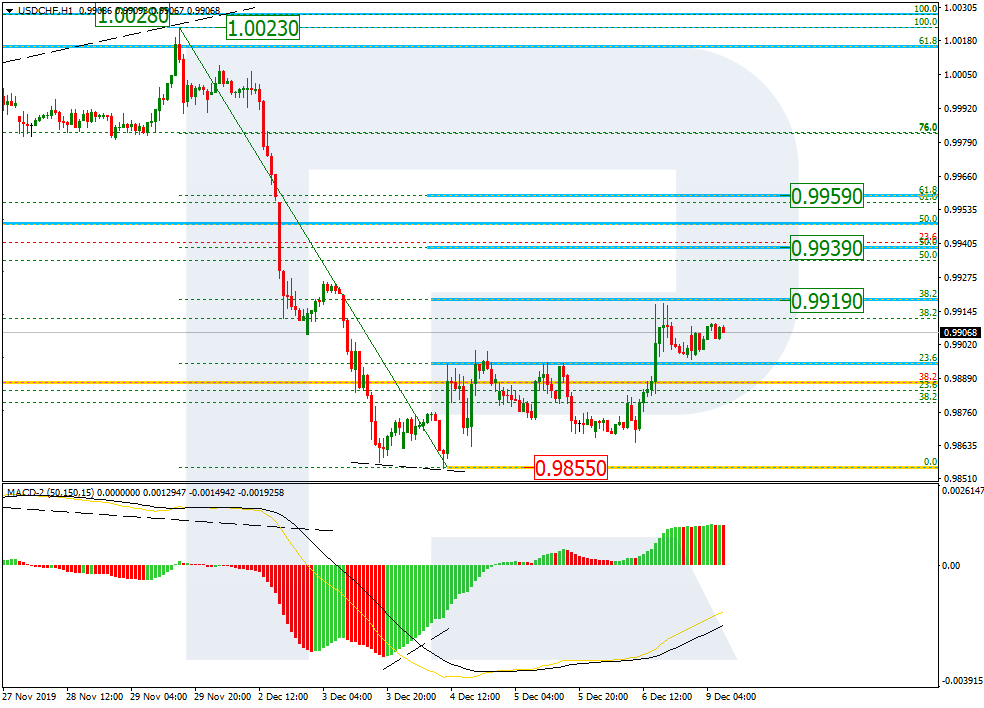
USDCHF, “US Dollar vs Swiss Franc”
USDCHF has reached the downside target at 0.9835; right now, it is growing towards 0.9880. Later, the market may start a new decline to reach 0.9855 and then form one more ascending structure with the first target at 0.9970.

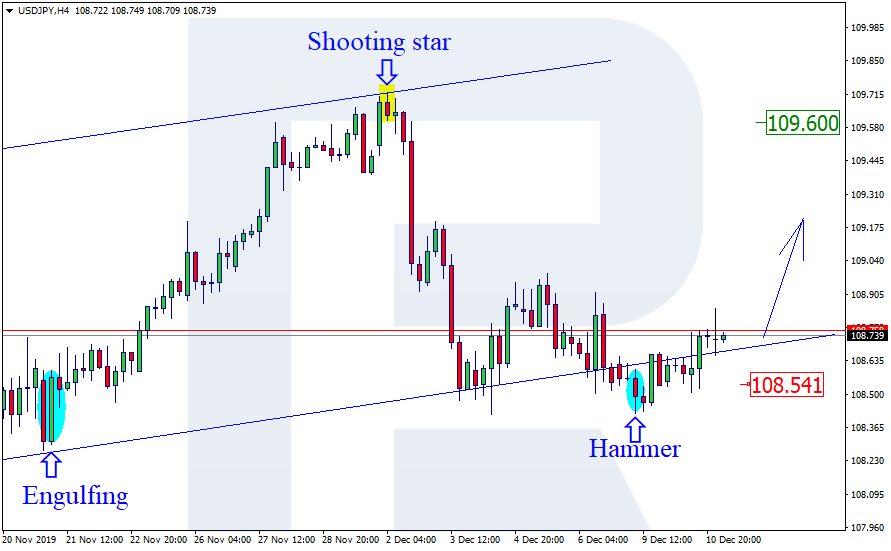
USDJPY, “US Dollar vs Japanese Yen”
USDJPY has reached 108.75. Possibly, today the pair may fall to break 108.50 and then continue moving downwards with the target at 108.27.

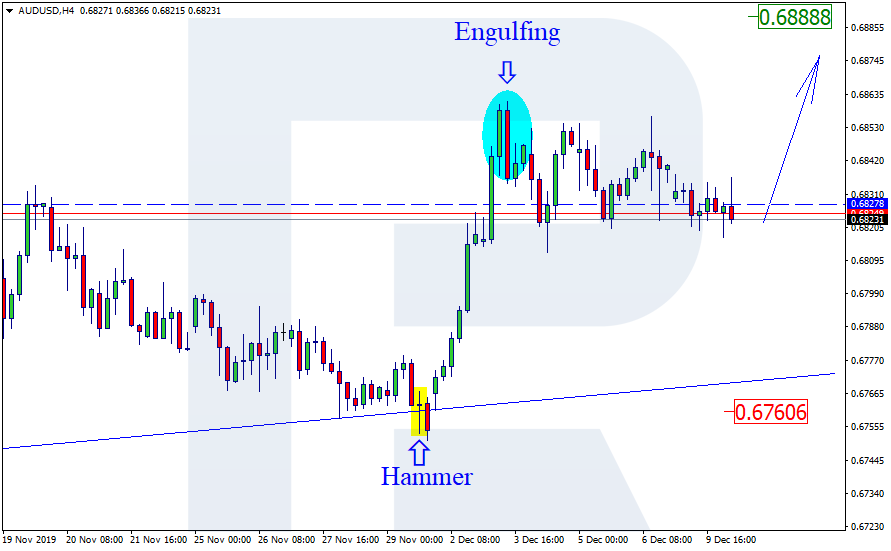
AUDUSD, “Australian Dollar vs US Dollar”
AUDUSD has reached the target of Flag pattern at 0.6807; right now, it is growing towards 0.6834. Possibly, the pair may reach this level and then resume trading inside the downtrend with the target at 0.6817.

USDRUB, “US Dollar vs Russian Ruble”
USDRUB is moving downwards. Possibly, today the pair may test 63.64 from below and then form a new descending structure with the short-term target at 63.04.

USDCAD, “US Dollar vs Canadian Dollar”
USDCAD is moving downwards to reach 1.3217. Later, the market may form one more ascending structure towards 1.3274, thus forming a new consolidation range between these levels. If later the price breaks this range to the downside, the market may resume trading downwards to reach 1.3108; if to the upside – continue the uptrend with the target at 1.3282.

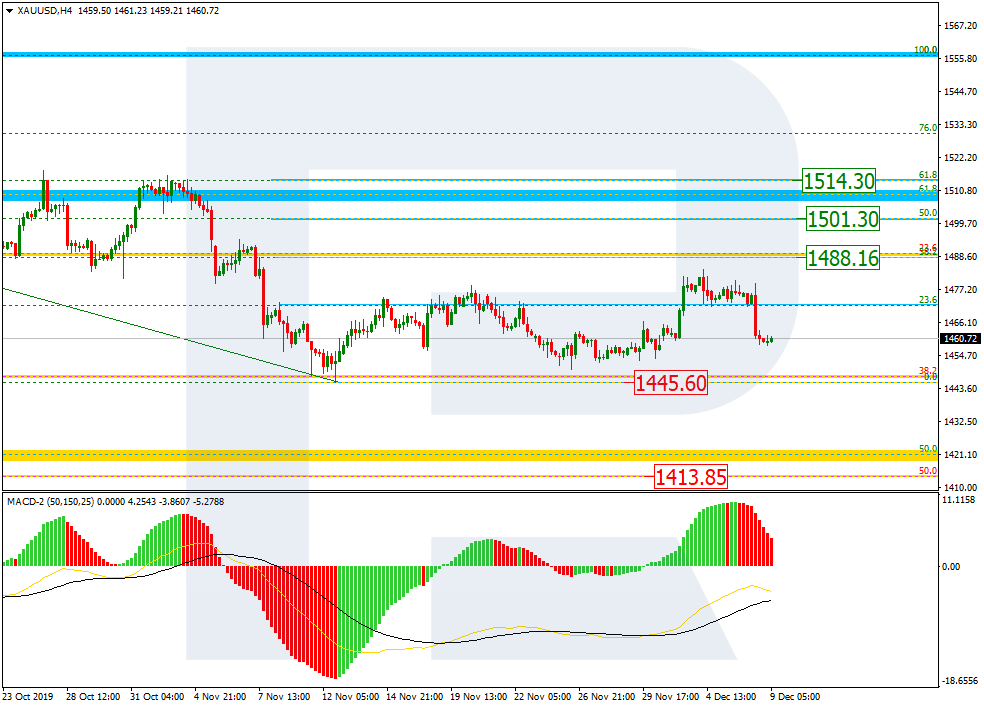
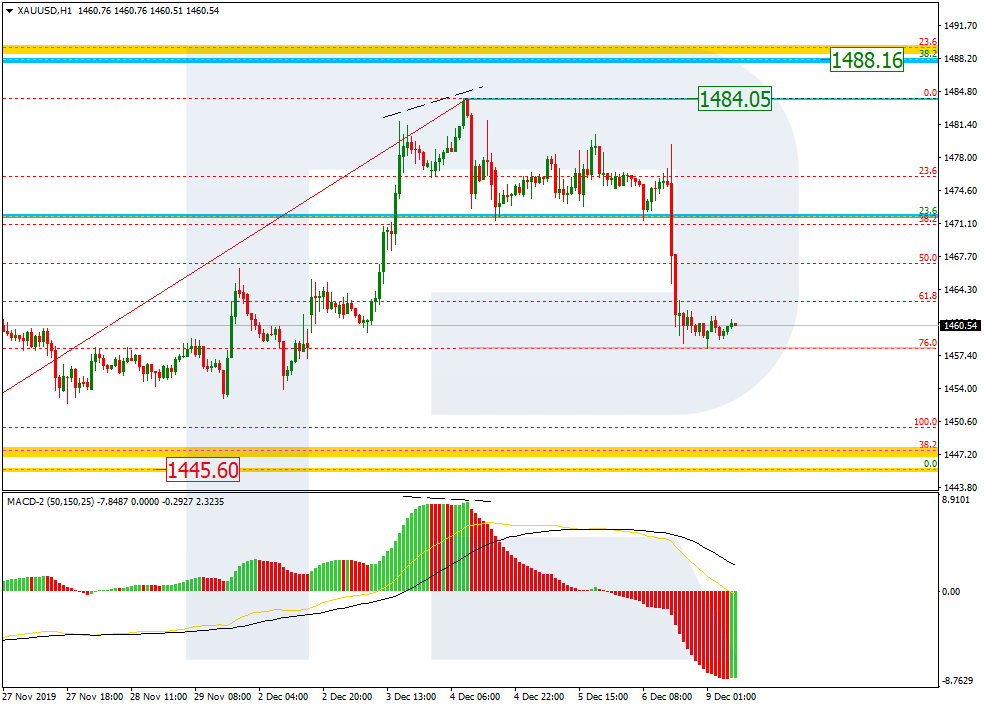
XAUUSD, “Gold vs US Dollar”
Gold has completed the ascending structure at 1468.62; right now, it is falling towards 1457.21. After that, the instrument may form onу more ascending structure to return to 1468.60 and then resume moving downwards with the target at 1444.00.

BRENT
Brent is still consolidating around 64.60. Possibly, today the pair may fall towards 63.74 and then grow to reach 68.46. After that, the market may start a new decline towards 64.60. If later the price breaks this range to the upside, the market may form one more ascending structure with the short-term target at 68.00; if to the downside – start another correction to reach 62.55.

BTCUSD, “Bitcoin vs US Dollar”
BTCUSD has broken 7340.00; right now, it is still moving downwards to reach 7030.00. After that, the instrument may resume moving upwards to break 7600.00 and then continue growing with the first target at 8165.00.