Ichimoku Cloud Analysis 10.01.2020 (AUDUSD, NZDUSD, USDCAD)
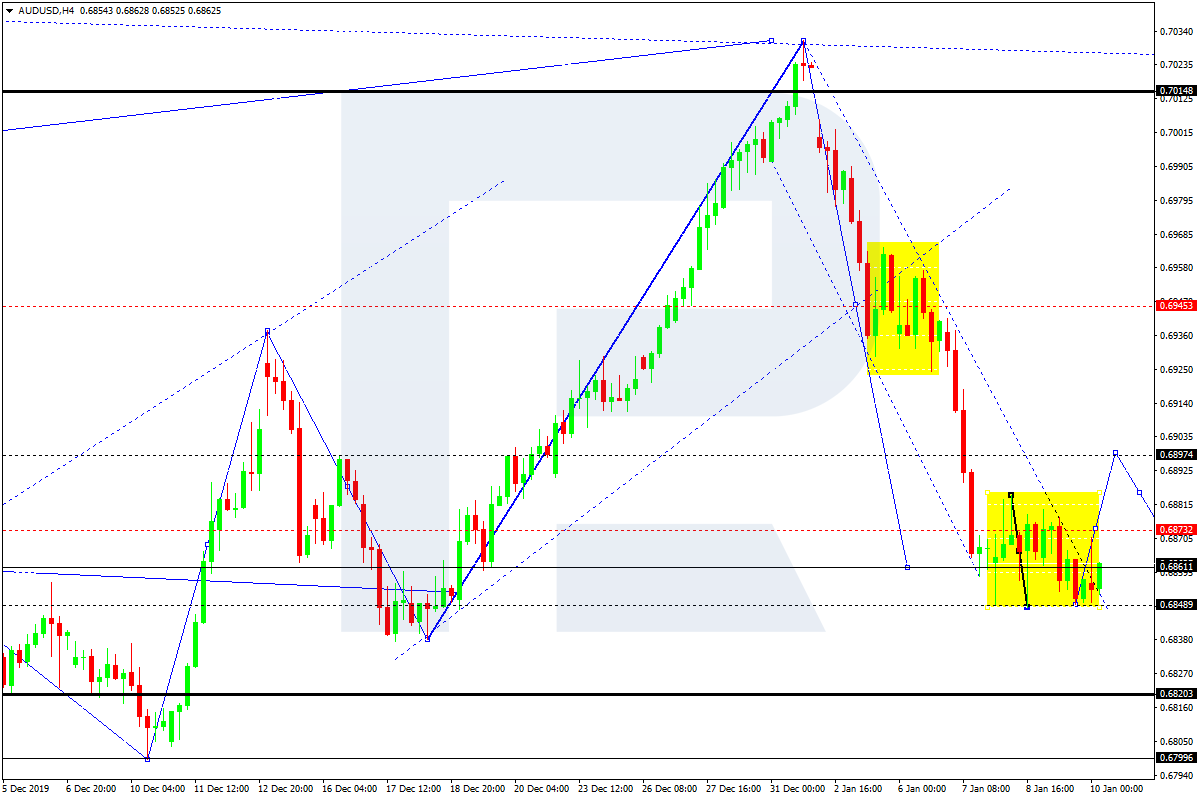
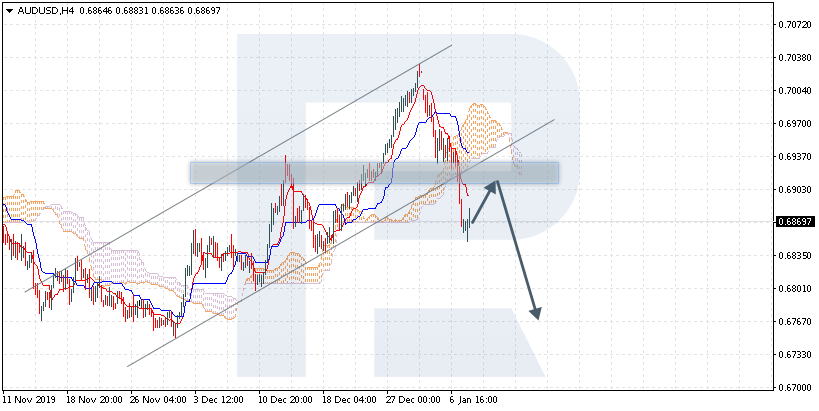
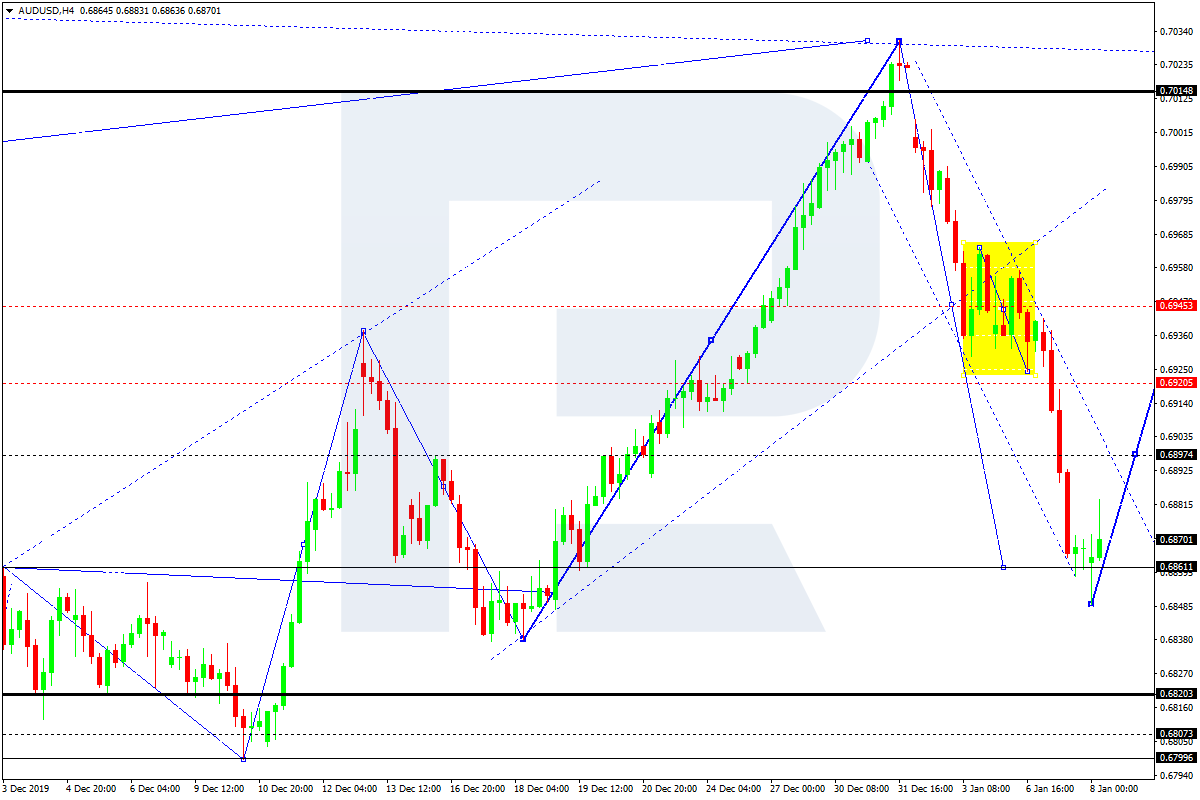
AUDUSD, “Australian Dollar vs US Dollar”
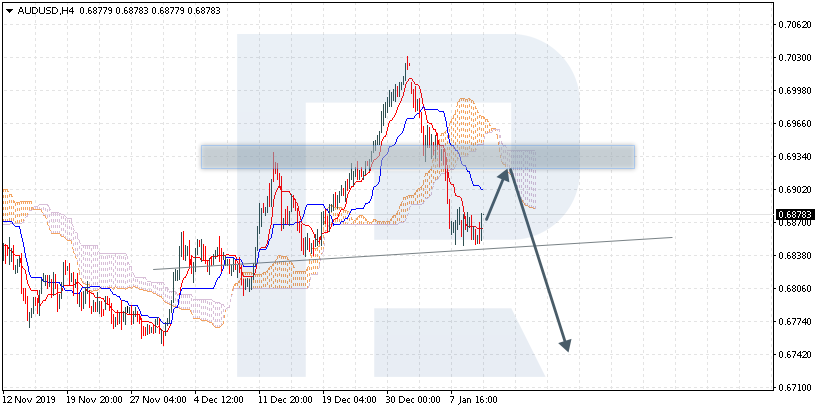
AUDUSD is trading at 0.6878; the instrument is moving below Ichimoku Cloud, thus indicating a descending tendency. The markets could indicate that the price may test the cloud’s downside border at 0.6925 and then resume moving downwards to reach 0.6745. Another signal to confirm further descending movement is the price’s rebounding from the resistance level. However, the scenario that implies further decline may be canceled if the price breaks the cloud’s upside border and fixes above 0.6975. In this case, the pair may continue growing towards 0.7055. After breaking the support area and fixing below 0.6825, the price may continue moving downwards and complete Head & Shoulders reversal pattern.

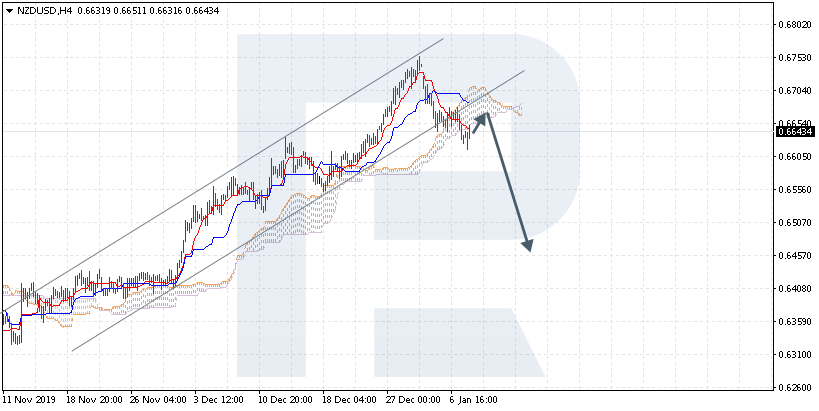
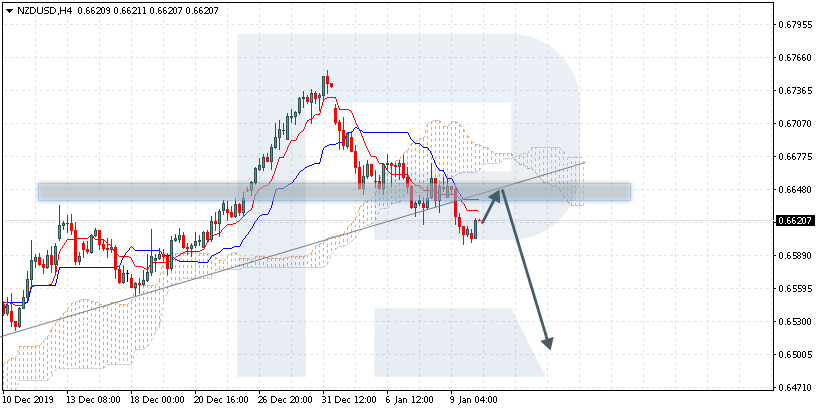
NZDUSD, “New Zealand Dollar vs US Dollar”
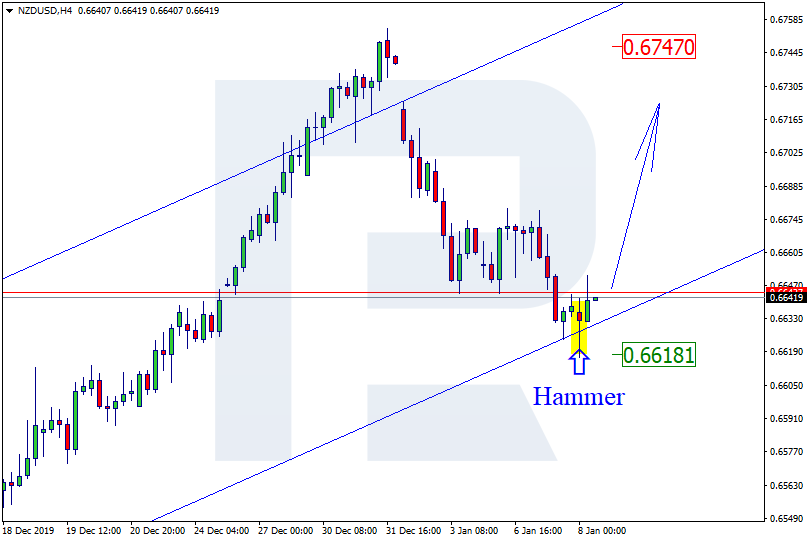
NZDUSD is trading at 0.6620; the instrument is moving below Ichimoku Cloud, thus indicating a descending tendency. The markets could indicate that the price may test Tenkan-Sen and Kijun-Sen at 0.6650 and then resume moving downwards to reach 0.6505. Another signal to confirm further descending movement is the price’s rebounding from the trend line. However, the scenario that implies further decline may be canceled if the price breaks the cloud’s upside border and fixes above 0.6715. In this case, the pair may continue growing towards 0.6805.
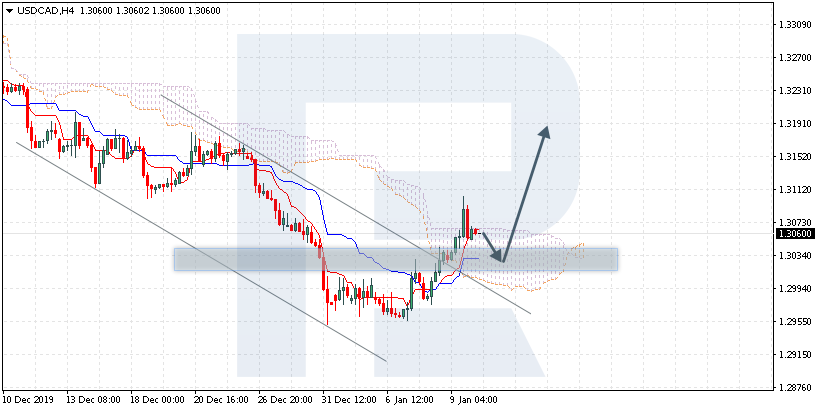
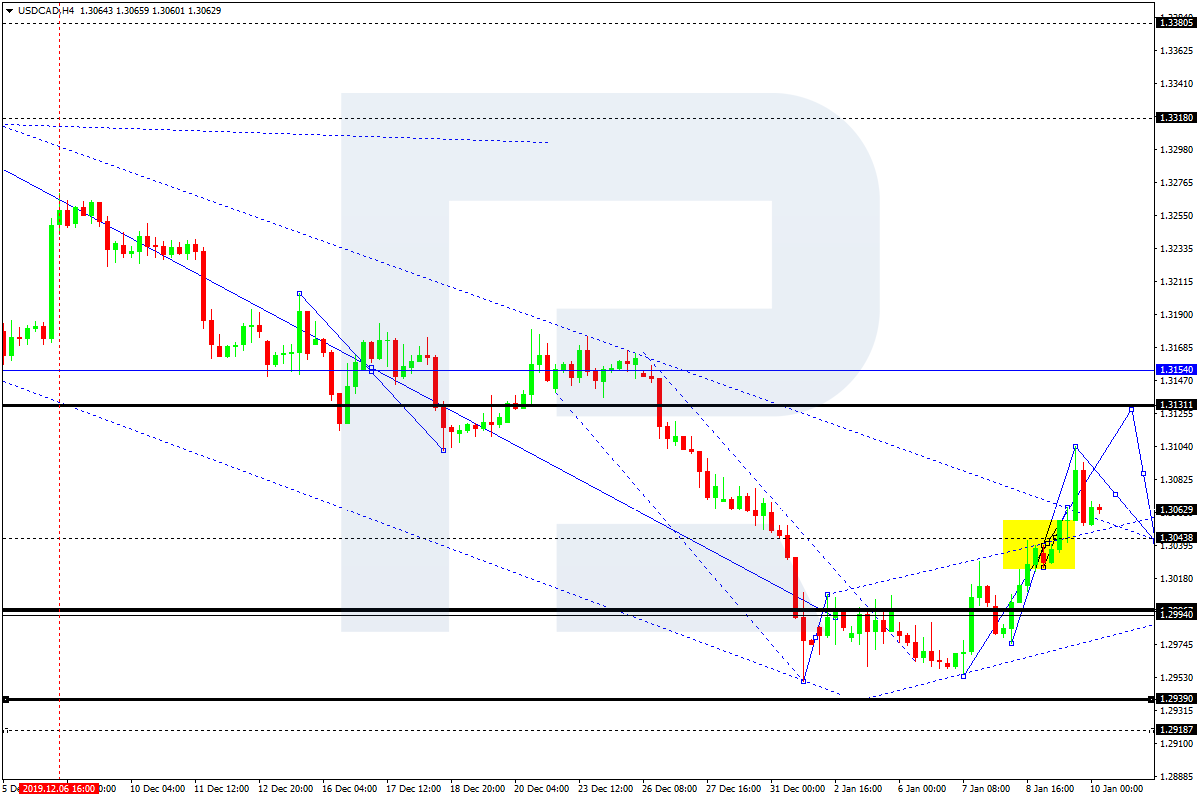
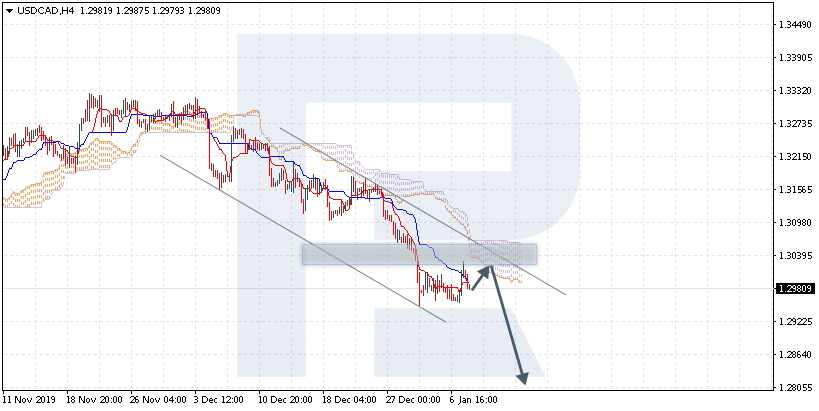
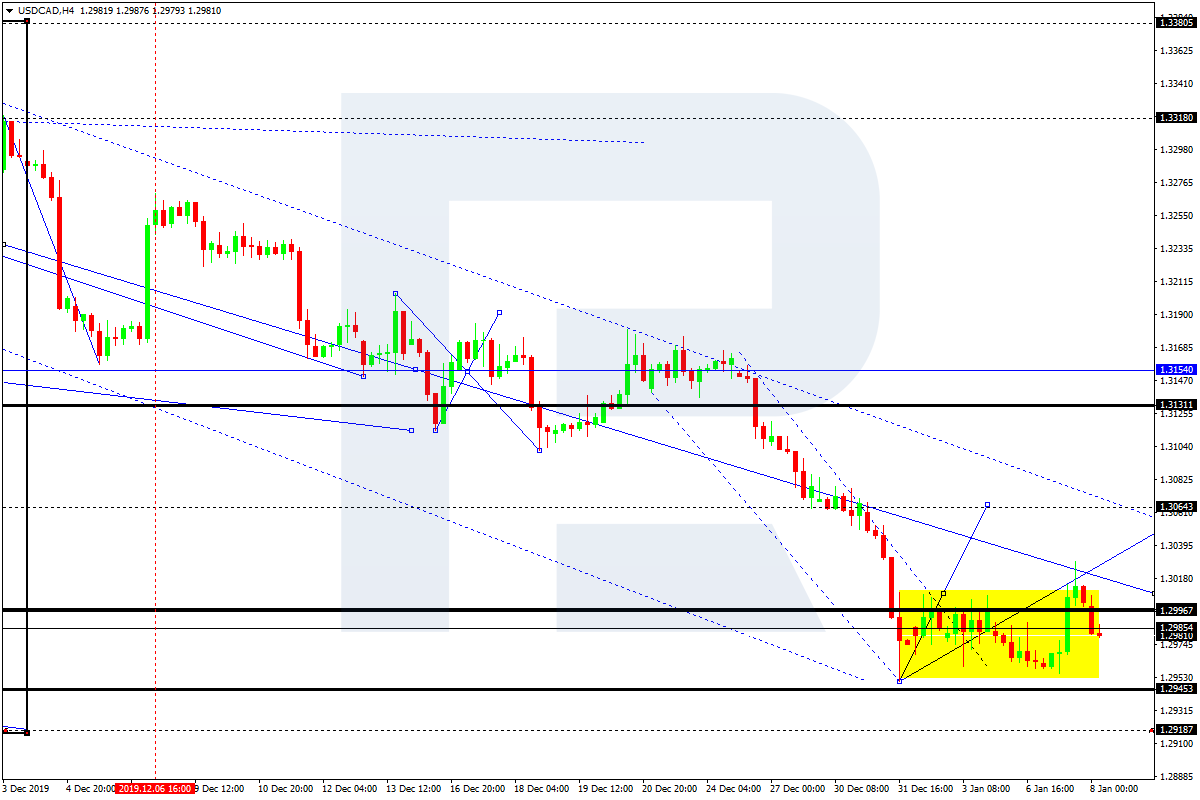
USDCAD, “US Dollar vs Canadian Dollar”
USDCAD is trading at 1.3060; the instrument is moving inside Ichimoku Cloud, thus indicating a sideways tendency. The markets could indicate that the price may test Tenkan-Sen and Kijun-Sen at 1.3035 and then resume moving upwards to reach 1.3195. Another signal to confirm further ascending movement is the price’s rebounding from the support level. However, the scenario that implies further growth may be canceled if the price breaks the cloud’s downside border and fixes below 1.2955. In this case, the pair may continue falling towards 1.2875.