Ichimoku Cloud Analysis 17.04.2020 (NZDUSD, USDCAD, XAUUSD)

Ichimoku Cloud Analysis 17.04.2020 (NZDUSD, USDCAD, XAUUSD)

17.04.2020

NZDUSD, “New Zealand Dollar vs US Dollar”

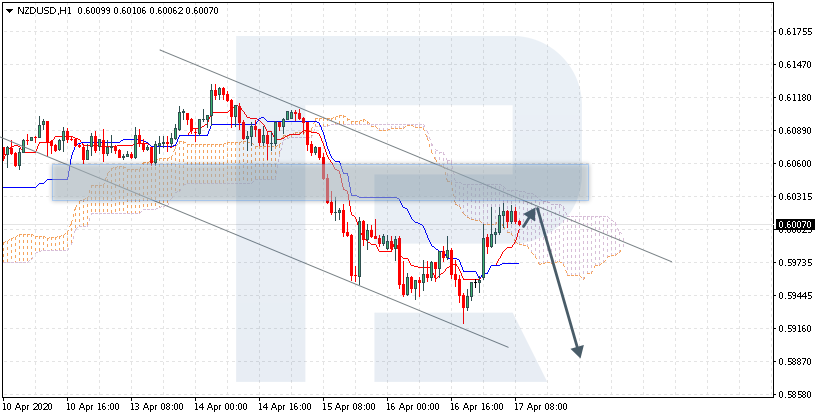
NZDUSD is trading at 0.6007; the instrument is moving inside Ichimoku Cloud, thus indicating a sideways tendency. The markets could indicate that the price may test the cloud’s upside border at 0.6015 and then resume moving downwards to reach 0.5885. Another signal to confirm further descending movement is the price’s rebounding from the descending channel’s upside border. However, the scenario that implies further decline may be canceled if the price breaks the cloud’s upside border and fixes above 0.6060. In this case, the pair may continue growing towards 0.6140. After breaking the cloud’s downside border and fixing below 0.5945, the price may resume moving downwards.
NZDUSD
Risk Warning: the result of previous trading operations do not guarantee the same results in the future

USDCAD

USDCAD is trading at 1.4030; the instrument is moving inside Ichimoku Cloud, thus indicating a sideways tendency. The markets could indicate that the price may test the cloud’s downside border at 1.3990 and then resume moving upwards to reach 1.4220. Another signal to confirm further ascending movement is the price’s rebounding from the support level. However, the scenario that implies further growth may be canceled if the price breaks the cloud’s downside border and fixes below 1.3975. In this case, the pair may continue falling towards 1.3895. After breaking the cloud’s upside border and fixing above 1.4115, the price may resume moving upwards.

USDCAD
Risk Warning: the result of previous trading operations do not guarantee the same results in the future

XAUUSD, “Gold vs US Dollar”

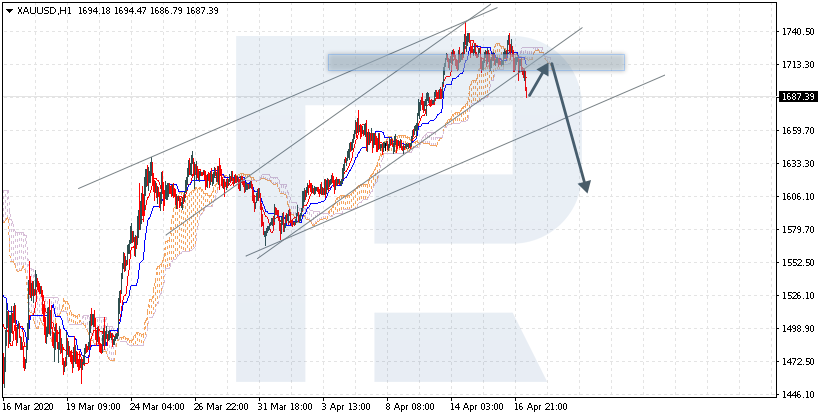
XAUUSD is trading at 1687.00; the instrument is moving below Ichimoku Cloud, thus indicating a bearish tendency. The markets could indicate that the price may test the cloud’s downside border at 1713.00 and then resume moving downwards to reach 1605.00. Another signal to confirm further descending movement is the price’s rebounding from the rising channel’s downside border. However, the scenario that implies further decline may be canceled if the price breaks the cloud’s upside border and fixes above 1740.00. In this case, the pair may continue growing towards 1785.00. After breaking the rising channel’s downside border and fixing below 1655.00, the price may resume moving downwards.
GOLD

Japanese Candlesticks Analysis 17.04.2020 (GOLD, NZDUSD, GBPUSD)

Japanese Candlesticks Analysis 17.04.2020 (GOLD, NZDUSD, GBPUSD)

17.04.2020

XAUUSD, “Gold vs US Dollar”

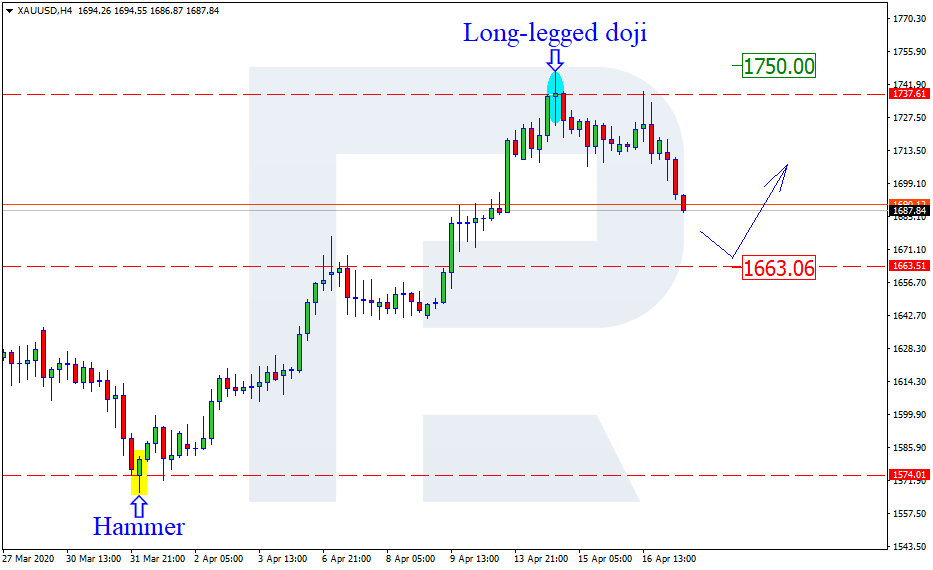
As we can see in the H4 chart, after testing another resistance level and forming several reversal patterns, such as Long-Legged Doji, Gold is reversing. The downside target is the support level at 1663.06. Later, the pair may rebound from the support level and resume the rising tendency. In this case, the upside target may be at 1750.00.

GOLD
Risk Warning: the result of previous trading operations do not guarantee the same results in the future

NZDUSD, “New Zealand vs. US Dollar”

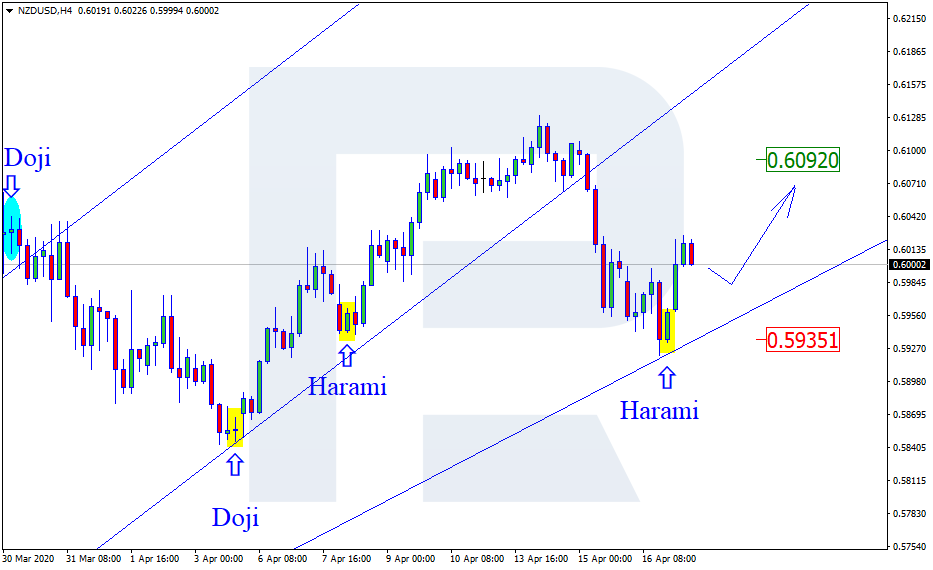
As we can see in the H4 chart, the price is no longer moving inside the rising channel. After testing the support level and finishing a Harami reversal pattern, NZDUSD is reversing. Possibly, the pair complete the correction and resume trading upwards to reach the target at 0.6092. Still, one shouldn’t exclude another scenario, which says that the instrument may fall and return to 0.5935.

NZDUSD
Risk Warning: the result of previous trading operations do not guarantee the same results in the future

GBPUSD, “Great Britain Pound vs US Dollar”

As we can see in the H4 chart, the pair continues growing within the rising channel. By now, GBPUSD has formed several reversal patterns, such as Harami, close to the support level. At the moment, the pair is reversing and may later resume growing with the target at 1.2623. However, there is another scenario, which implies that the instrument may fall and test 1.2377.

GBPUSD

The Euro remains under pressure. Overview for 17.04.2020

The Euro remains under pressure. Overview for 17.04.2020

17.04.2020

The major currency pair has been falling for the third consecutive trading session; market players are very cautious.

They continue selling EURUSD on Friday morning. The current quote for the instrument is 1.0834.

The statistics published by the USA yesterday showed that the American labor market started recovering a little bit. The Unemployment Claims was 5.245M after begin 6.615M the week before (revised) and against the expected reading of 5.35M. The service industry remains a job killer for many people, but the tendency is slowing down and that’s a very good signal.

The Building Permits in the USA was 1.35M in March, which is worse than the February reading of 1.45M, but better than market expectations of 1.3M. Another report, the Housing Starts, showed 1.22M after being 1.56M in February. However, everything is quite logical: when the country introduced restrictions on population movement in order to control the coronavirus outbreak, a lot of business processes were also put on hold.

There won’t be many numbers from the USA in today’s economic calendar, only the CB Leading Index for March, which is not expected to be impressive. However, in the afternoon, the Euro Area is scheduled to publish the final report on the Consumer Price Index in March, which earlier was 0.7% y/y and is not expected to change. The Core CPI may also remain unchanged at 1.0% y/y. A slump in European inflation is a result of lowering prices for energy commodities and a decline in consumption – it’s rather difficult to spend money when you’re staying at home, or worse, at a hospital. These factors remain in effect, thus indicating a high pressure on the CPI. It might count against the Euro.

rfxsignals April 17, 2020 No Comments

Daily Free Forex Signals For 17/04/2020

Here your going to see Daily Free Forex Signals For 17/04/2020 to free forex signal alert from our kitkat trading system and other trading logic’s .we provide like this free forex signals from 2012 on wards with more than 50,000 traders around the world .The free forex signals have 70 to 85% quality always .we give for you a note as maximum focus take profit 1 as your target and must use stop loss values .if you have any other query’s please visit our live chat or email option


USDJPY SELL-107.631
SL-108.094
TP1-107.437
TP2-107.199

EURJPY SELL-116.836
SL-117.289
TP1-116.640
TP2-116.473

AUDJPY SELL-68.306
SL-69.993
TP1-68.073
TP2-67.786

EURGBP SELL-0.86854
SL-0.87295
TP1-0.86630
TP2-0.86388

EURUSD SELL-1.08343
SL-1.08784
TP1-1.08108
TP2-1.07844

USDCHF BUY-0.97137
SL-0.96522
TP1-0.97373
TP2-0.97591

CADJPY SELL-76.552
SL-76.944
TP1-76.367
TP2-76.157

CHFJPY SELL-110.838
SL-111.303
TP1-110.591
TP2-110.360

GBPAUD BUY -1.96910
SL-1.96073
TP1-1.97197
TP2-1.97545

AUDCAD SELL-0.88871
SL-0.89519
TP1-0.88598
TP2-0.88295
#mt4 #forex #forextrader #trading #forextrading #bitcoin
#trader #cryptocurrency #forexlifestyle #entrepreneur
#crypto #forexsignal #investment #business #binaryoption
#passiveincome #daytrader #btc

Murrey Math Lines 16.04.2020 (USDCHF, GOLD)

Murrey Math Lines 16.04.2020 (USDCHF, GOLD)

16.04.2020

XAUUSD, “Gold vs US Dollar”

As we can see in the H4 chart, XAUUSD has rebounded from the strong resistance at 8/8. In this case, the price is expected to continue falling to reach 5/8. However, this scenario may no longer be valid if the price breaks the resistance at 7/8 to the upside. After that, the instrument may continue growing to return to 8/8.

GOLD_H4
Risk Warning: the result of previous trading operations do not guarantee the same results in the future

In the M15 chart, the pair may break the downside line of the VoltyChannel indicator and, as a result, continue trading downwards.

GOLD_M15
Risk Warning: the result of previous trading operations do not guarantee the same results in the future

USDCHF, “US Dollar vs Swiss Franc”

In the H4 chart, there was a false breakout of 7/8. In this case, the price is expected to grow towards the resistance at 8/8. However, this scenario may no longer be valid if the price breaks 7/8 to the downside. After that, the instrument may continue falling to reach the support at 6/8.

GOLD_H4
Risk Warning: the result of previous trading operations do not guarantee the same results in the future

As we can see in the M15 chart, the pair has broken the upside line of the VoltyChannel indicator and, as a result, may continue the ascending tendency towards 8/8 from the H4 chart.

USDCHF_M15

Forex Technical Analysis & Forecast 16.04.2020

Forex Technical Analysis & Forecast 16.04.2020

16.04.2020

EURUSD, “Euro vs US Dollar”

After finishing the descending impulse at 1.0860 along with the correction towards 1.0938, EURUSD is moving downwards to reach 1.0848. Later, the market may form a new consolidation range. After breaking the range to the downside, the instrument may start another decline with the short-term target at 1.0795.

EURUSD
Risk Warning: the result of previous trading operations do not guarantee the same results in the future

GBPUSD, “Great Britain Pound vs US Dollar”

After completing the descending impulse at 1.2440 along with the correction towards 1.2570, GBPUSD is forming the second descending impulse to reach 1.2425. After that, the instrument may form a new consolidation range. If later the price breaks this range to the downside, the market may resume trading downwards with the short-term target at 1.2330.

GBPUSD
Risk Warning: the result of previous trading operations do not guarantee the same results in the future

USDRUB, “US Dollar vs Russian Ruble”

After forming the consolidation range below 74.34 and breaking it to the upside, USDRUB is moving upwards to reach 75.75. According to the main scenario, the price is expected to reach this level and then resume trading downwards to break 72.90. Later, the market may continue falling towards the target at 68.00.

USDRUB
Risk Warning: the result of previous trading operations do not guarantee the same results in the future

USDJPY, “US Dollar vs Japanese Yen”

After rebounding from 107.25 to the upside, USDJPY is moving to break 107.75. Possibly, today the pair may grow to reach the short-term target at 108.35. After that, the instrument may correct to return to 107.75 and then start another growth with the target at 108.68.

USDJPY
Risk Warning: the result of previous trading operations do not guarantee the same results in the future

USDCHF, “US Dollar vs Swiss Franc”

USDCHF is growing towards 0.9700. Possibly, the pair may reach 0this level and then form a new consolidation range. Later, the market may break the range to the upside and resume growing with the target at 0.9770..

USDCHF
Risk Warning: the result of previous trading operations do not guarantee the same results in the future

AUDUSD, “Australian Dollar vs US Dollar”

AUDUSD is falling towards 0.6255. Today, the pair may reach this level and then form a new consolidation range. Later, the market may break the range to the downside and resume trading downwards with the target at 0.6197.

AUDUSD
Risk Warning: the result of previous trading operations do not guarantee the same results in the future

BRENT

After finishing another descending structure at 26.30, Brent is consolidating below this level. Possibly, the pair may form one more ascending structure towards 28.40 and then resume falling to reach 27.30. Later, the market may start another growth with the target at 30.80..

BRENT
Risk Warning: the result of previous trading operations do not guarantee the same results in the future

XAUUSD, “Gold vs US Dollar”

Gold has completed the descending impulse at 1706.66. Possibly, today the pair may correct towards 1728.18, thus forming a new consolidation range between these two levels. If later the price breaks this range to the downside, the market may form a new descending structure to reach 1687.90; if to the upside – resume trading inside the uptrend to with the target at 1770.00.

GOLD
Risk Warning: the result of previous trading operations do not guarantee the same results in the future

BTCUSD, “Bitcoin vs US Dollar”

After completing the descending structure at 6700.00 and forming another consolidation range, BTCUSD has broken it to the downside to reach 6460.00; right now, it is growing to return to 6700.00. After that, the instrument may resume falling towards 6600.00 and then form one more ascending structure with the short-term target at 6900.00.

BITCOIN
Risk Warning: the result of previous trading operations do not guarantee the same results in the future

S&P500

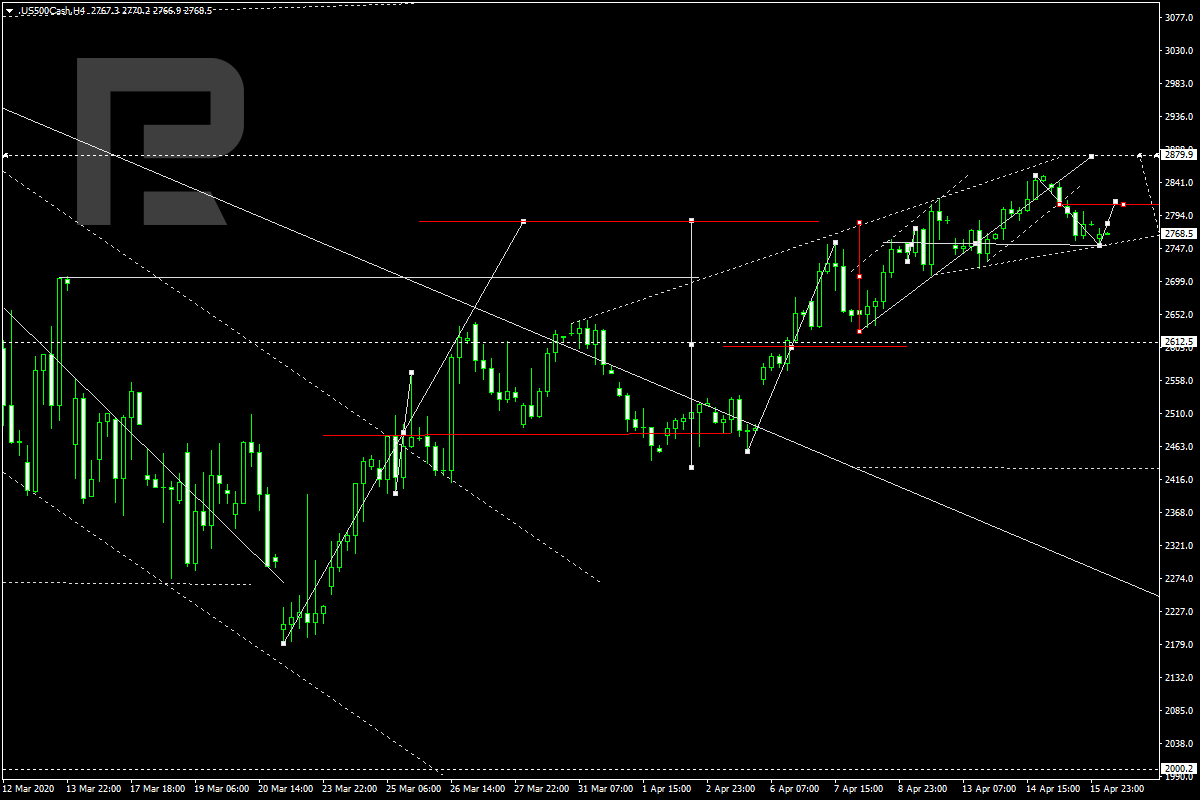
S&P 500 has completed the descending impulse at 2754.0. Today, the instrument may reach 2814.5, thus forming a new consolidation range between these two levels. If later the price breaks this range to the upside, the market may start another growth to reach 2877.5; if to the downside – resume trading downwards with the first target at 2612.5.

S&P500

Ichimoku Cloud Analysis 16.04.2020 (AUDUSD, USDCAD, XAUUSD)

Ichimoku Cloud Analysis 16.04.2020 (AUDUSD, USDCAD, XAUUSD)

16.04.2020

AUDUSD, “Australian Dollar vs US Dollar”

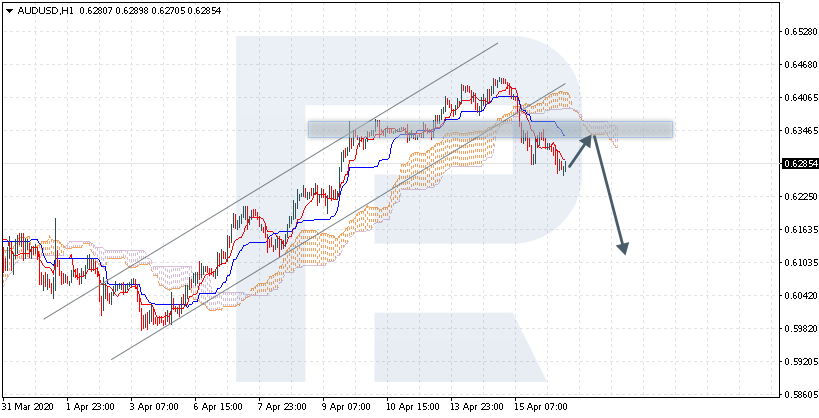
AUDUSD is trading at 0.6285; the instrument is moving below Ichimoku Cloud, thus indicating a bearish tendency. The markets could indicate that the price may test the cloud’s downside border at 0.6330 and then resume moving downwards to reach 0.6105. Another signal to confirm further descending movement is the price’s rebounding from the resistance level. However, the scenario that implies further decline may be canceled if the price breaks the cloud’s upside border and fixes above 0.6225. In this case, the pair may continue growing towards 0.6485.

AUDUSD
Risk Warning: the result of previous trading operations do not guarantee the same results in the future

USDCAD, “US Dollar vs Canadian Dollar”

USDCAD is trading at 1.4111; the instrument is moving above Ichimoku Cloud, thus indicating a bullish tendency. The markets could indicate that the price may test the cloud’s upside border at 1.4035 and then resume moving upwards to reach 1.4215. Another signal to confirm further ascending movement is the price’s rebounding from the support level. However, the scenario that implies further growth may be canceled if the price breaks the cloud’s downside border and fixes below 1.3945. In this case, the pair may continue falling towards 1.3865.

USDCAD
Risk Warning: the result of previous trading operations do not guarantee the same results in the future

XAUUSD, “Gold vs US Dollar”

XAUUSD is trading at 1714.00; the instrument is moving inside Ichimoku Cloud, thus indicating a sideways tendency. The markets could indicate that the price may test the cloud’s downside border at 1710.00 and then resume moving upwards to reach 1775.00. Another signal to confirm further ascending movement is the price’s rebounding from the rising channel’s downside border. However, the scenario that implies further growth may be canceled if the price breaks the cloud’s downside border and fixes below 1695.00. In this case, the pair may continue falling towards 1645.00. After breaking the cloud’s upside border and fixing above 1730.00, the price may resume moving upwards.

GOLD

Ichimoku Cloud Analysis 16.04.2020 (AUDUSD, USDCAD, XAUUSD)

Ichimoku Cloud Analysis 16.04.2020 (AUDUSD, USDCAD, XAUUSD)

16.04.2020

AUDUSD, “Australian Dollar vs US Dollar”

AUDUSD is trading at 0.6285; the instrument is moving below Ichimoku Cloud, thus indicating a bearish tendency. The markets could indicate that the price may test the cloud’s downside border at 0.6330 and then resume moving downwards to reach 0.6105. Another signal to confirm further descending movement is the price’s rebounding from the resistance level. However, the scenario that implies further decline may be canceled if the price breaks the cloud’s upside border and fixes above 0.6225. In this case, the pair may continue growing towards 0.6485.

AUDUSD
Risk Warning: the result of previous trading operations do not guarantee the same results in the future

USDCAD, “US Dollar vs Canadian Dollar”

USDCAD is trading at 1.4111; the instrument is moving above Ichimoku Cloud, thus indicating a bullish tendency. The markets could indicate that the price may test the cloud’s upside border at 1.4035 and then resume moving upwards to reach 1.4215. Another signal to confirm further ascending movement is the price’s rebounding from the support level. However, the scenario that implies further growth may be canceled if the price breaks the cloud’s downside border and fixes below 1.3945. In this case, the pair may continue falling towards 1.3865.

USDCAD
Risk Warning: the result of previous trading operations do not guarantee the same results in the future

XAUUSD, “Gold vs US Dollar”

XAUUSD is trading at 1714.00; the instrument is moving inside Ichimoku Cloud, thus indicating a sideways tendency. The markets could indicate that the price may test the cloud’s downside border at 1710.00 and then resume moving upwards to reach 1775.00. Another signal to confirm further ascending movement is the price’s rebounding from the rising channel’s downside border. However, the scenario that implies further growth may be canceled if the price breaks the cloud’s downside border and fixes below 1695.00. In this case, the pair may continue falling towards 1645.00. After breaking the cloud’s upside border and fixing above 1730.00, the price may resume moving upwards.

GOLD

Japanese Candlesticks Analysis 16.04.2020 (EURUSD, USDJPY, EURGBP)

Japanese Candlesticks Analysis 16.04.2020 (EURUSD, USDJPY, EURGBP)

16.04.2020

EURUSD, “Euro vs. US Dollar”

As we can see in the H4 chart, EURUSD is no longer moving inside the rising channel. By now, after forming a Hammer pattern not far from the support level, EURUSD has completed another correction We may assume that later the price may rebound from the support level and then resume the ascending tendency. In this case, the upside target may be at 1.1030. At the same time, there is another scenario, which implies that the price may continue falling to reach 1.0830.

EURUSD
Risk Warning: the result of previous trading operations do not guarantee the same results in the future

USDJPY, “US Dollar vs. Japanese Yen”

As we can see in the H4 chart, after testing the support level, USDJPY has formed a Long-Legged Doji pattern; right now, it is reversing. The upside target may be at 109.00. however, the current situation implies that the instrument may yet resume falling towards 106.50 but this scenario is rather unlikely.

USDJPY
Risk Warning: the result of previous trading operations do not guarantee the same results in the future

EURGBP, “Euro vs. Great Britain Pound”

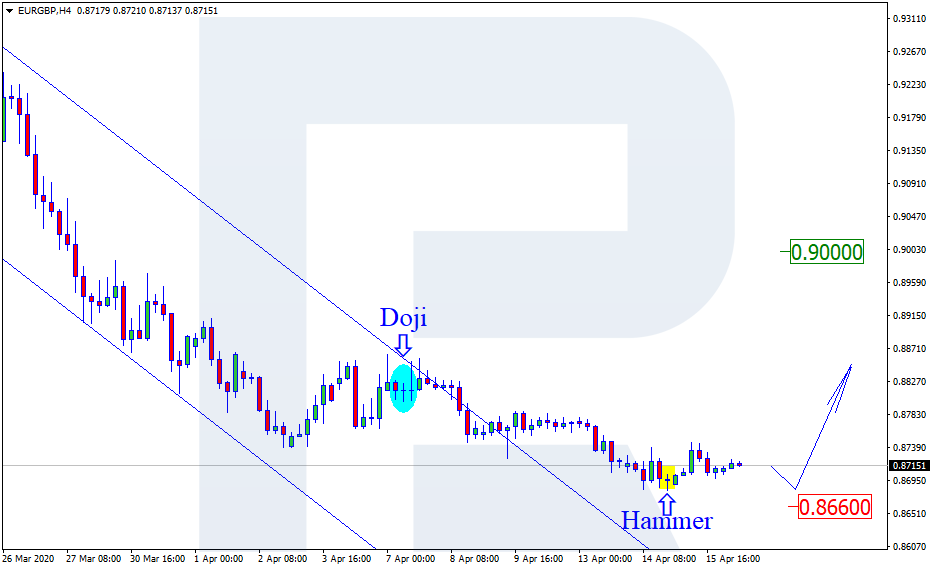
As we can see in the H4 chart, the pair continues moving sideways not far from another support level, where it has formed a Hammer pattern. We may assume that later EURGBP may continue falling to test the next support level at 0.8660n and then rebound from it to start a new ascending tendency. Still, one shouldn’t exclude an opposite scenario, which implies that the instrument may rebound from the current support level and resume growing. In both cases, the upside target will be at 0.9000.

EURGBP
Risk Warning: the result of previous trading operations do not guarantee the same results in the future

Fibonacci Retracements Analysis 16.04.2020 (AUDUSD, USDCAD)

Fibonacci Retracements Analysis 16.04.2020 (AUDUSD, USDCAD)

16.04.2020

AUDUSD, “Australian Dollar vs US Dollar”

As we can see in the H4 chart, the divergence on MACD made the pair complete the correctional uptrend at 76.0% fibo and start a new pullback to the downside. The key upside target may be the fractal high at 0.6684. However, the pair may test this level only after finishing the current pullback. The support is at 0.6235.

AUDUSD_H4
Risk Warning: the result of previous trading operations do not guarantee the same results in the future

In the H1 chart, AUDUSD is falling towards 23.6% fibo at 0.6223 after the divergence. The next downside targets may be 38.2% and 50.0% fibo at 0.6086 and 0.5976 respectively. The local resistance is at 0.6445.

AUDUSD_H1
Risk Warning: the result of previous trading operations do not guarantee the same results in the future

USDCAD, “US Dollar vs Canadian Dollar”

In the H4 chart, after updating the previous low, the correctional downtrend has failed to reach 38.2% fibo. Under such circumstances, a growth towards 23.6% fibo at 1.4262 may be a rather deceitful maneuver. However, if the price breaks this level, the instrument may continue trading upwards to reach the high at 1.4668.

USDCAD_H4
Risk Warning: the result of previous trading operations do not guarantee the same results in the future

As we can see in the H1 chart, the correctional uptrend is approaching 38.2% fibo at 1.4165. in the case of a stable growth, the instrument may reach 50.0%, 61.8%, and 76.0% fibo at 1.4263, 1.4357 and 1.4473 respectively. The support is the low at 1.3855.

USDCAD_H1
Risk Warning: the result of previous trading operations do not guarantee the same results in the future