Ichimoku Cloud Analysis 09.06.2020 (GBPUSD, USDCAD, AUDUSD)
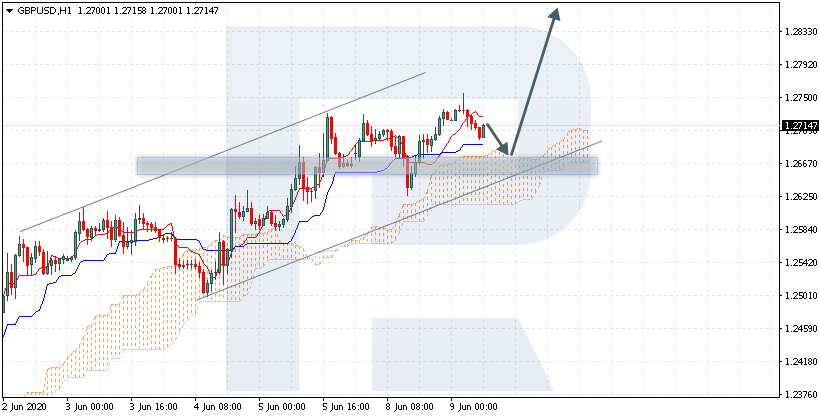
GBPUSD, “Great Britain Pound vs US Dollar”
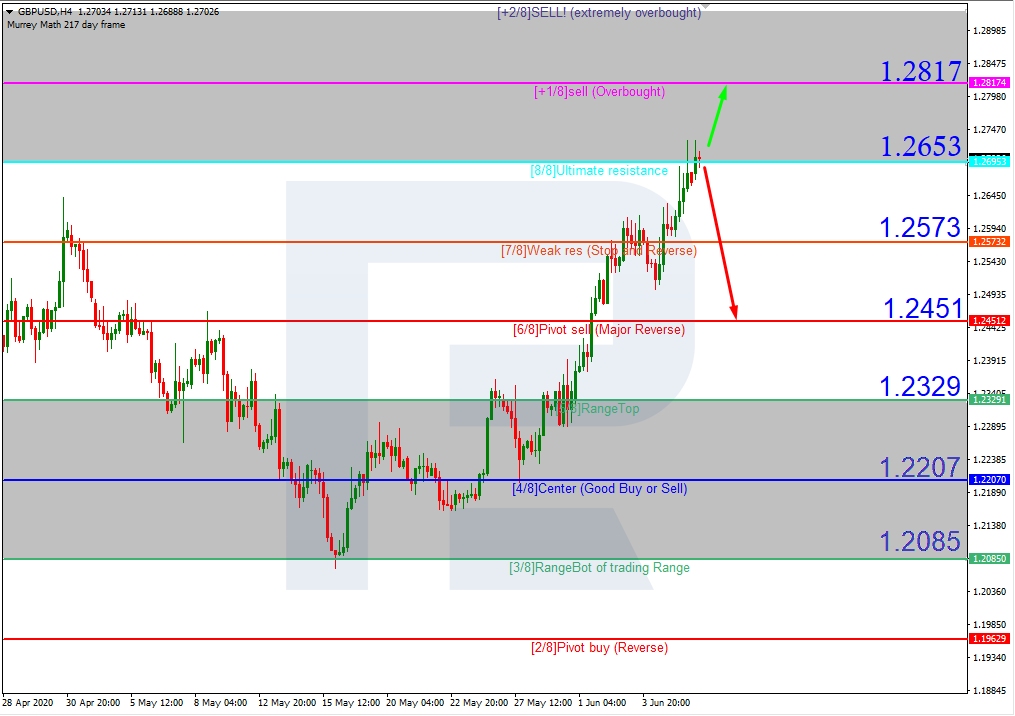
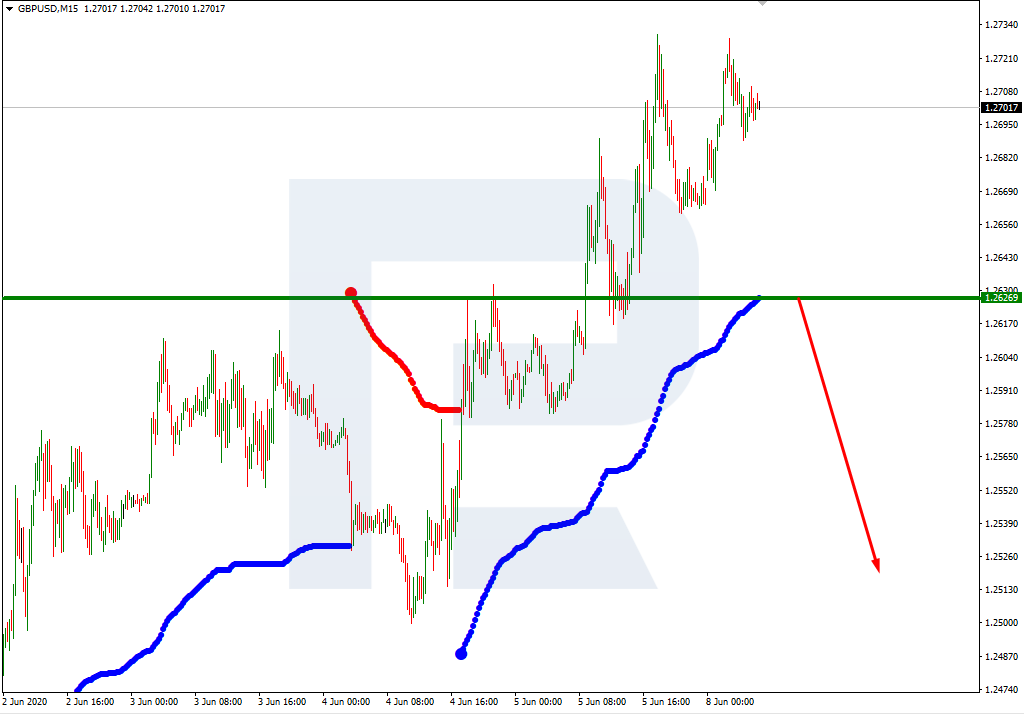
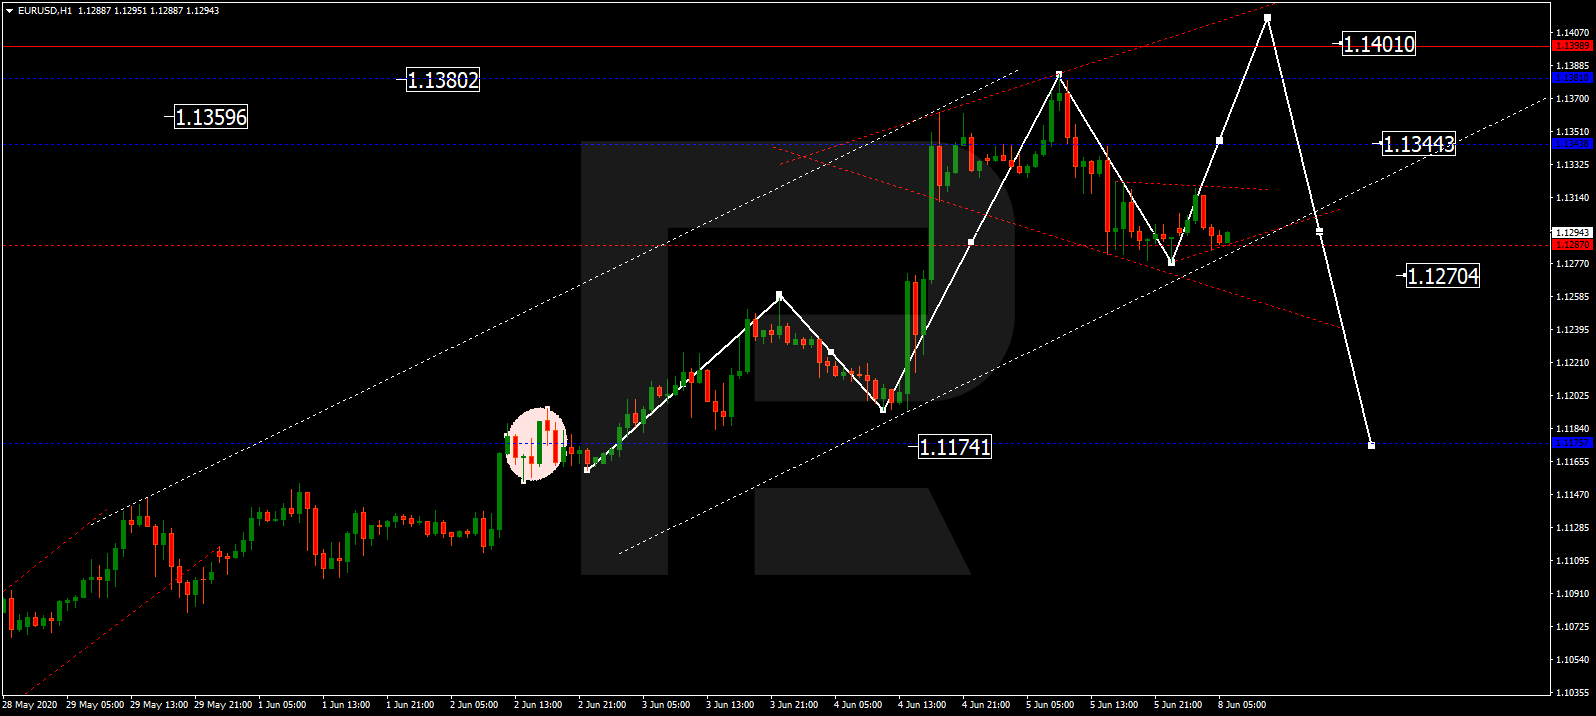
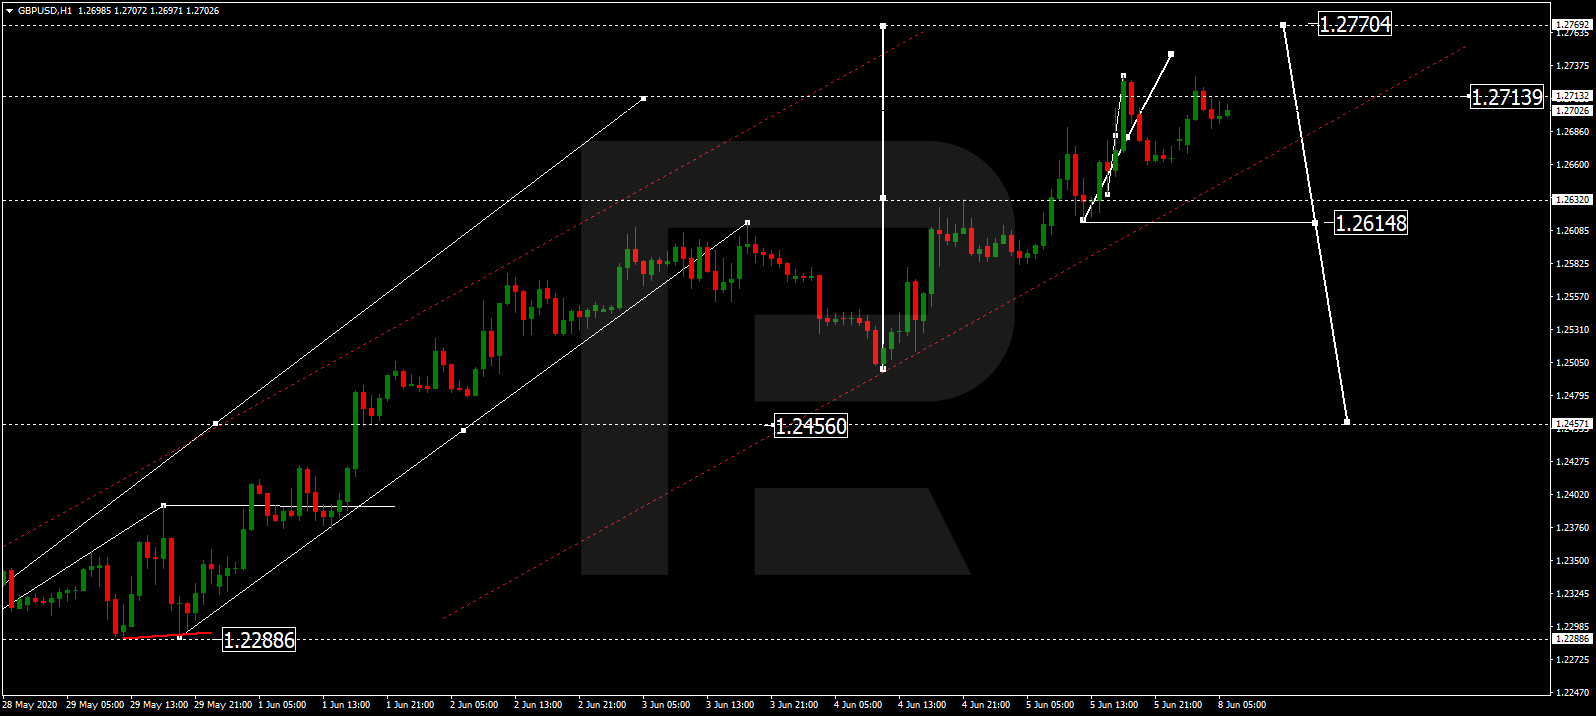
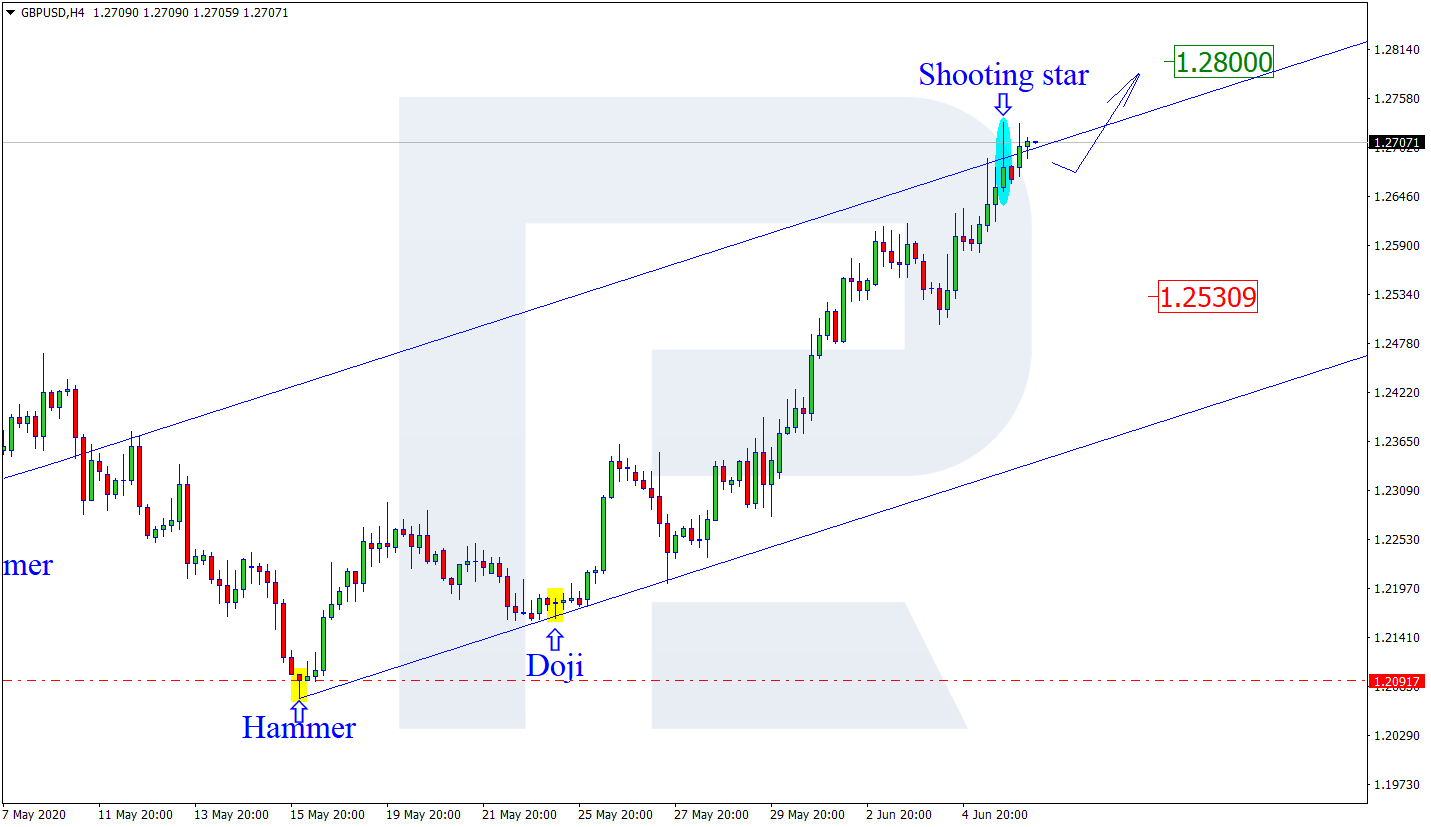
GBPUSD is trading at 1.2714; the instrument is moving above Ichimoku Cloud, thus indicating an ascending tendency. The markets could indicate that the price may test the cloud’s upside border at 1.2670 and then resume moving upwards to reach 1.2845. Another signal in favor of further uptrend will be a rebound from the rising channel’s downside border. However, the bullish scenario may no longer be valid if the price breaks the cloud’s downside border and fixes below 1.2585. In this case, the pair may continue falling towards 1.2495.
![]()
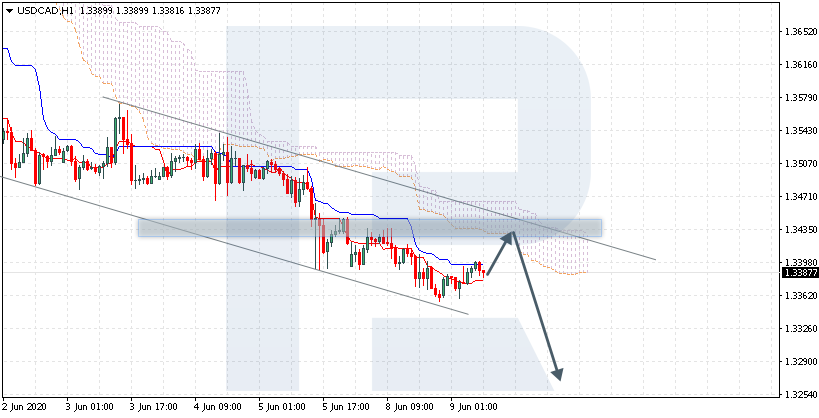
USDCAD, “US Dollar vs Canadian Dollar”
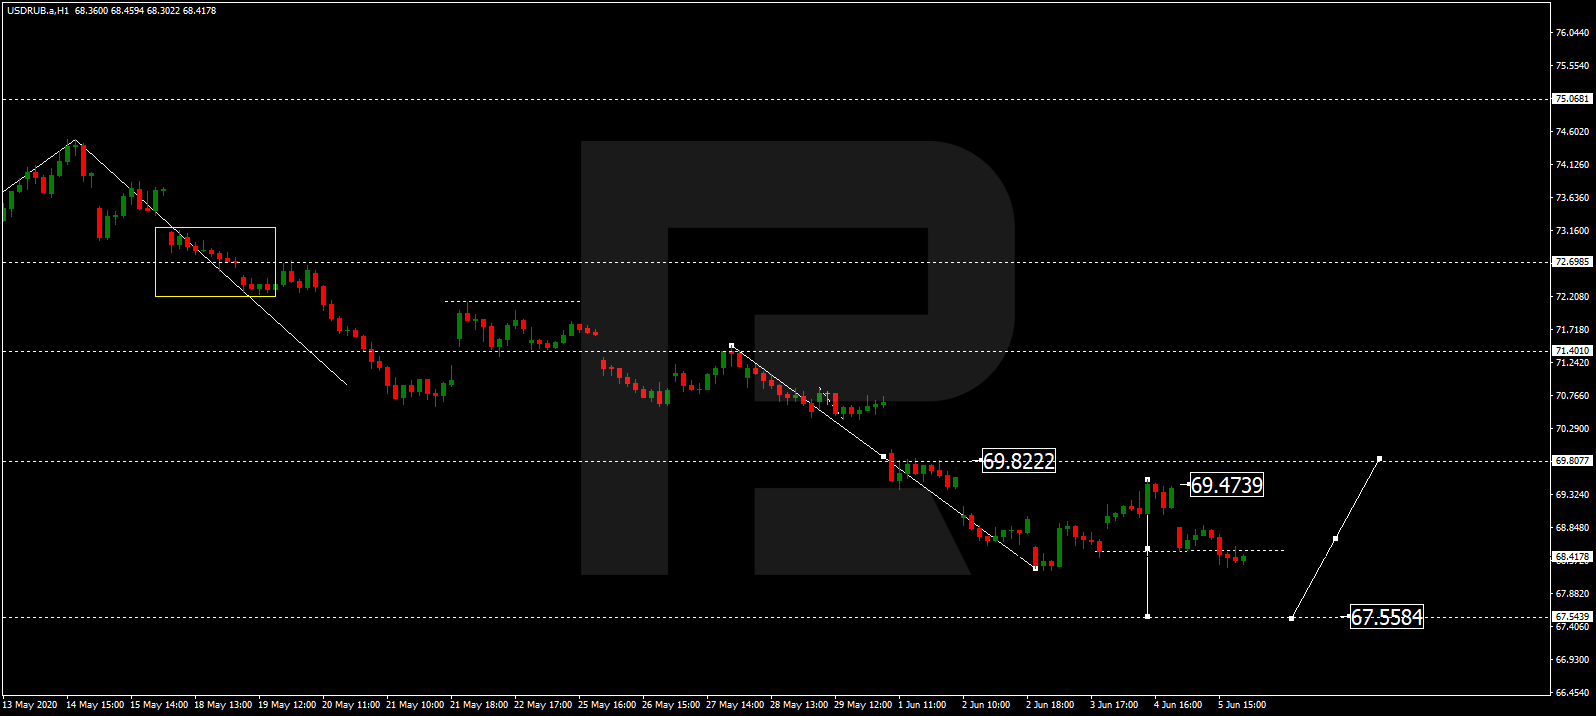
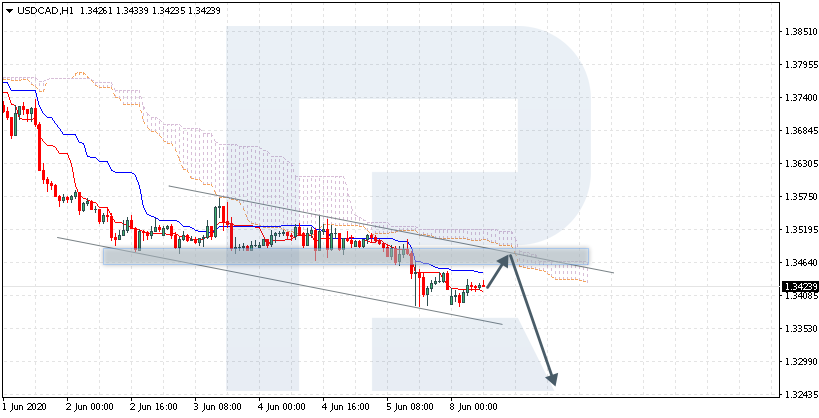
USDCAD is trading at 1.3387; the instrument is moving below Ichimoku Cloud, thus indicating a descending tendency. The markets could indicate that the price may test the cloud’s downside border at 1.3425 and then resume moving downwards to reach 1.3275. Another signal in favor of further downtrend will be a rebound from the descending channel’s upside border. However, the bearish scenario may no longer be valid if the price breaks the cloud’s upside border and fixes above 1.3505. In this case, the pair may continue growing towards 1.3595.
![]()
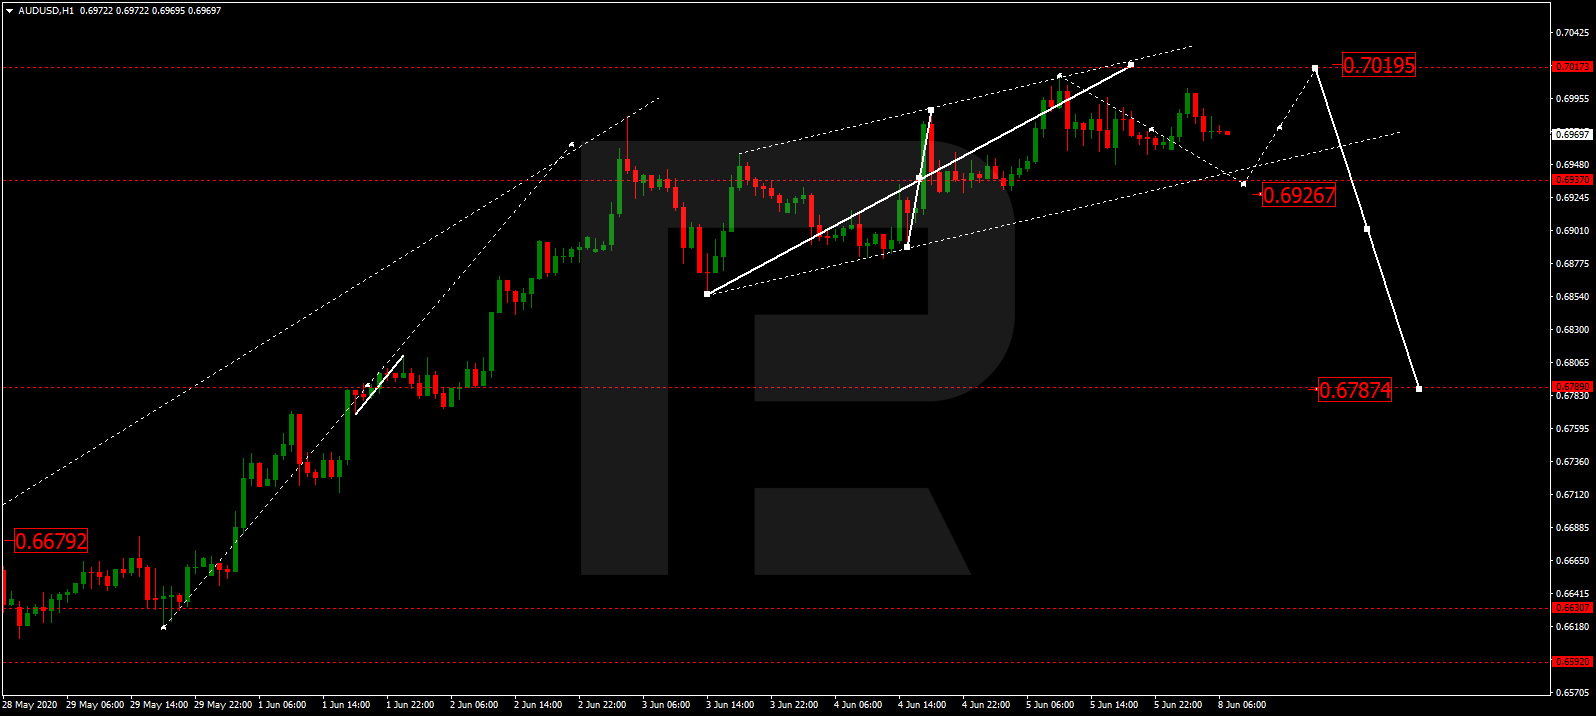
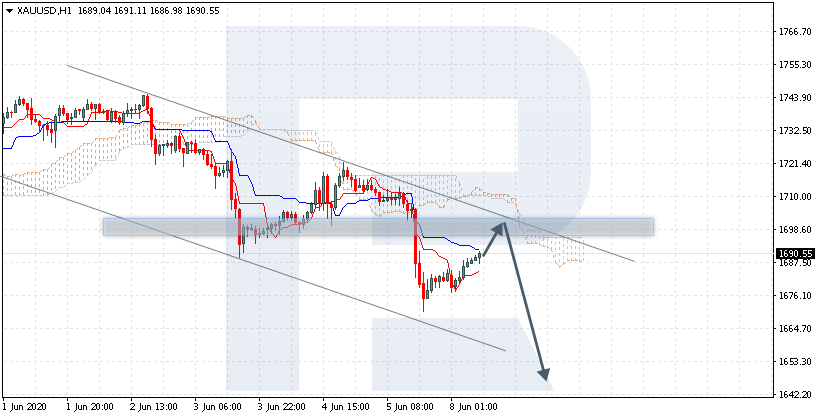
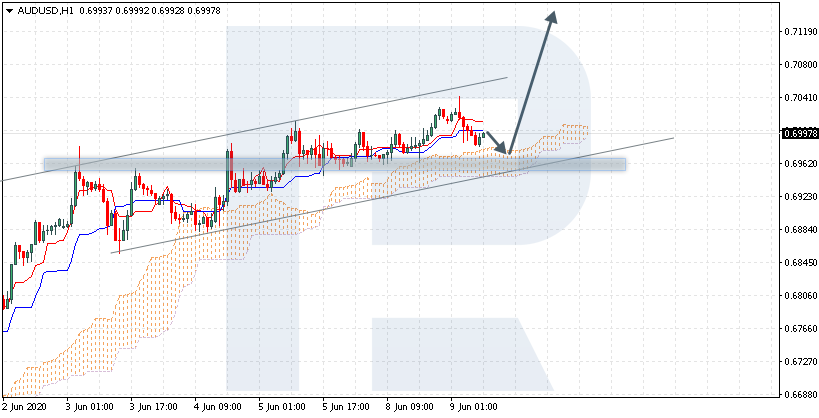
AUDUSD, “Australian Dollar vs US Dollar”
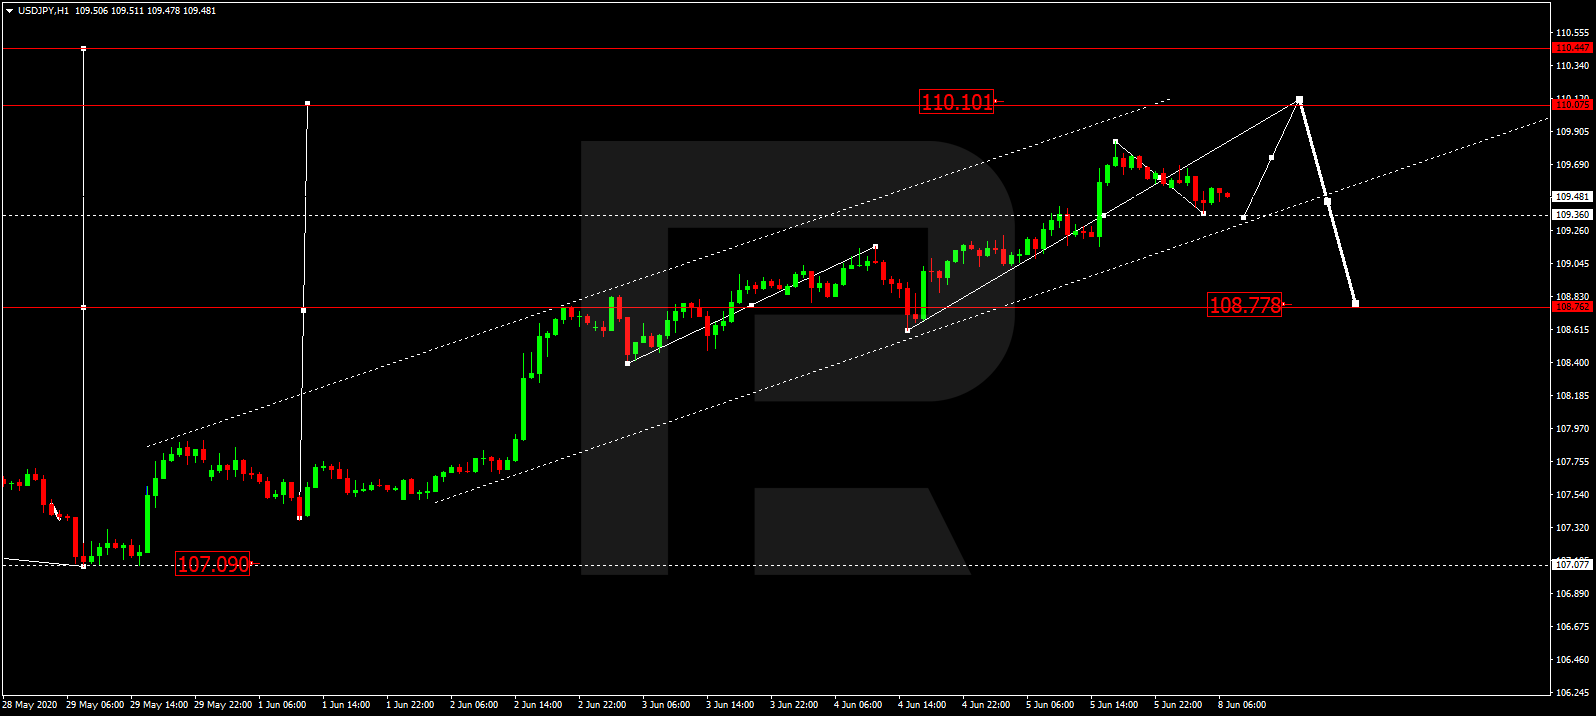
AUDUSD is trading at 0.6997; the instrument is moving above Ichimoku Cloud, thus indicating an ascending tendency. The markets could indicate that the price may test the cloud’s upside border at 0.6995 and then resume moving upwards to reach 0.7105. Another signal in favor of further uptrend will be a rebound from the rising channel’s downside border. However, the bullish scenario may no longer be valid if the price breaks the cloud’s downside border and fixes below 0.6920. In this case, the pair may continue falling towards 0.6830.
![]()