Fibonacci Retracements Analysis 15.01.2020 (GBPUSD, EURJPY)
GBPUSD, “Great Britain Pound vs US Dollar”
As we can see in the H4 chart, after completing the correctional uptrend at 61.8% fibo, GBPUSD is moving downwards. The closest downside target is the low at 1.2904. If later the price breaks this level, the instrument may start a proper descending wave towards 50.0% and 61.8% fibo at 1.2855 and 1.2700 respectively.


The H1 chart shows the convergence on MACD. As a result, right now the pair is starting a new short-term ascending correction towards 23.6% fibo. The next upside targets may be 38.2% and 50.0% fibo at 1.3052 and 1.3083 respectively.


EURJPY, “Euro vs. Japanese Yen”
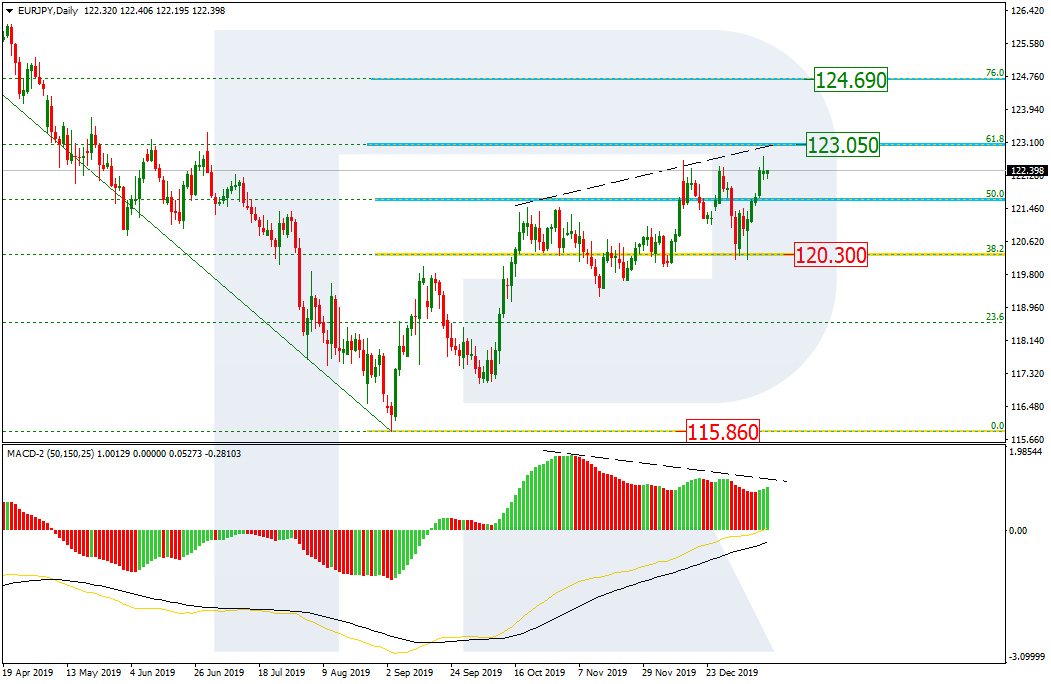
In the daily chart, after testing the support at 38.2% fibo and failing to fix there, EURJPY has updated the high. In the future, the instrument may continue trading upwards to reach 61.8% and 76.0% fibo at 123.05 and 124.69 respectively.


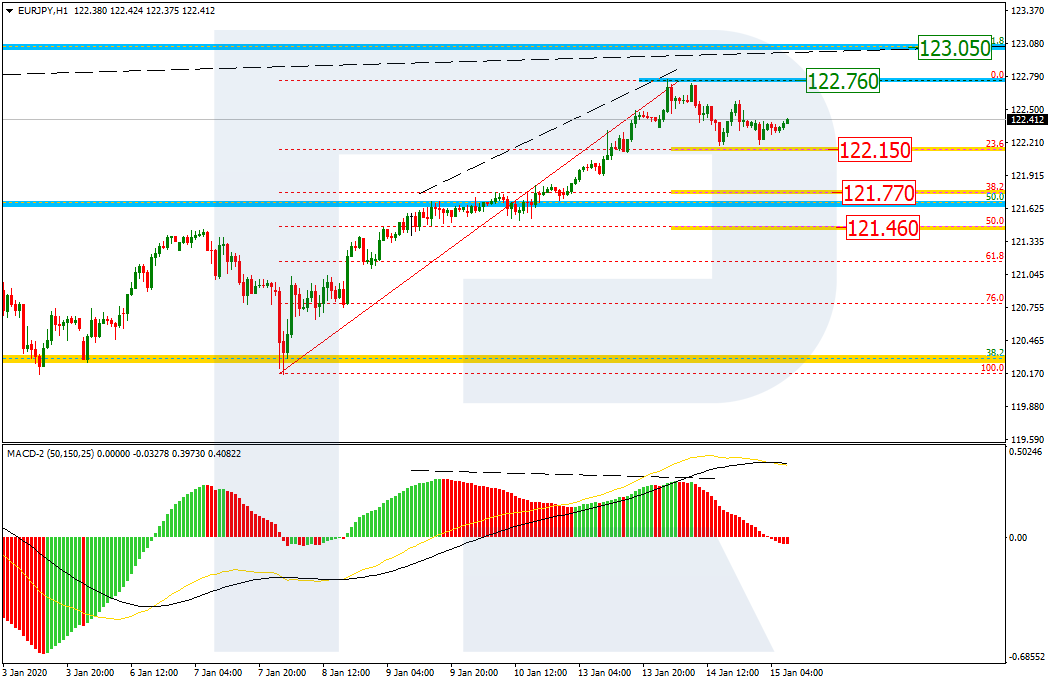
The H1 chart shows that the divergence made the pair start a new correction to the downside. The targets may be 23.6%, 38.2%, and 50.0% fibo at 122.15, 121.77, and 121.46 respectively. If the price breaks the resistance at 122.76, the mid-term growth will continue.

