Fibonacci Retracements Analysis 04.11.2019 (GOLD, USDCHF)

04.11.2019

XAUUSD, “Gold vs US Dollar”

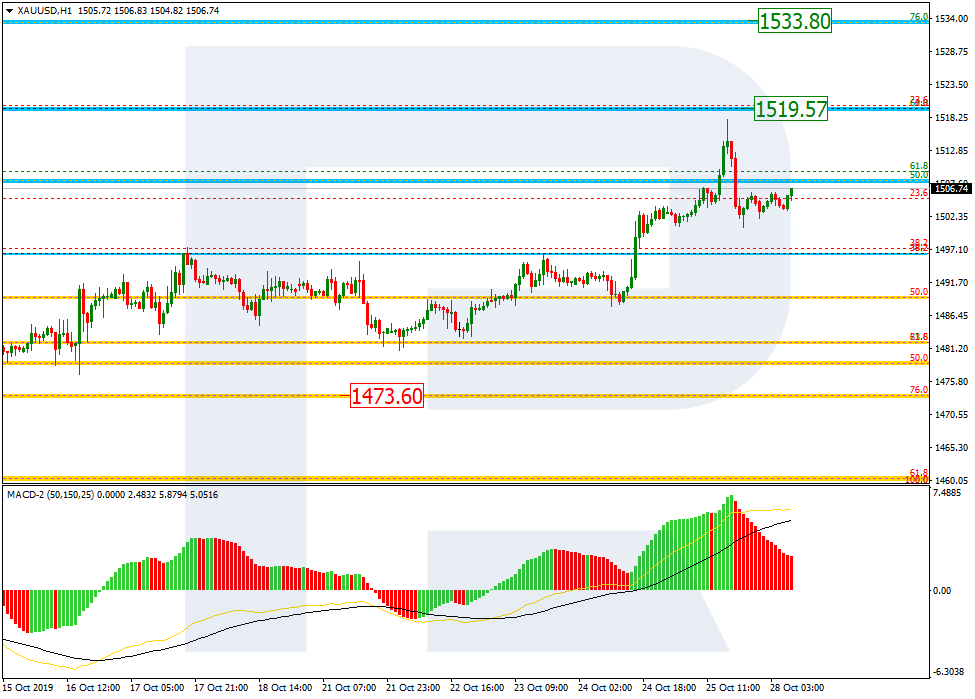
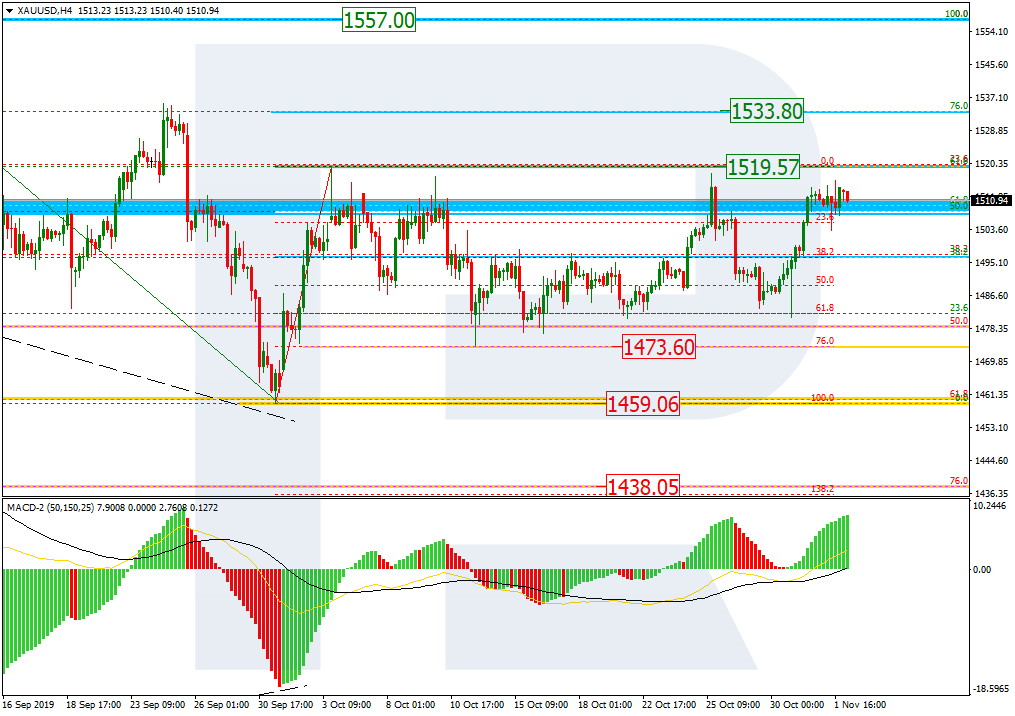
As we can see in the H4 chart, it’s been a month since the pair started moving sideways after the convergence. XAUUSD is getting closer to the high at 1519.57 and trying to break it for the third time. If the price breaks the high, the instrument may continue growing towards 76.0% fibo at 1533.08 and then the key high at 1557.00.

GOLD_H4
Risk Warning: the result of previous trading operations do not guarantee the same results in the future

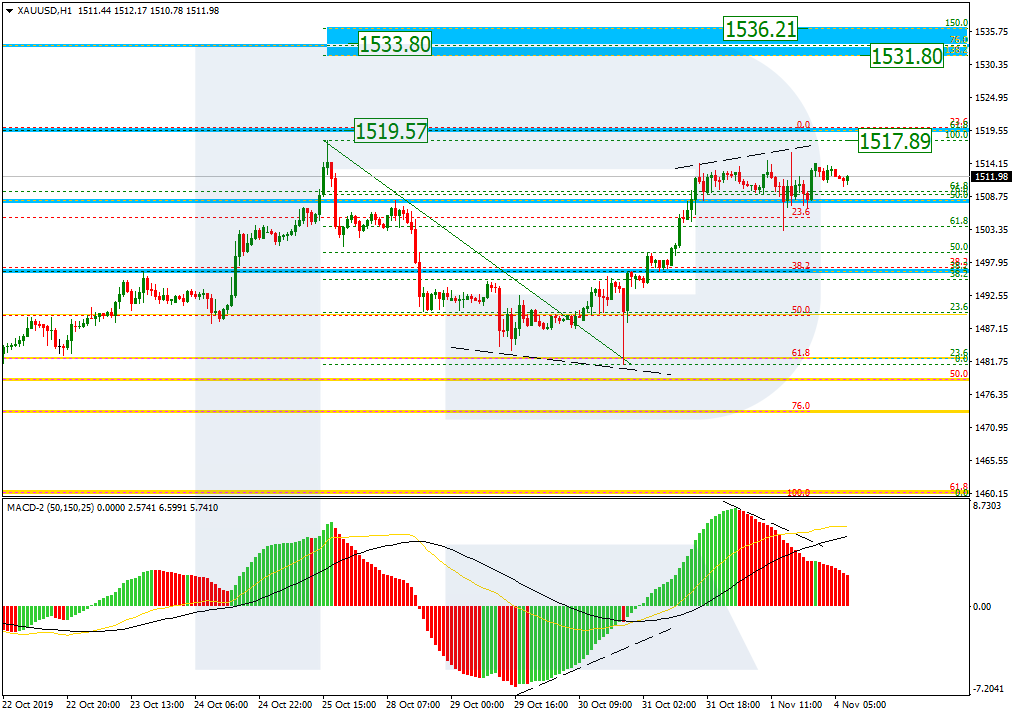
In the H1 chart, there is a convergence on MACD while the pair is trading close to the previous high at 1517.89, which means that the price is slowing down the current growth, which may be later followed by a new short-term pullback. If the instrument breaks the above-mentioned high, it may continue growing towards the post-correctional extension area between 138.2% and 161.8% fibo at 1531.80 and 1536.21 respectively.

GOLD_H1
Risk Warning: the result of previous trading operations do not guarantee the same results in the future

USDCHF, “US Dollar vs Swiss Franc”

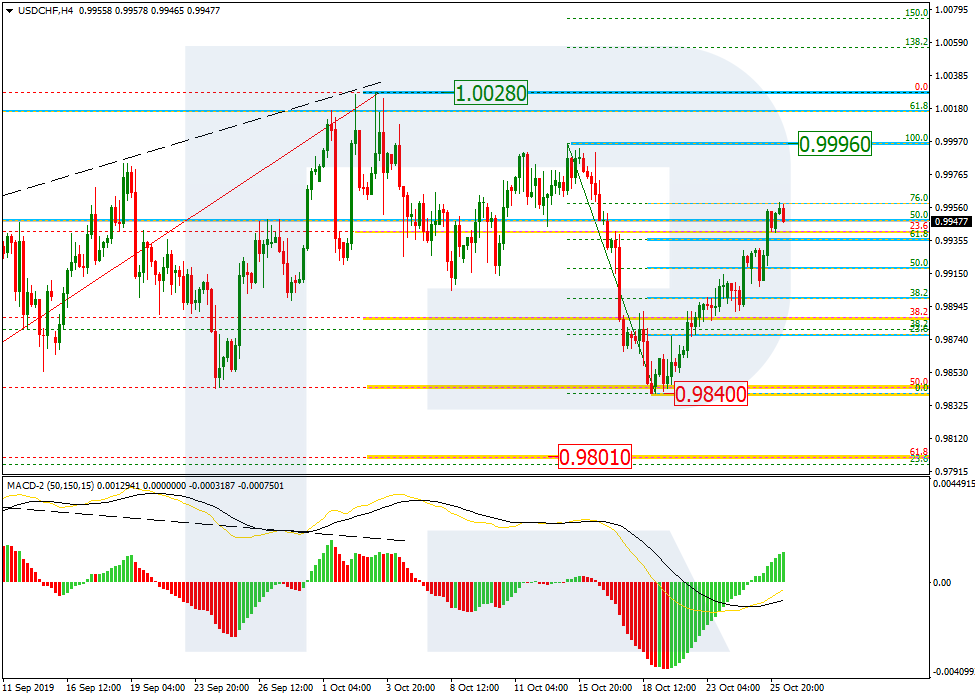
As we can see in the H4 chart, another descending impulse is heading towards the fractal low at 0.9840. If USDCHF breaks this level, the instrument may continue the mid-term descending tendency towards 61.8% and 76.0% fibo at 0.9801 and 0.9748 respectively.

USDCHF_H4
Risk Warning: the result of previous trading operations do not guarantee the same results in the future

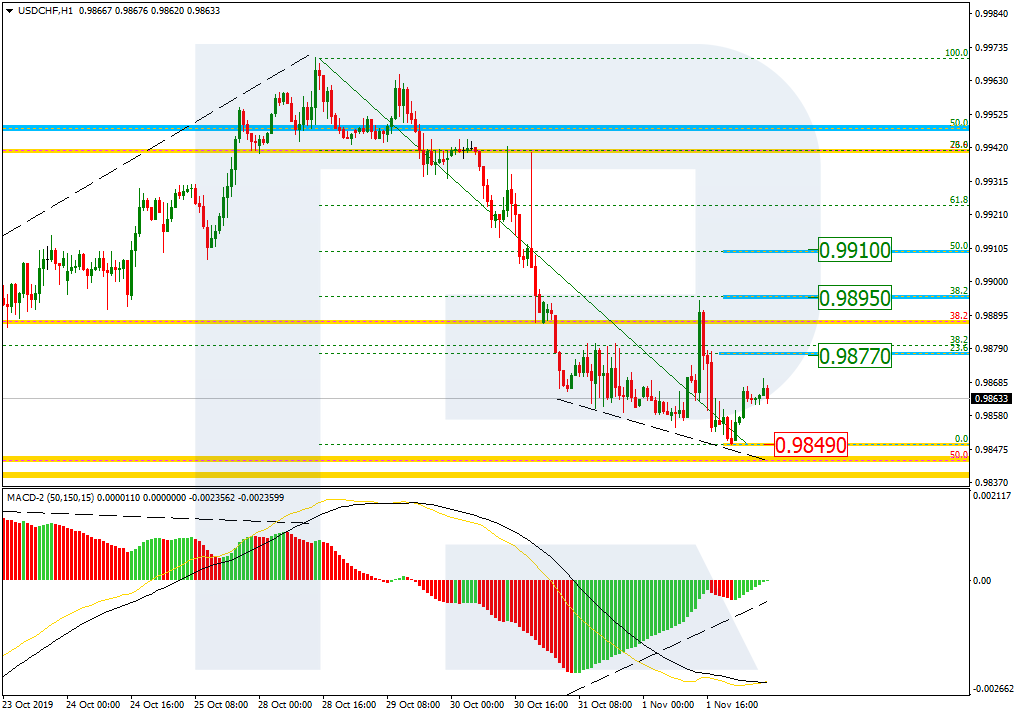
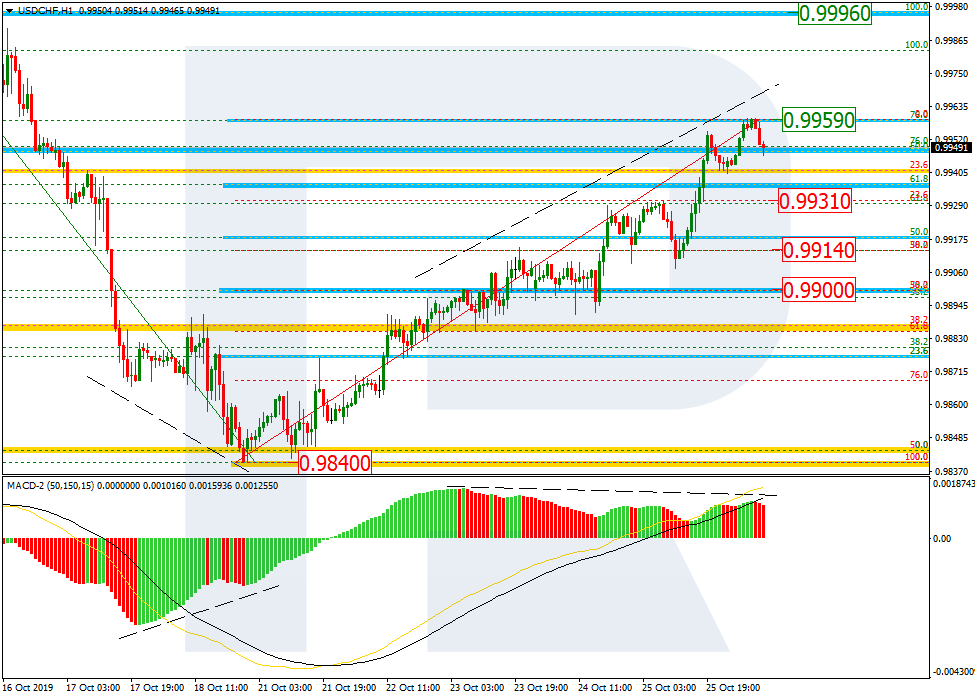
In the H1 chart, there is a convergence on MACD, which may indicate a possible pullback. The upside correctional targets may be 23.6%, 38.2%, and 50.0% fibo at 0.9877, 0.9895, and 0.9910 respectively. the support is the low at 0.9849.

USDCHF_H1
rfxsignals November 1, 2019 No Comments

DAILY FREE FOREX SIGNALS FOR 01-11-2019 | Форекс – Сообщество Трейдеров |إشارات الفوركس|외환 신호

EURUSD BUY -1.11652
SL-1.11170
TP1-1.11886
TP2-1.12136

AUDUSD BUY -0.69085
SL-0.68635
TP1-0.69276
TP2-0.69520

USDCAD SELL-1.31463
SL-1.31873
TP1-1.31224
TP2-1.30975

AUDCAD BUY -0.90850
SL-0.90383
TP1-0.91083
TP2-0.91320

GBPJPY BUY -140.077
SL-139.478
TP1-140.328
TP2-140.563

NZDUSD BUY -0.64340
SL-0.63908
TP1-0.64548
TP2-0.64779

EURNZD SELL-1.73452
SL-1.74215
TP1-1.73195
TP2-1.72933

EURAUD BUY -1.61558
SL-1.61940
TP1-1.61345
TP2-1.61150

Fibonacci Retracements Analysis 31.10.2019 (AUDUSD, USDCAD)

31.10.2019

AUDUSD, “Australian Dollar vs US Dollar”

As we can see in the H4 chart, after completing a short-term pullback, the pair continues its ascending tendency and has already broken 38.2% fibo. The next targets may be 50.0% and 61.8% fibo at 0.6983 and 0.7956 respectively. At the same time, one should pay attention to the divergence on MACD, which may indicate a reverse after the instrument reaches the closest targets.

AUDUSD_H4
Risk Warning: the result of previous trading operations do not guarantee the same results in the future

In the H1 chart, after finishing a quick rising impulse, AUDUSD has entered the post-correctional extension area between 138.2% and 161.8% fibo at 0.6911 and 0.6929 respectively. in the short-term, the price4 may start a new pullback, which may later be followed by further growth towards mid-term targets. The support is at 0.6809.

AUDUSD_H1
Risk Warning: the result of previous trading operations do not guarantee the same results in the future

USDCAD, “US Dollar vs Canadian Dollar”

As we can see in the H4 chart, USDCAD has corrected the previous descending wave with a quick ascending impulse. After reaching 50.0% fibo, the pair is forming a pullback. Possibly, the next rising impulse may reach 61.8% and 76.0% fibo at 1.3230 and 1.3273 respectively. If the price breaks the support at 1.3042, the instrument may continue the bearish trend towards the long-term low at 1.3015.

USDCAD_H4
Risk Warning: the result of previous trading operations do not guarantee the same results in the future

In the H1 chart, the pair is forming a pullback towards 38.2% fibo after finishing a quick ascending movement.

USDCAD_H1
Risk Warning: the result of previous trading operations do not guarantee the same results in the future

Fibonacci Retracements Analysis 30.10.2019 (GBPUSD, EURJPY)

30.10.2019

GBPUSD, “Great Britain Pound vs US Dollar”

As we can see in the H4 chart, there was a divergence on MACD, which made GBPUSD complete the rising wave at 76.0% fibo at 1.3040 and start a new pullback. The support is at 1.2670. after completing the correction, the instrument may start another rising impulse to reach the previous high at 1.30450 and then the key one at 1.3381.

GBPUSD_H4
Risk Warning: the result of previous trading operations do not guarantee the same results in the future

The H1 chart shows more detailed structure of the current descending correction after the divergence. The pair has already reached 23.6% fibo, but may yet continue falling towards 38.2% and 50.0% fibo at 1.2699 and 1.2604. at the same time, there is a short-term convergence, which is slowing down the current decline.

GBPUSD_H1
Risk Warning: the result of previous trading operations do not guarantee the same results in the future

EURJPY, “Euro vs. Japanese Yen”

As we can see in the H4 chart, there was a divergence on MACD, which made EURJPY finish the ascending wave at 76.0% fibo at 121.55 and start a new sideways movement. If the price breaks the resistance at 121.27 the pair may resume growing. The key target is the high at 123.36.

EURJPY
Risk Warning: the result of previous trading operations do not guarantee the same results in the future

In the H1 chart, the pair has reached 23.6% fibo. In the future, the instrument may continue falling towards 38.2% and 50.0% fibo at 119.79 and 119.27 respectively.

EURJPY_H1
Risk Warning: the result of previous trading operations do not guarantee the same results in the future
rfxsignals October 30, 2019 No Comments

DAILY FREE FOREX SIGNALS FOR 30-10-2019 | Форекс – Сообщество Трейдеров |إشارات الفوركس|외환 신호

USDCHF SELL-0.99185
SL-0.99575
TP1-0.98966
TP2-0.98770

USDJPY SELL-108.819
SL-109.256
TP1-108.595
TP2-108.384

EURAUD SELL-1.61730
SL-1.62131
TP1-1.61549
TP2-1.61397

GBPCHF SELL-1.27678
SL-1.28128
TP1-1.27449
TP2-1.27103

EURCHF SELL-1.10257
SL-1.10609
TP1-1.10095
TP2-1.09878

GBPAUD SELL-1.87242
SL-1.88156
TP1-1.57042
TP2-1.86823

GBPNZD SELL-2.02490
SL-2.03212
TP1-2.02307
TP2-2.02145

Fibonacci Retracements Analysis 29.10.2019 (EURUSD, USDJPY)

29.10.2019

EURUSD, “Euro vs US Dollar”

As we can see in the H4 chart, after reaching 50.0% fibo, EURUSD is correcting to reach the local support, which is 23.6% fibo at 1.1005. After finishing this descending correction, the pair may start a new wave to the upside to reach 61.8% and 76.0% fibo at 1.1208 and 1.1248 respectively. however, one should pay attention to long-term 23.6% fibo at 1.1275. If the price reaches this level, the instrument may reverse the current long-term tendency..

EURUSD_H4
Risk Warning: the result of previous trading operations do not guarantee the same results in the future

The H1 chart shows the more detailed structure of the current descending correction tendency that started after the divergence. Right now, the pair is getting closer to 38.2% fibo at 1.1064, while the next downside target may be 50.0% fibo at 1.1029. At the same time, there is a convergence on MACD. The resistance is the high at 1.1179.

EURUSD_H1
Risk Warning: the result of previous trading operations do not guarantee the same results in the future

USDJPY, “US Dollar vs. Japanese Yen”

As we can see in the H4 chart, after completing the correction at 23.6% fibo and breaking the previous high, USDJPY is trying to fix above it to continue forming the rising tendency. The next upside targets are inside the post-correctional extension area between 138.2% and 161.8% fibo at 109.23 and 109.70 respectively; mid-term 61.8% fibo at 109.37 is also there. The key support is still at 106.48.

USDJPY_H4
Risk Warning: the result of previous trading operations do not guarantee the same results in the future

In the H1 chart, after breaking the high, the pair is slowing down. The target may be the downside border of the post-correctional extension area between 138.2% and 161.8% fibo at 109.23 and 109.70 respectively.

USDJPY_H1
rfxsignals October 29, 2019 No Comments

DAILY FREE FOREX SIGNALS FOR 29-10-2019 | Форекс – Сообщество Трейдеров |إشارات الفوركس|외환 신호

NGAS BUY -2.5877
SL-2.5321
TP1-2.6089
TP2-2.6288

COPPER SELL-2.6720
SL-2.7130
TP1-2.6535
TP2-2.6360

CADCHF SELL-0.76173
SL-0.76541
TP1-0.75981
TP2-0.75740

NZDJPY SELL-69.323
SL-69.733
TP1-69.151
TP2-68.940

CADJPY SELL-83.395
SL-83.697
TP1-83.210
TP2-83.064

AUDJPY SELL-74.523
SL-74.942
TP1-74.265
TP2-74.097

RESULT

Yesterday NGAS BUY SIGNAL reaches target 2 and we got 43 pips profit now 🙂

Yesterday CADCHF SELL SIGNAL reaches target 1 and we got 17 pips profit now 🙂

Yesterday NZDJPY SELL SIGNAL reaches target 1 and we got 14 pips profit now 🙂

Yesterday CADJPY SELL SIGNAL reaches target 2 and we got 32 pips profit now 🙂

Fibonacci Retracements Analysis 28.10.2019 (GOLD, USDCHF)

28.10.2019

XAUUSD, “Gold vs US Dollar”

As we can see in the H4 chart, after completing the correctional downtrend at 76.0% fibo at 1473.60, XAUUSD is forming a new rising impulse, which is trying to break the local high at 1519.57. If the price breaks the high near this level, the instrument may continue growing towards 76.0% fibo at 1533.08 and then the key high at 1557.00.

GOLD_H4
Risk Warning: the result of previous trading operations do not guarantee the same results in the future

In the H1 chart, the pair is slightly correcting after attempting to test the high. Possibly, the pullback may continue to reach 50.0% fibo.

GOLD_H1
Risk Warning: the result of previous trading operations do not guarantee the same results in the future

USDCHF, “US Dollar vs Swiss Franc”

As we can see in the H4 chart, after finishing the descending correction at 50.0% fibo, USDCHF is trading upwards; this movement may be considered as a new correction to the upside. However, if the price fixes above 76.0% fibo and then the local high at 0.9996, the instrument may continue growing towards the key high at 1.0028. The key support is the low at 0.9840.

USDCHF_H4
Risk Warning: the result of previous trading operations do not guarantee the same results in the future

In the H1 chart, after testing 76.0% fibo, the pair has been forced to reverse by the divergence on MACD, which indicates a new decline towards 23.6%, 38.2%, and 50.0% fibo at 0.9931, 0.9914, and 0.9900 respectively.

USDCHF_H1
Risk Warning: the result of previous trading operations do not guarantee the same results in the future
rfxsignals October 28, 2019 No Comments

DAILY FREE FOREX SIGNALS FOR 28-10-2019 | Форекс – Сообщество Трейдеров |إشارات الفوركس|외환 신호

CHFJPY SELL-109.184
SL-109.679
TP1-108.985
TP2-108.763

USDCAD SELL-1.30592
SL-1.30958
TP1-1.30368
TP2-1.30178

GBPUSD BUY -1.28511
SL-1.28086
TP1-1.28694
TP2-1.28890

USDJPY SELL-108.684
SL-109.033
TP1-108.489
TP2-108.321

EURUSD BUY -1.10949
SL-1.10426
TP1-1.11174
TP2-1.11299

AUDUSD BUY -0.68303
SL-0.67860
TP1-0.68498
TP2-0.68687

NZDUSD BUY -0.63575
SL-0.63119
TP1-0.63768
TP2-0.63934

EURAUD SELL-1.62391
SL-1.62731
TP1-1.62236
TP2-1.62091

EURJPY BUY -120.618
SL-120.301
TP1-120.799
TP2-120.961

EURUSD keeps the downside run going-weekly outlook

Below upward sloping trend line.  

The EURUSD has reached the 100 pip mark for the week. Yippee. The range is up to 103 pips and in the process reached the upward sloping trend line on the hourly chart at 1.1079.  

Below upward sloping trend line.  

On more selling the lower, downward sloping trend line comes in 1.1065 (and moving lower).  That is also near swing levels (see red numbered circles), and the 61.8% retracement at the 1.10626-647 area.