How to Choose the Best Forex Strategy

Forex trading is all about eliminating the losing trades and achieving more winning ones.

This is largely achieved thanks to proven Forex trading strategies. Using these strategies, a trader develops for himself a set of rules that help to take advantage of Forex trading.

How to Choose the Best Forex Strategy

Quite often, traders will rely on trading strategies that haven’t been tested thoroughly, setting themselves up for a failure. The truth is, you can spend hours searching all over the internet for the right strategy – and have no luck finding one.

The only solution is to try out the leading strategies for yourself and see what actually works.

Forex trade strategies and goals

Before discussing trading setups and possible strategies, we need to first understand why one would consider trading Forex in the first place. There are two main reasons: hedging and speculation.

Hedging refers to companies protecting themselves from losses. They get their daily profits from any overseas country (that has paid revenue in a foreign currency). Then, they transfer it back to their own country, expecting fluctuation in the currency.

This practice isn’t really relevant to Forex strategies.

On the other hand, speculation refers to predicting a move that a company might make in a certain situation. If done correctly, these predictions greatly improve trading results.

Speculation is what day trading is all about. With the help of decent strategies, you can progress in the Forex trading world and ultimately develop your own trading strategy. The downside is that this is a time-consuming and difficult process.

The good news is that there are pre-made strategies available for you to try.

Although it is better to play it safe, especially if you’re new to the game, you need to change your tactics from time to time. This may allow you to see a profit margin you could have missed otherwise.

What is the best Forex trading strategy?

Here we have a few methods that will help you quickly change tactics and gain pips.

We’re going to provide you with an overview of strategies that have worked for many years, so that you can research the ones that are of interest to you. These are the Forex trading strategies that work, and they have been proven to work by many traders.

The Bladerunner Trade

This is suitable for all timeframes and currency pairings. It is, at this moment, one of the trending strategies in the market. The Bladerunner Trade is a price action strategy.

Daily Fibonacci Pivot Trade

This trade uses daily pivots only. However, it can be extended to a longer timeline. It combines Fibonacci retracements and extensions. Fibonacci trade can incorporate any number of pivots.

Bolly Band Bounce Trade

This strategy is perfect for a ranging market. If you use it in combination with confirming signals, it works really well. If you are interested in Bollinger Bands strategy, this one is definitely worth checking out.

Forex Overlapping Fibonacci Trade

These strategies are a favourite among many traders. The reliability tends to be a bit lower, but used in combination with appropriate confirming signals, they become extremely accurate.

The Pop ‘n’ Stop Trade

Trying to chase the price when it goes upside rarely works. That is, unless you know this trick. This Forex trading strategy gives you a simple tip so you know whether the price will continue to rise or decrease.

Trading the Forex Fractal

This is more of a concept rather than a strategy, but you need to know this if you want to understand what the prices are doing. This offer you a lesson in market fundamentals, which will really help you to trade more effectively.

Currency trading strategies are a game of trial and error. It may be worth trying out the strategies from list above to see if any work for you. However, we will look at two further strategies which tend to be more common than the ones previously mentioned.

What’s more, they have been consistently proven to work.

Scalping in a nutshell

Many consider scalping to be tiresome and time-consuming. Indeed, not every trader can successfully pull it off. It may really seem that scalping takes the fun out of the best Forex strategy.

On the other hand, it really does work.

If you are on the lookout for a reliable Forex strategy, this might be your safest choice. As a day trader, you will dip in and out of the market once or twice a day and always carry a position into another period. Ideally, the profit will come back.

If you’re a savvy scalper, this process is usually far more frenetic. You will trade in and out of the Forex markets several times per day. The profit margins may appear small but they’re also steady.

The more you scalp, the more you will make.

For example, if you trade EUR/USD pair and the price of either currency jumped up 20 pips, you get a slight profit for taking an action.

The result is a tiny profit, but that is a profit made in a single minute. The amount and consistency of your overall profits depend on your commitment and reflexes.

If scalpers want to truly take advantage of the news releases, they should wait for the most important ones. When you scalp, you need to remember when GDP, unemployment figures and inflation rates are about to be released.

These factors affect trading strategies, particularly in the currency trading market, where scalping can be most profitable.

Positional trading – consistent Forex trading strategy

While scalping can certainly teach you to trade the currency market, it takes a lot of time and effort. When you scalp, you have to sit in front of the computer for long periods of time.

Positional trading is an interesting way to trade Forex online. While it can take you only a few hours a week, it can provide you with quite extensive profits.

So how does positional trading work?

Positional trading is all about having your positions opened for a long period of time, so you can catch some large market moves. The rule of thumb is to avoid using high leverage and keep a close eye on the currency swaps.

Sometimes these swaps can cost you more than your actual profit.

With positional trading, you can learn not only Forex trading strategies but also the skills you need to become successful. It is a good method of achieving high profits, but it can also put your emotions to test.

Traders may feel the stress from having their funds affected by short term moves. Quite often, traders will have to fight the urge to close their trade when it’s losing points.

With positional trading, you have to dedicate your time to analysing the market and predicting potential market moves. However, there is almost no time spent on the execution of your trading strategy.

Simply start by picking up the pair you know the most about. Calculate the possible volume of your transaction, see what the swap is and how you can break even, analyse the best moment to enter the trade.

And when this moment comes, go for it.

Fibonacci Retracements Analysis 03.10.2019 (AUDUSD, USDCAD)

03.10.2019

AUDUSD, “Australian Dollar vs US Dollar”

As we can see in the H4 chart, the descending wave tested the mid-term low at 0.6677 and then there was a convergence, which may indicate a new pullback in the nearest future. After the pullback, the price may continue falling towards the post-correctional extension area between 138.2% and 161.8% fibo at 0.6595 and 0.6543 respectively.

AUDUSD_H4
Risk Warning: the result of previous trading operations do not guarantee the same results in the future

Taking into account the convergence on MACD in the H1 chart, we may assume that AUDUSD may correct towards 23.6%, 38.2%, and 50.0% fibo at 0.6724, 0.6757, and 0.6782 respectively.

AUDUSD_H1
Risk Warning: the result of previous trading operations do not guarantee the same results in the future

USDCAD, “US Dollar vs Canadian Dollar”

As we can see in the H4 chart, after failing to reach 50.0% fibo at 1.3201, USDCAD started a new rising impulse, which has already broken the local high and may reach the high at 1.3328. After breaking it, the instrument may continue the ascending tendency towards 76.0% fibo at 1.3433.

USDCAD_H4
Risk Warning: the result of previous trading operations do not guarantee the same results in the future

In the H1 chart, after finishing the ascending impulse, the pair is correcting. The target may be 23.6%, 38.2%, and 50.0%, fibo at 1.3305, 1.3286, and 1.3271 respectively. After breaking the resistance at 1.3335, the price may continue growing.

USDCAD_H1
Risk Warning: the result of previous trading operations do not guarantee the same results in the future

Fibonacci Retracements Analysis 23.09.2019 (GOLD, USDCHF)

Fibonacci Retracements Analysis 23.09.2019 (GOLD, USDCHF)

23.09.2019

XAUUSD, “Gold vs US Dollar”

As we can see in the H4 chart, after updating the local low, XAUUSD is back to trading inside the previous correctional range. During the correction, the pair has got very close to 50.0% fibo, but may yet continue moving to reach 61.8% and 76.0% fibo at 1528.90 and 1539.25 respectively. However, if the price breaks the low at 1483.49, the instrument may continue the mid-term descending tendency towards 50.0% and 61.8% fibo at 1478.85 and 1460.25 respectively.

GOLD_H4
Risk Warning: the result of previous trading operations do not guarantee the same results in the future

In the H1 chart, after testing 50.0% fibo at 1520.20, the pair may start a new short-term pullback. The targets may be 23.6% and 38.2% fibo at 1511.00 and 1505.75 respectively.

GOLD_H1
Risk Warning: the result of previous trading operations do not guarantee the same results in the future

USDCHF, “US Dollar vs Swiss Franc”

As we can see in the H4 chart, the divergence made the pair reverse after it tested the post-correctional extension area between 138.2% and 161.8% fibo at 0.9980 and 1.0010 respectively. By now, USDCHF has already reached 23.6% fibo and may continue falling towards 38.2%, 50.0%, and 61.8% fibo at 0.9860, 0.9821, and 0.9783 respectively.

USDCHF_H4
Risk Warning: the result of previous trading operations do not guarantee the same results in the future

In the H1 chart, after reaching mid-term 23.6% fibo, USDCHF is correcting and has already reached 50.0% fibo. If the price breaks the local low at 0.9889, the instrument may continue falling.

USDCHF_H1
Risk Warning: the result of previous trading operations do not guarantee the same results in the future

Fibonacci Retracements Analysis 02.10.2019 (GBPUSD, EURJPY)

GBPUSD, “Great Britain Pound vs US Dollar”

As we can see in the H4 chart, GBPUSD has almost reached a very significant correctional level, 61.8% fibo at 1.2197. If the pair is able to reach the next short-term correctional level, 76.0% fibo at 1.2108, it may try to test the low at 1.1958 and once again enter the post-correctional extension area between 138.2% and 161.8% fibo at 1.2019 and 1.1788 respectively. However, in case of a new rising impulse, the targets will be the high at 1.2582 and then 61.8% fibo at 1.2710.

GBPUSD_H4
Risk Warning: the result of previous trading operations do not guarantee the same results in the future

In the H1 chart, the convergence made the pair start a new correction. The rising impulse tried to reach 38.2% fibo at 1.2349, but was forced to pull back. The next rising impulse may reach the above-mentioned level and then continue growing towards 50.0%, 61.8%, and 76.0% fibo 1.2393, 1.2437, and 1.2491 respectively. The key support is the low at 1.2205.

GBPUSD_H1
Risk Warning: the result of previous trading operations do not guarantee the same results in the future

EURJPY, “Euro vs. Japanese Yen”

As we can see in the H4 chart, after slowing down its decline at 61.8% fibo, EURJPY has formed a triangle consolidation range, which means that the pair is about to start a new rising wave. The key upside target may be the high at 120.01 and 61.8% fibo at 120.50. However, one shouldn’t exclude a possibility of further decline towards 76.0% fibo at 116.86 in the short-term. In this case, the instrument may later fall to reach the low at 115.86 or even deeper.

EURJPY_H4
Risk Warning: the result of previous trading operations do not guarantee the same results in the future

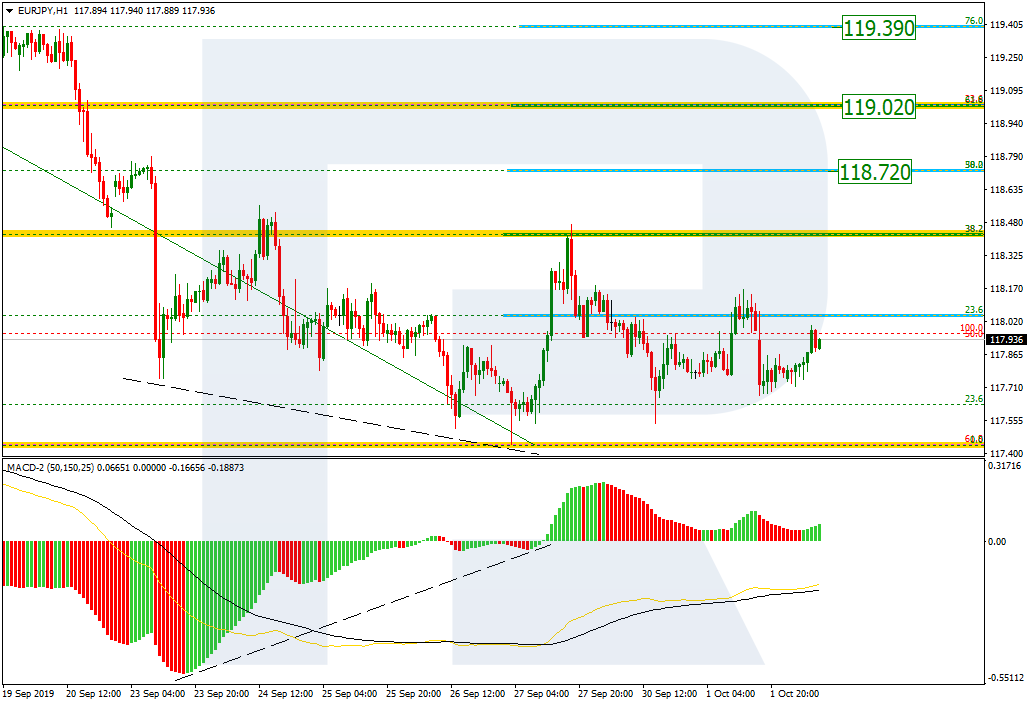
In the H1 chart, the price started a new short-term correction, which has already reached 38.2% fibo. The next correctional wave may be heading towards 50.0%, 61.8%, and 76.0% fibo at 118.72, 119.02, and 119.39 respectively.

EURJPY_H1
Risk Warning: the result of previous trading operations do not guarantee the same results in the future
rfxsignals October 2, 2019 No Comments

DAILY FREE FOREX SIGNALS FOR 02-10-2019 | Форекс – Сообщество Трейдеров |إشارات الفوركس|외환 신호

GBPCAD SELL-1.62218
SL-1.62802
TP1-1.61914
TP2-1.61600

GBPAUD SELL-1.82820
SL-1.83724
TP1-1.82570
TP2-1.82355

GBPNZD SELL-1.96281
SL-1.97057
TP1-1.95954
TP2-1.95595

GBPCHF SELL-1.21921
SL-1.22680
TP1-1.21676
TP2-1.21440

NZDJPY BUY -67.525
SL-66.989
TP1-67.741
TP2-67.96411:26 02-10-2019

GBPJPY SELL-132.298
SL-133.090
TP1-131.984
TP2-131.684

RESULT

Yesterday GBPCAD SELL SIGNAL reaches target 1 and we got 20 pips profit now 🙂

Yesterday GBPjpy SELL SIGNAL reaches target 2 and we got 60 pips profit now 🙂

Yesterday GBPAUD SELL SIGNAL reaches STOPLOSS 🙁

rfxsignals October 1, 2019 No Comments

DAILY FREE FOREX SIGNALS FOR 01-10-2019 | Форекс – Сообщество Трейдеров |إشارات الفوركس|외환 신호

USDCAD SELL-1.32687
SL-1.33062
TP1-1.32482
TP2-1.32223

GBPCHF SELL-1.22018
SL-1.22680
TP1-1.21729
TP2-1.21440

GBPJPY SELL-131.949
SL-133.090
TP1-131.684
TP2-131.453

TODAY PREMIUM SIGNALS

EURCAD BUY -1.44708
SL-1.43942
TP1-1.44949
TP2-1.45193
PENDING ORDER

CHFJPY SELL-108.220
SL-108.715
TP1-108.008
TP2-107.757
INSTANT ORDER

EURUSD BUY -1.09010
SL-1.08546
TP1-1.09185
TP2-1.09422
PENDING ORDER

EURJPY BUY -118.122
SL-117.627
TP1-118.311
TP2-118.514
PENDING ORDER

EURCHF BUY -1.09113
SL-1.08238
TP1-1.09310
TP2-1.09579
PENDING ORDER

GOLD BUY -1465.23
SL-1452.84
TP1-1468.64
TP2-1472.35
PENDING ORDER

Fibonacci Retracements Analysis 30.09.2019 (GOLD, USDCHF)

30.09.2019

XAUUSD, “Gold vs US Dollar”

As we can see in the H4 chart, after finishing the correctional uptrend at 61.8% fibo, XAUUSD is forming another descending wave. If the price breaks the low at 1483.49, the mid-term descending tendency may continue to reach 50.0%, 61.8%, and 76.0% fibo at 1478.85, 1460.25, and 1438.10 respectively. The key resistance is at 1557.00.

GOLD_H4
Risk Warning: the result of previous trading operations do not guarantee the same results in the future

In the H1 chart, there was a convergence on MACD when the price reached the low, which may indicate a local pullback. After the pair breaks the local low, the short-term target will be the post-correctional extension area between 138.2% and 161.8% fibo at 1463.60 and 1451.50 respectively.

GOLD_H1
Risk Warning: the result of previous trading operations do not guarantee the same results in the future

USDCHF, “US Dollar vs Swiss Franc”

As we can see in the H4 chart, the pair is about to complete the correctional uptrend and may start a new descending wave towards 50.0%, 61.8%б and 76.0% fibo at 0.9821, 0.9783, and 0.9737 respectively. However, if the instrument breaks the high at 0.9983, it may continue growing to reach the post-correctional extension area between 138.2% and 161.8% fibo at 0.9980 and 1.0010 respectively.

USDCHF_H4
Risk Warning: the result of previous trading operations do not guarantee the same results in the future

In the H1 chart, the divergence made the pair complete the ascending wave and start a new decline, which has already reached 50.0% fibo at 0.9897. In the future, the price may continue falling towards 61.8% and 76.0% fibo at 0.9884 and 0.9869 respectively, and the low at 0.9844. The resistance is at 0.9949.

USDCHF_H1
Risk Warning: the result of previous trading operations do not guarantee the same results in the future
rfxsignals September 30, 2019 No Comments

DAILY FREE FOREX SIGNALS FOR 30-09-2019 | Форекс – Сообщество Трейдеров |إشارات الفوركس|외환 신호

EURUSD SELL-1.09255
SL-1.09736
TP1-1.09018
TP2-1.08738

AUDUSD SELL-0.67487
SL-0.67881
TP1-0.67330
TP2-0.67156

GBPCHF BUY -1.22450
SL-1.21546
TP1-1.22704
TP2-1.22989

EURJPY SELL-117.889
SL-118.310
TP1-117.736
TP2-117.585

GBPAUD BUY -1.82402
SL-1.81865
TP1-1.82617
TP2-1.82858

AUDNZD SELL-1.07767
SL-1.08097
TP1-1.07582
TP2-1.07408

EURCAD SELL-1.44659
SL-1.44990
TP1-1.44480
TP2-1.44282

USDCHF BUY -0.99378
SL-0.98846
TP1-0.99596
TP2-0.99800

RESULT

Yesterday EURUSD SELL SIGNAL reaches target 1 and we got 20 pips profit now 🙂

Yesterday AUDUSD SELL SIGNAL reaches target 2 and we got 38 pips profit now 🙂

Yesterday GBPCHF BUY SIGNAL reaches target 2 and we got 56 pips profit now 🙂

Yesterday EURJPY BUY SIGNAL reaches target 2 and we got 30 pips profit now 🙂

Yesterday GBPAUD BUY SIGNAL reaches target 2 and we got 46 pips profit now 🙂

Yesterday AUDNZD SELL SIGNAL reaches target 2 and we got 36 pips profit now 🙂

Yesterday EURCAD SELL SIGNAL reaches target 2 and we got 38 pips profit now 🙂

Yesterday USDCHF BUY SIGNAL reaches target 2 and we got 40 pips profit now 🙂

rfxsignals September 27, 2019 No Comments

DAILY FREE FOREX SIGNALS FOR 27-09-2019 | Форекс – Сообщество Трейдеров |إشارات الفوركس|외환 신호

GBPUSD SELL-1.22783
SL-1.23306
TP1-1.22580
TP2-1.22402

GBPCHF SELL-1.22035
SL-1.22662
TP1-1.21733
TP2-1.21438

AUDUSD BUY -0.67635
SL-0.67221
TP1-0.67855
TP2-0.68024

CADJPY BUY -81.289
SL-80.901
TP1-81.499
TP2-81.702

GBPCAD SELL-1.62943
SL-1.63589
TP1-1.62684
TP2-1.62470

GBPNZD SELL-1.95061
SL-1.96041
TP1-1.94743
TP2-1.94416

GBPAUD SELL-1.81609
SL-1.82393
TP1-1.81042
TP2-1.80423

NZDUSD SELL-0.62909
SL-0.63336
TP1-0.62723
TP2-0.62534

EURCHF SELL-1.08453
SL-1.08852
TP1-1.08263
TP2-1.08067

GOLD SELL-1496.98
SL-1506.03
TP1-1493.84
TP2-1490.85