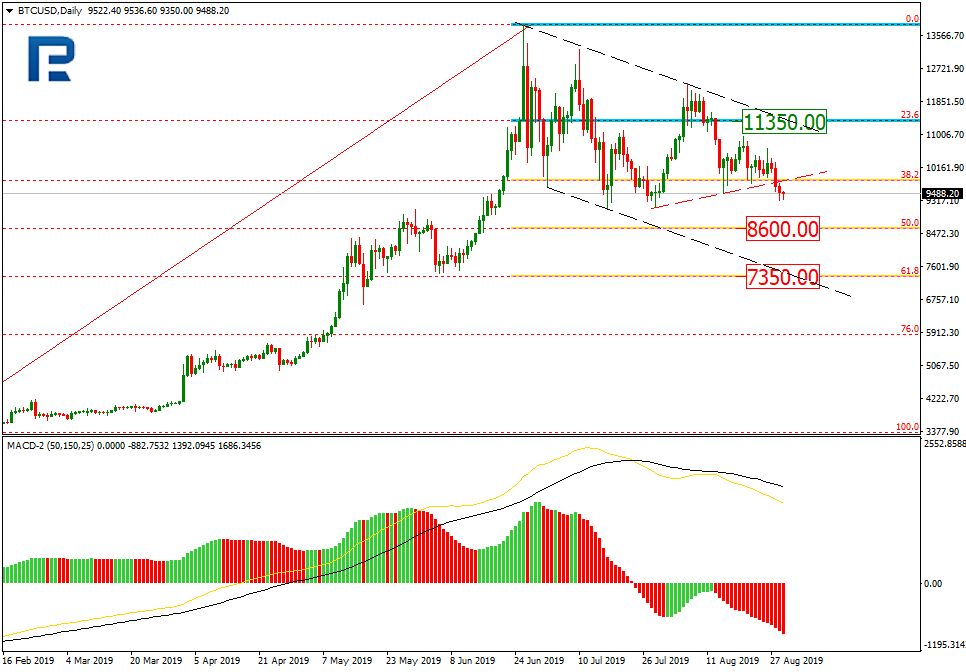
As we can see in the daily chart, after testing 38.2% fibo, BTCUSD has formed a new descending impulse and broken its local lows. In the future, the instrument may continue falling towards 50.0% and 61.8% fibo at 8600.00 and 7350.00 respectively. The resistance is 23.6% fibo at 11350.00.
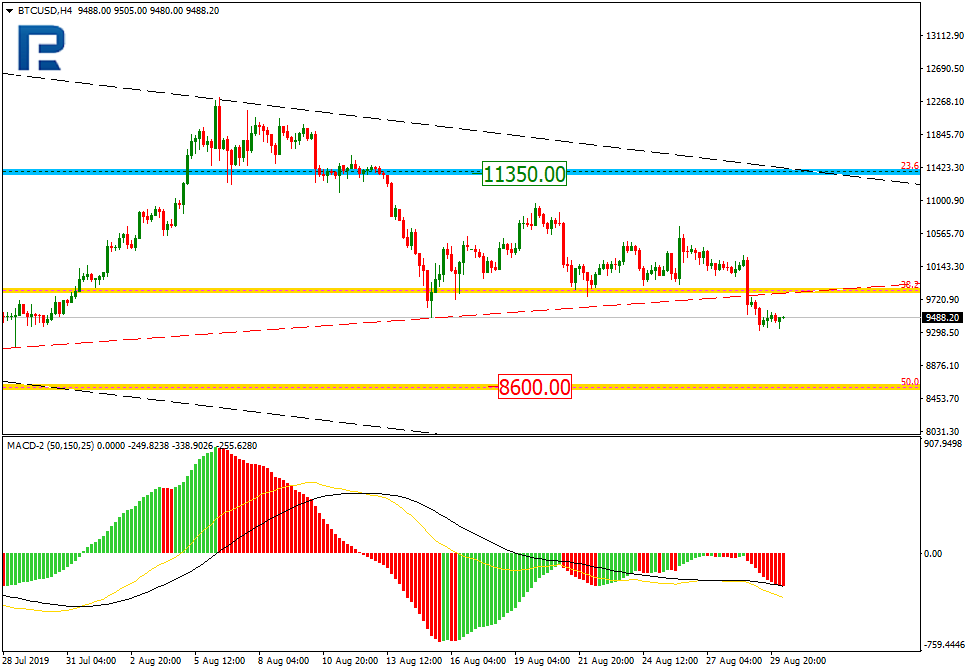
In the H4 chart, the pair is trading towards 50.0% fibo. At the same time, there is a local convergence on MACD Oscillator, which may indicate a possible pullback.
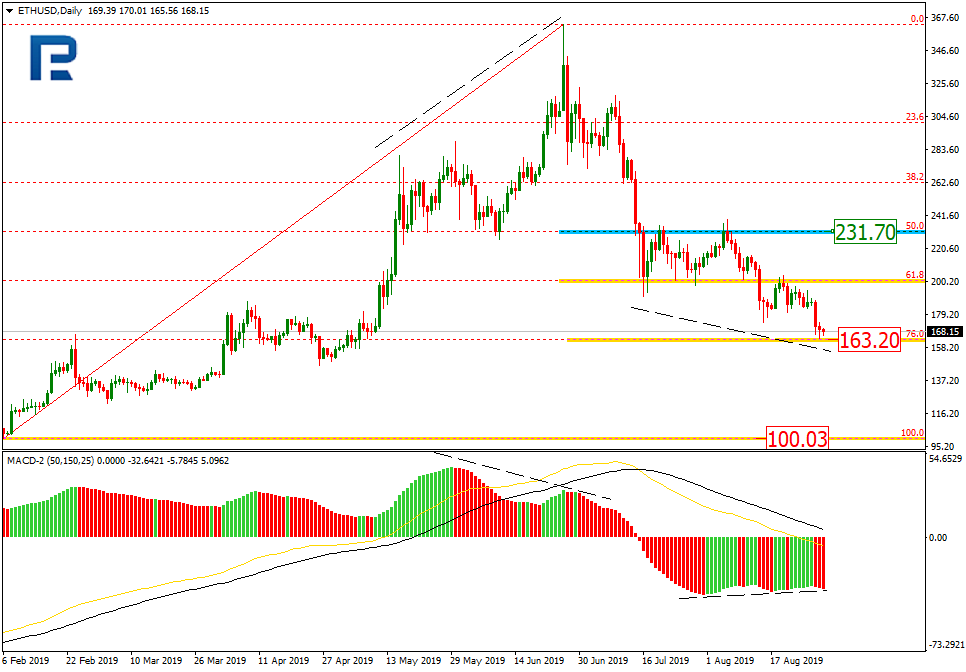
ETHUSD, “Ethereum vs. US Dollar”
As we can see in the daily chart, ETHUSD has completed another descending impulse and reached 76.0% fibo. After breaking this level and fixing below it, the pair may continue falling towards 100.03. At the same time, there is a convergence on MACD, which may indicate a new pullback. The resistance is 50.0% fibo at 231.50, which may be the target of the correction.
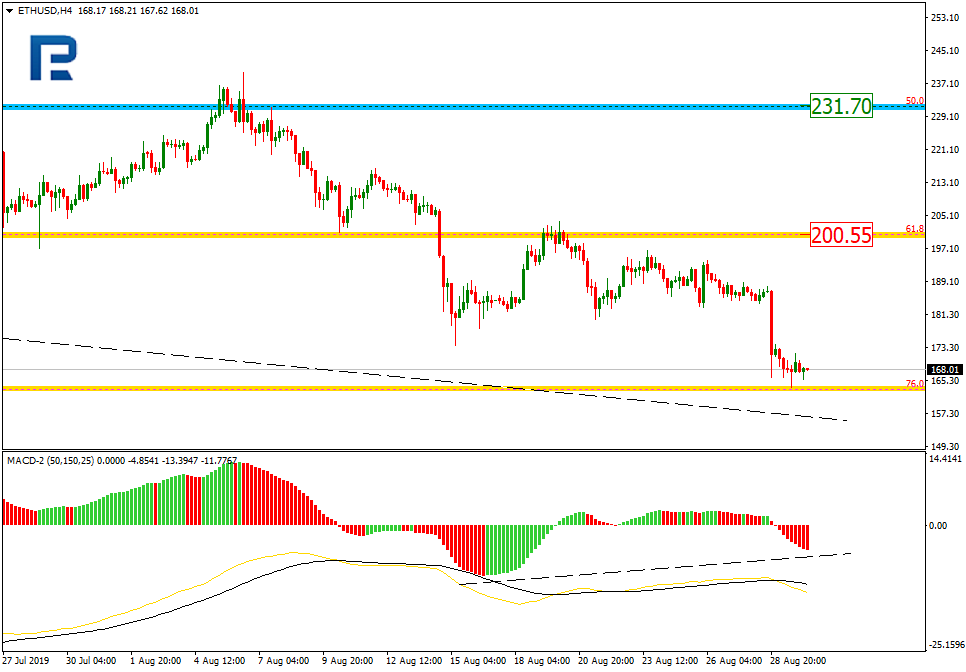
In the H4 chart, the instrument is heading towards 76.0% fibo to test it. At the same time, there is a convergence, which may indicate a short-term correction towards the local resistance at 61.8% fibo at 200.55.
Forecasts presented in this section only reflect the author’s private opinion and should not be considered as guidance for trading. RoboForex bears no responsibility for trading results based on trading recommendations described in these analytical reviews.
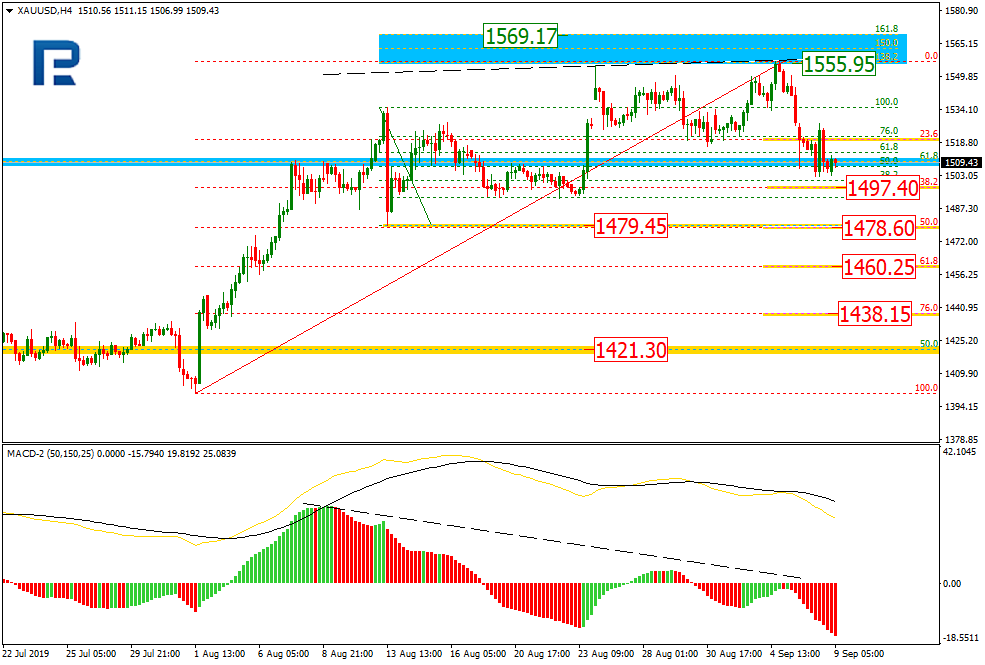
As we can see in the H4 chart, after completing the rising impulse, XAUUSD has started the correction to the downside, but the uptrend yet continues. After breaking the current high, the pair may continue trading upwards to reach 61.8% fibo at 1616.00. At the same time, there is a divergence within the uptrend on MACD, which may indicate a possible mid-term descending correction with the targets at 23.6%, 38.2%, and 50.0% fibo at 1487.00, 1444.60, and 1410.80 respectively.
As we can see in the H1 chart, the correctional downtrend has reached 61.8% fibo. The next downside target may be 76.0% fibo at 1508.20. However, there is a local convergence, which may indicate a new growth towards the high at 1554.99
USDCHF, “US Dollar vs Swiss Franc”
It would be better to analyze USDCHF on the daily chart. As we can see, the convergence made the pair reverse and start a new uptrend, which has already reached 38.2% fibo and may yet continue towards 50.0% and 61.8% fibo at 0.9984 and 1.0016 respectively. The support is the low at 0.9660.
The H4 chart shows more detailed structure of the current rising correction. USDCHF is correcting to reach 50.0% fibo at 0.9948. At the same time, there is a divergence, which may indicate a possible pullback.
Forecasts presented in this section only reflect the author’s private opinion and should not be considered as guidance for trading. RoboForex bears no responsibility for trading results based on trading recommendations described in these analytical reviews.
As we can see in the H4 chart, after finishing the short-term pullback, EURUSD is forming a new descending impulse. It seems as if the previous low at 1.1027 couldn’t provide enough resistance to bears and now acts as the resistance for bulls. After breaking the previous low, the instrument continue falling towards the post-correctional extension area between 138.2% and 161.8% fibo at 1.0942 and 1.0889 respectively.
In the H1 chart, there is a convergence within the downtrend on MACD, which may indicate a possible pullback. The upside correctional targets may be 23.6%, 38.2%, and 50.0% fibo at 1.0955, 1.0994, and 1.1027 respectively.
USDJPY, “US Dollar vs. Japanese Yen”
As we can see in the H4 chart, USDJPY is testing 23.6% fibo. In the future, the correctional uptrend may continue towards 38.2%, 50.0%, and 61.8% fibo at 107.48, 108.42, and 109.37 respectively. The support is at 104.45.
In the H1 chart, USDJPY is correcting downwards and has already reached 23.6% fibo. In the future, the correction may continue towards 38.2% and 50.0% fibo at 105.83 and 105.56 respectively. If the price breaks the high at 106.68, the instrument may resume trading upwards.
Forecasts presented in this section only reflect the author’s private opinion and should not be considered as guidance for trading. RoboForex bears no responsibility for trading results based on trading recommendations described in these analytical reviews.
As we can see in the H4 chart, after finishing the correction at 50.0% fibo and breaking the low, GBPUSD is still trading downwards. The next downside targets are inside the post-correctional extension area between 138.2% and 161.8% fibo at 1.2019 and 1.1788 respectively. The resistance is at 1.2286. At the same time, there is a convergence on MACD, which indicates slowdown of the descending tendency.
In the H1 chart, the pair is correcting to the upside and has already reached 38.2% fibo. The next target may be 50.0% fibo at 1.2133. The support is close to the low at 1.1958.
EURJPY, “Euro vs. Japanese Yen”
As we can see in the daily chart, after breaking the significant low, EURUSD is still moving downwards. The targets are inside the post-correctional extension area between 138.2% and 161.8% fibo at 114.33 and 112.06 respectively. The resistance is at 117.96..
In the H4 chart, there is a convergence, which may indicate a possible pullback soon. The targets of this correction may be 23.6%, 38.2%, and 50.0% fibo at 117.18, 117.96, and 118.62 respectively. The support is near the low at 115.86.
Forecasts presented in this section only reflect the author’s private opinion and should not be considered as guidance for trading. RoboForex bears no responsibility for trading results based on trading recommendations described in these analytical reviews.
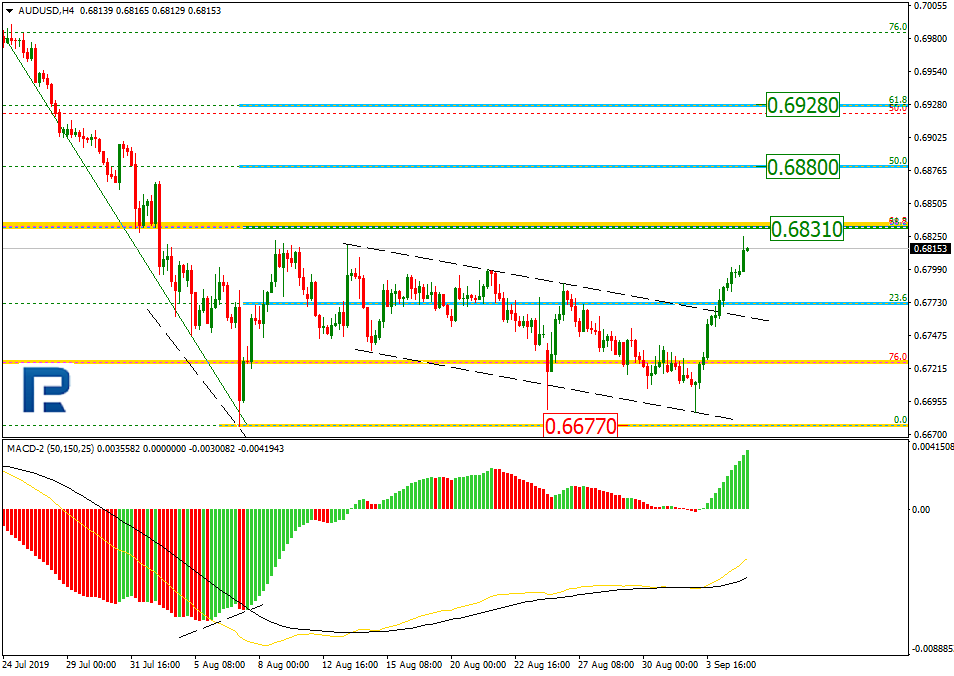
As we can see in the H4 chart, AUDUSD is moving upwards, but the mid-term correction continues. The pair is heading towards 38.2% fibo at 0.6831 and may later reach 50.0% and 61.8% fibo at 0.6880 and 0.6928 respectively. After breaking the local support at 0.6677, the instrument may continue falling to reach the long-term low at 0.6547.
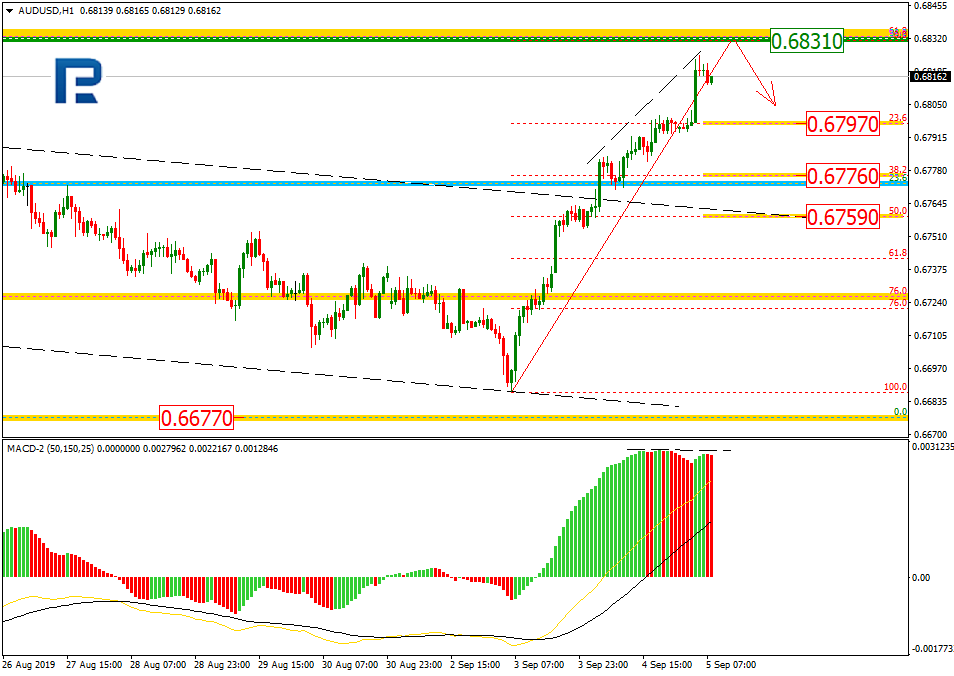
In the H1 chart, AUDUSD is steadily trading upwards, but there is a divergence on MACD, which may indicate a new pullback after the price reaches 38.2% at 0.6831. The targets of this pullback may be 23.6%, 38.2%, and 50.0% fibo at 0.6797, 0.6776, and 0.6759 respectively.
USDCAD, “US Dollar vs Canadian Dollar”
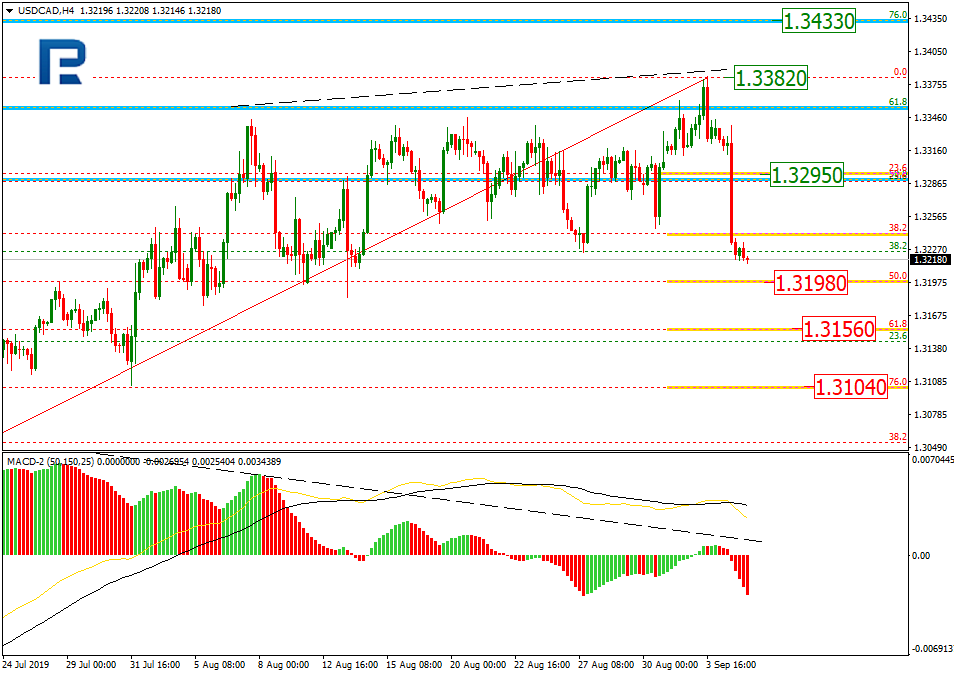
As we can see in the H4 chart, after breaking the previous high and testing 61.8% fibo, USDCAD couldn’t reach 76.0% fibo at 1.3433. There was a divergence on MACD, which made the pair start a new decline. By now, this decline has already reached 38.2% fibo and may yet continue towards 50.0%, 61.8%, and 76.0% fibo at 1.3198, 1.3156, and 1.3104 respectively. The local resistance is at 1.3295.
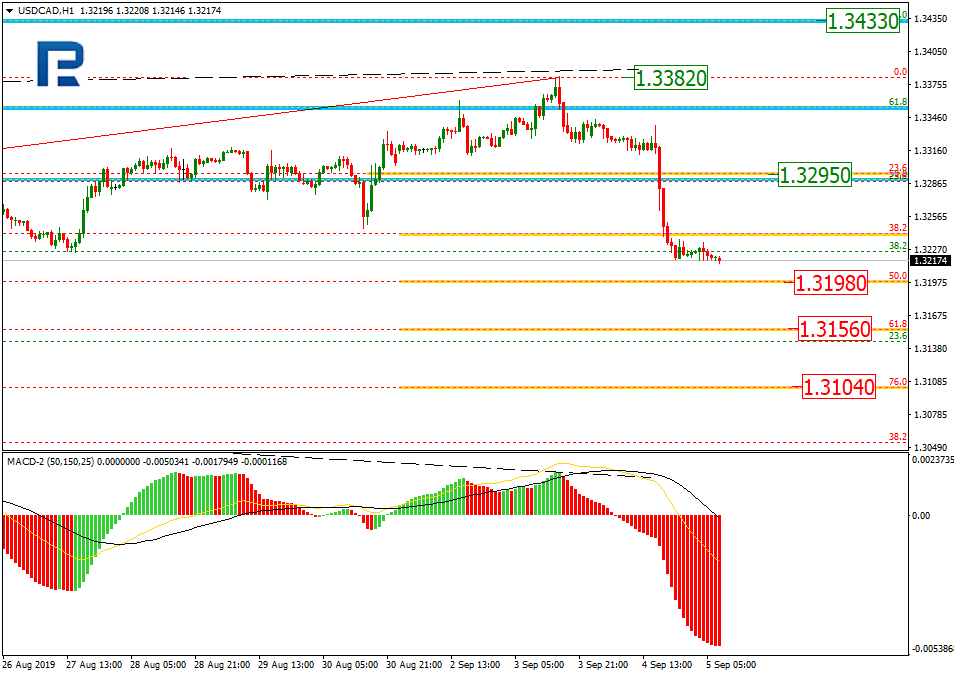
The H1 chart shows more detailed structure of the current decline. USDCAD is getting closer to 50.0% fibo at 1.3198.
Forecasts presented in this section only reflect the author’s private opinion and should not be considered as guidance for trading. RoboForex bears no responsibility for trading results based on trading recommendations described in these analytical reviews.
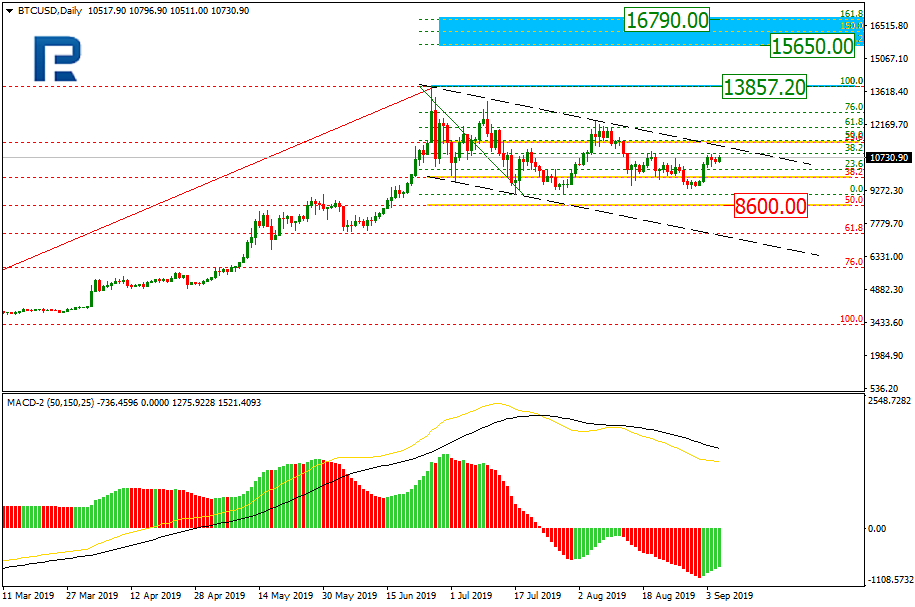
As we can see in the daily chart, the correctional channel is transforming into Triangle. If the price breaks the current resistance live, BTCUSD will continue growing towards the high at 13857.20. More significant upside targets are inside the post-correctional extension area between 138.2% and 161.8% fibo at 15650.00 and 16790.00 respectively. At the same time, MACD lines are heading downwards, which means that the decline may yet continue towards 50.0% fibo at 8600.00.
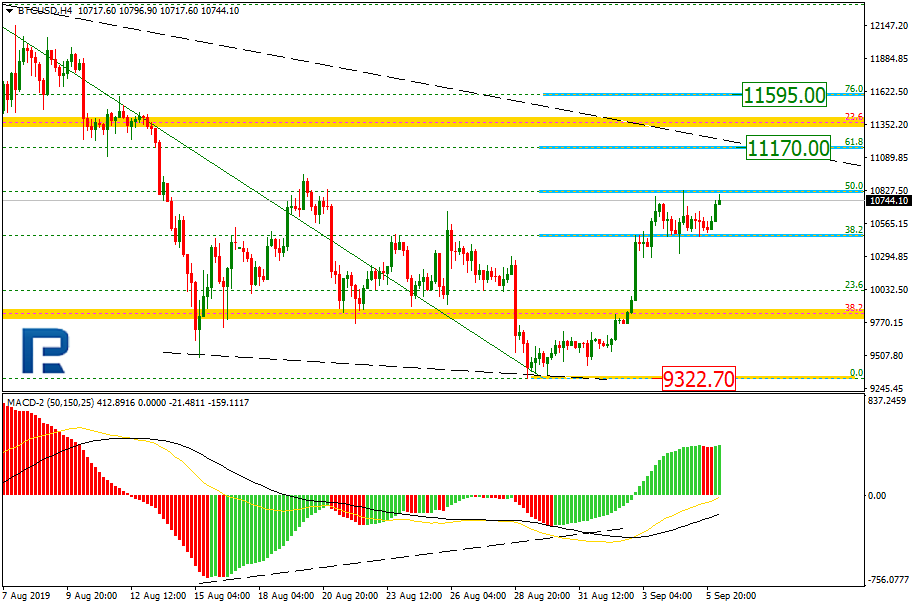
In the H4 chart, the pair is correcting to the upside after finishing another descending wave and has already reached 50.0% fibo. In the future, the correction may continue towards 61.8% and 76.0% fibo at 11170.00 and 11595.00 respectively. The support is the low at 9322.70.
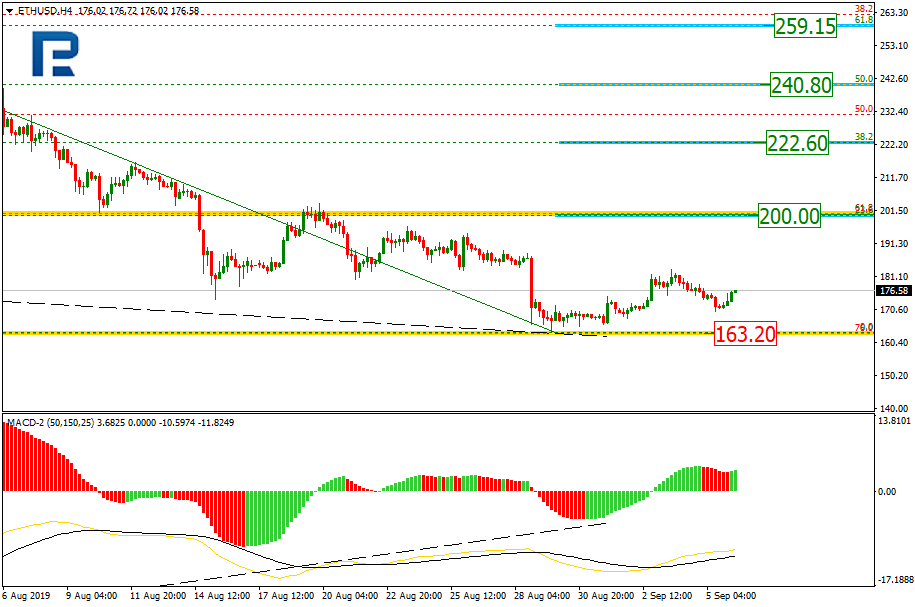
ETHUSD, “Ethereum vs. US Dollar”
As we can see in the H4 chart, the descending tendency reached 76.0% fibo and then there was a convergence on MACD. In this case, ETHUSD may start a new growth towards 23.6%, 38.2%, 50.0%, and 61.8% fibo at 200.00, 222.60, 240.80, and 259.15 respectively.
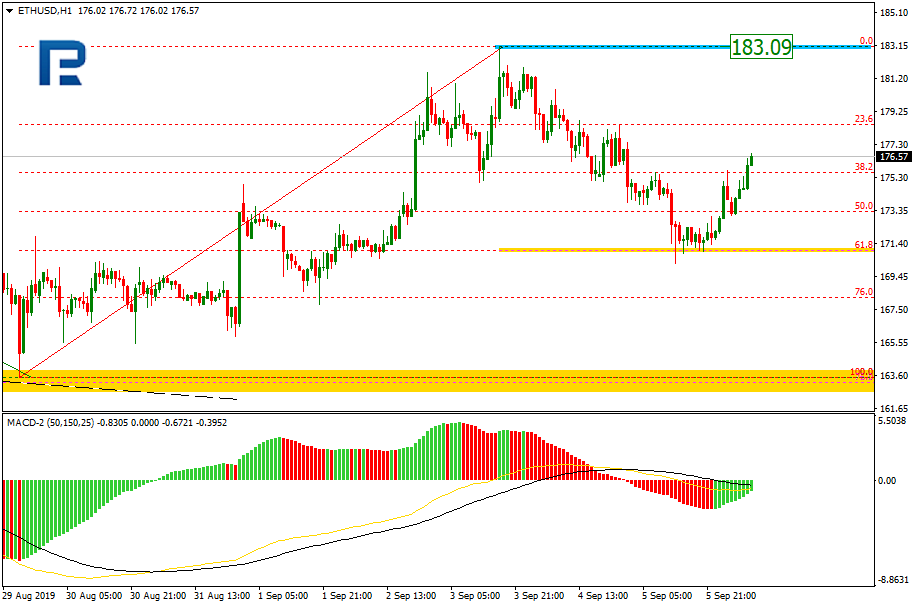
In the H1 chart, after completing the descending correction at 61.8% fibo, the price is starting a new impulse to the upside to reach the high at 183.09.
Forecasts presented in this section only reflect the author’s private opinion and should not be considered as guidance for trading. RoboForex bears no responsibility for trading results based on trading recommendations described in these analytical reviews.
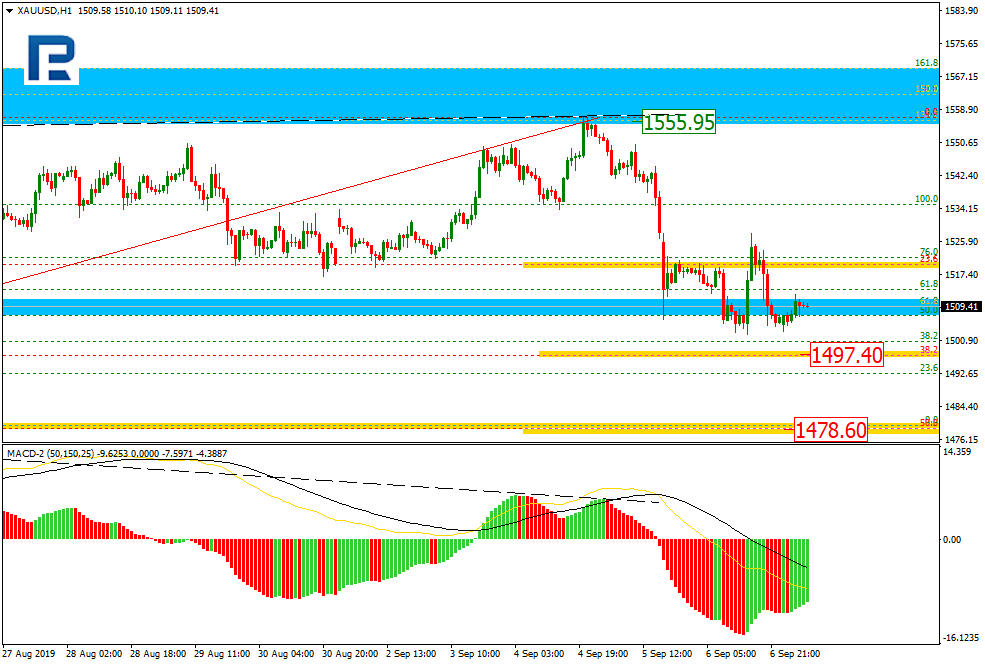
As we can see in the H4 chart, after updating the previous high and attempting to enter the post-correctional extension area between 138.2% and 161.8% fibo at 1555.95 and 1569.17 respectively, XAUUSD has started a new decline, which is now getting close to 38.2% fibo at 1497.40. The next possible targets may be 50.0%, 61.8%, and 76.0% fibo at 1478.60, 1460.25, and 1438.15 respectively.
In the H1 chart, after finishing the descending impulse, the pair is correcting and moving sideways between 23.6% and 38.2% fibo.
USDCHF, “US Dollar vs Swiss Franc”
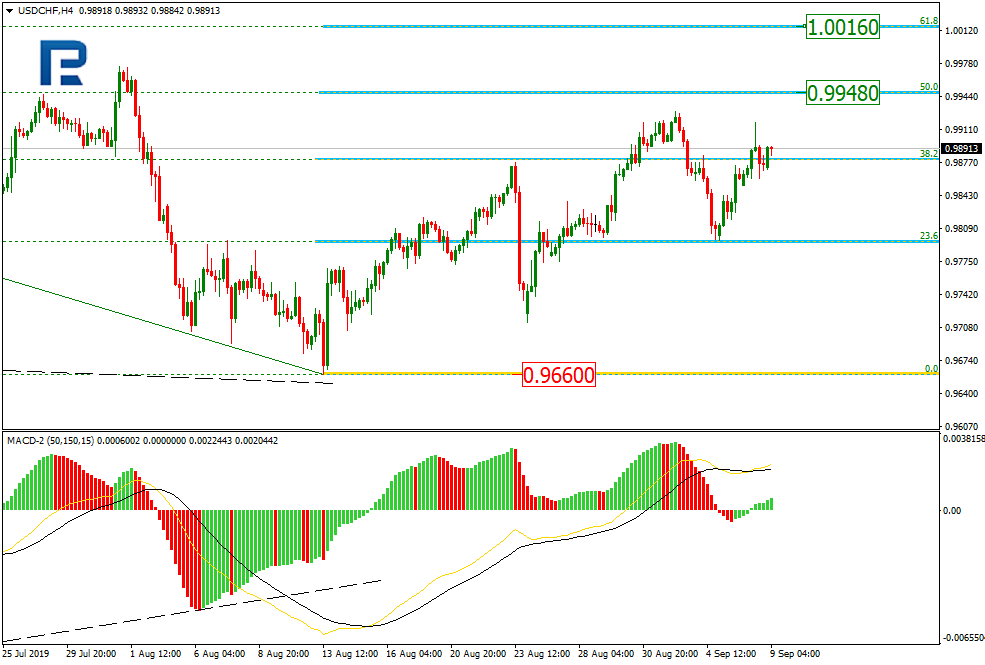
As we can see in the H4 chart, USDCHF continues forming the mid-term uptrend after the convergence. After correcting towards 23.6%, the pair is forming a new rising impulse and testing 38.2% fibo again. The next upside targets may be 50.0% and 61.8% fibo at 0.9948 and 1.0016 respectively.
The H1 chart shows more detailed structure of the current rising correction. USDCHF is forming a rising impulse towards the local high at 0.9929. After breaking it, the price may continue growing to reach the post-correctional extension area between 138.2% and 161.8% fibo at 0.9980 and 1.0010 respectively. The key support is at 0.9797.
Forecasts presented in this section only reflect the author’s private opinion and should not be considered as guidance for trading. RoboForex bears no responsibility for trading results based on trading recommendations described in these analytical reviews.
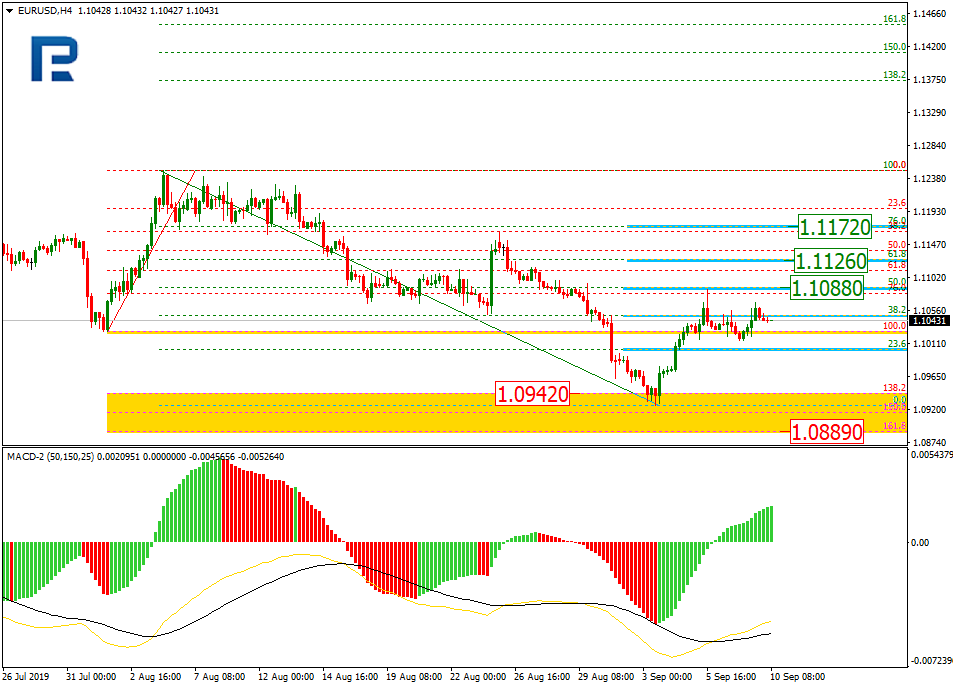
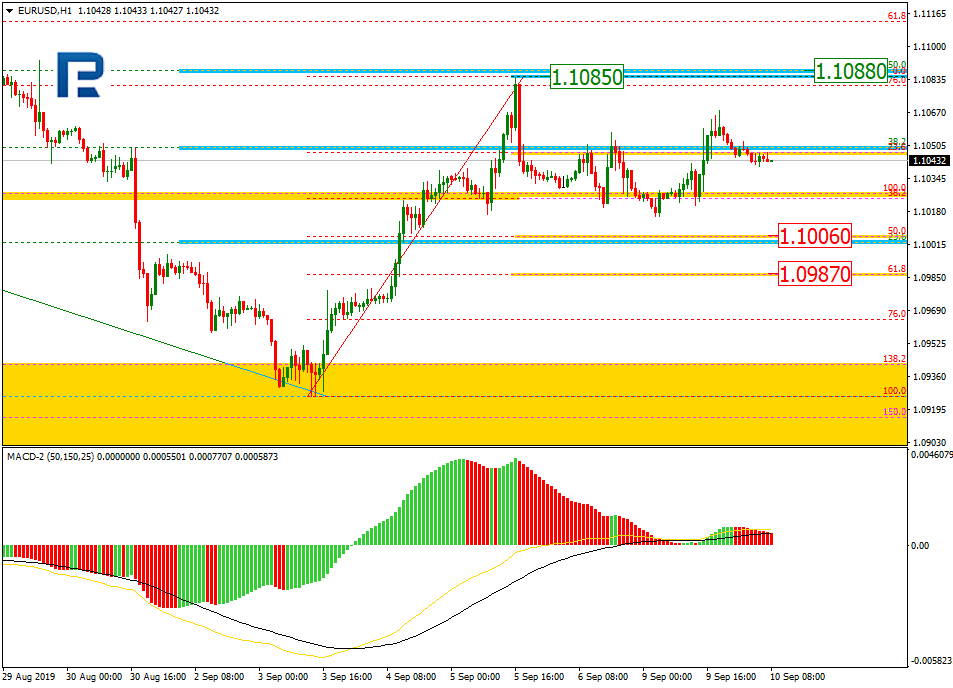
As we can see in the H4 chart, after entering the post-correctional extension area between 138.2% and 161.8% fibo at 1.0942 and 1.0889 respectively, EURUSD is correcting towards 50.0% fibo at 1.1088. In the future, the correction may continue to reach 61.8% and 76.0% fibo at 1.1126 and 1.1172 respectively.
In the H1 chart, after finishing the rising impulse, the pair is correcting downwards and has already reached 38.2% fibo. Later, the pullback may continue towards 50.0% and 61.8% fibo at 1.1006 and 1.0987 respectively. If the price breaks the high at 1.1085, the mid-term uptrend may continue.
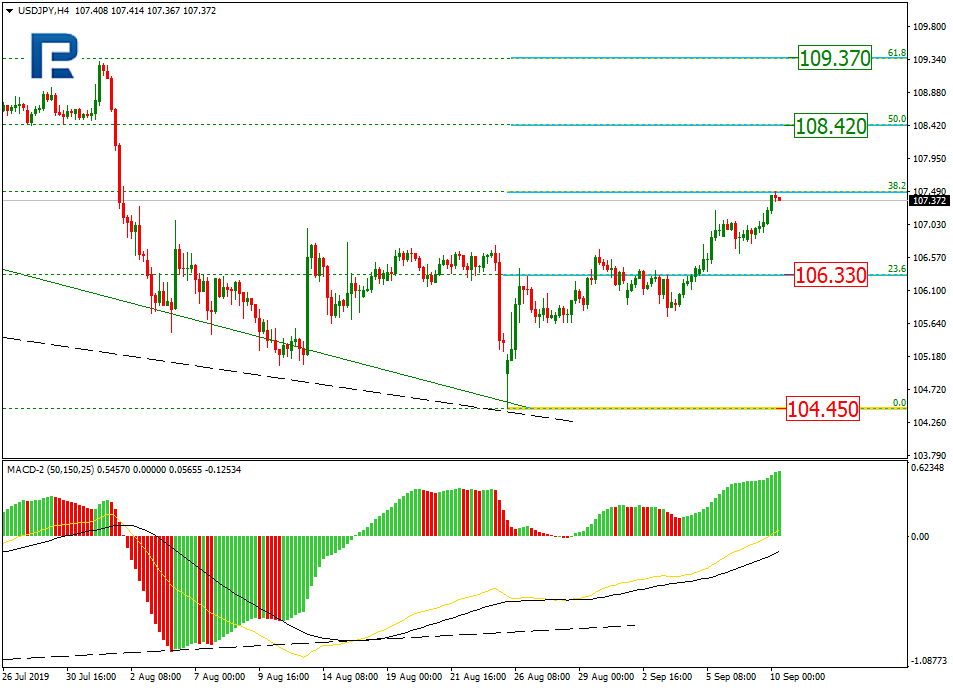
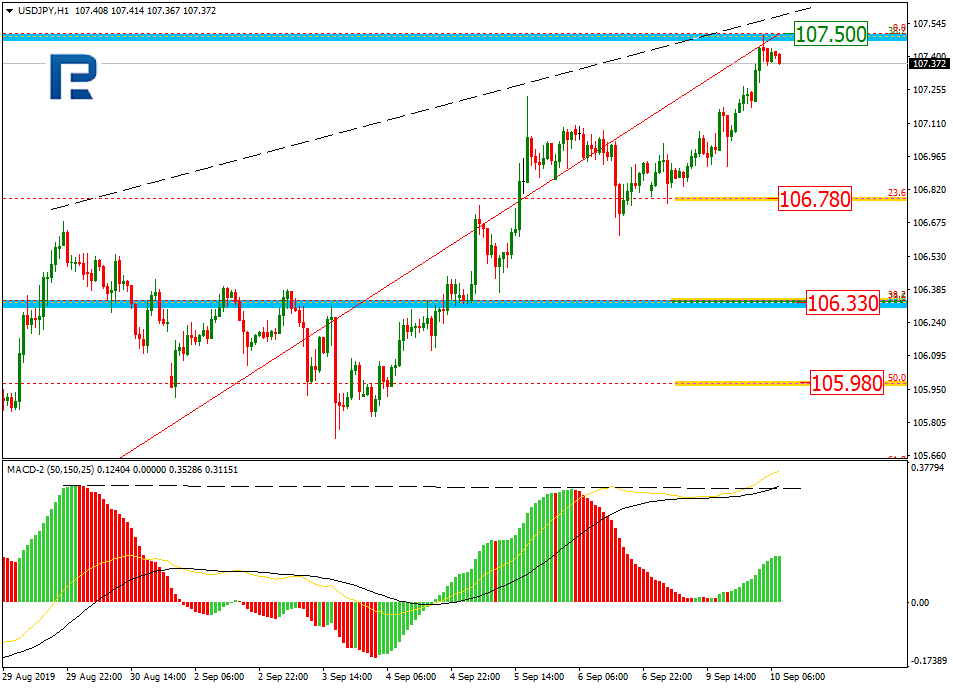
USDJPY, “US Dollar vs. Japanese Yen”
As we can see in the H4 chart, the correctional uptrend continues; it has already reached 38.2% fibo. In the short-term, the price may start a new correction towards 23.6% fibo at 106.33. After the correction, USDJPY may resume moving upwards to reach 50.0% and 61.8% fibo at 108.42 and 109.37 respectively. The key support is at 104.45.
In the H1 chart, there is a divergence on MACD within the uptrend, which may indicate a new pullback soon with the target at 23.6%, 38.2%, and 50.0% fibo at 106.78, 106.33, and 105.98 respectively. If the price breaks the high at 107.50, the instrument may resume trading upwards.
Forecasts presented in this section only reflect the author’s private opinion and should not be considered as guidance for trading. RoboForex bears no responsibility for trading results based on trading recommendations described in these analytical reviews.
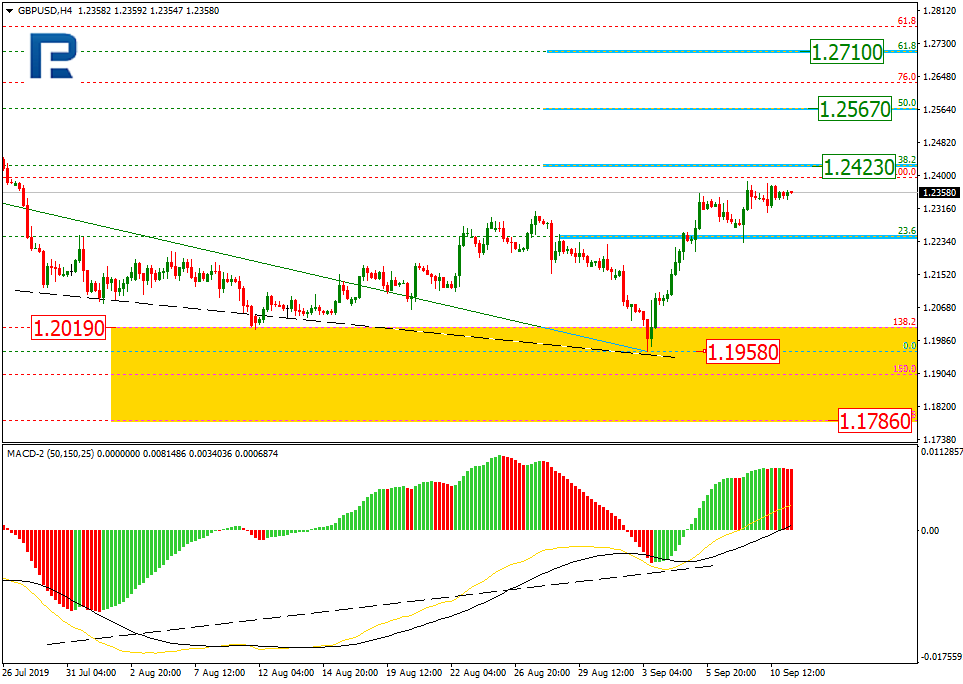
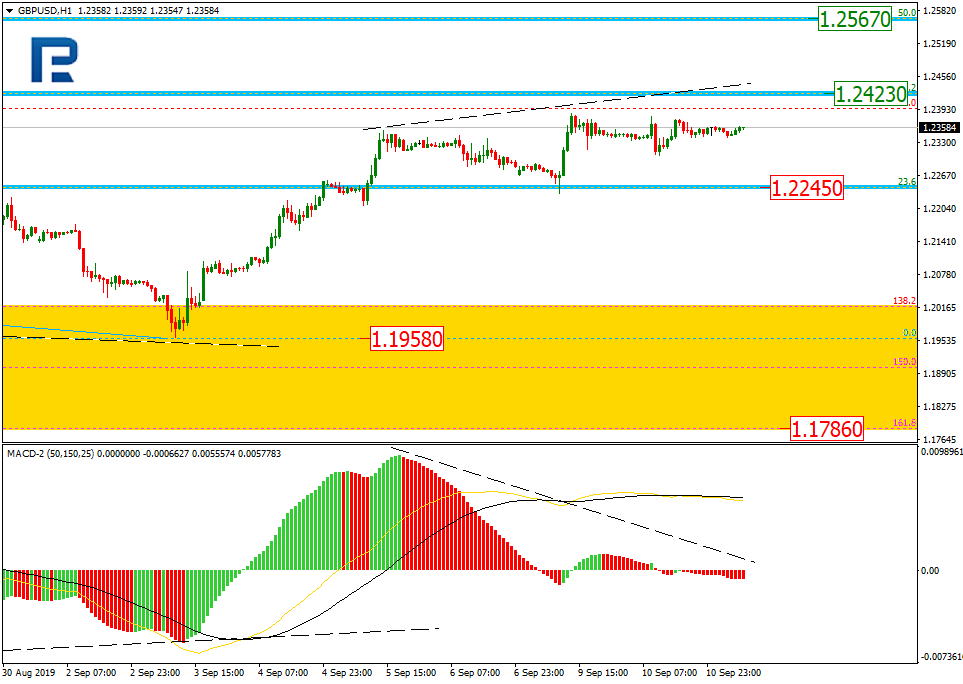
As we can see in the H4 chart, after testing the post-correctional extension area between 138.2% and 161.8% fibo at 1.2019 and 1.1786 respectively, GBPUSD is trading upwards and has already reached 38.2% fibo at 1.2423. The next upside targets may be 50.0% and 61.8% fibo at 1.2567 and 1.2710 respectively. The key support is at 1.1958.
In the H1 chart, the pair is slowing down on its way towards 38.2% fibo at 1.2423 because of the convergence on MACD, which may indicate a new correction soon. The target of this pullback may be 23.6% fibo at 1.2245.
EURJPY, “Euro vs. Japanese Yen”
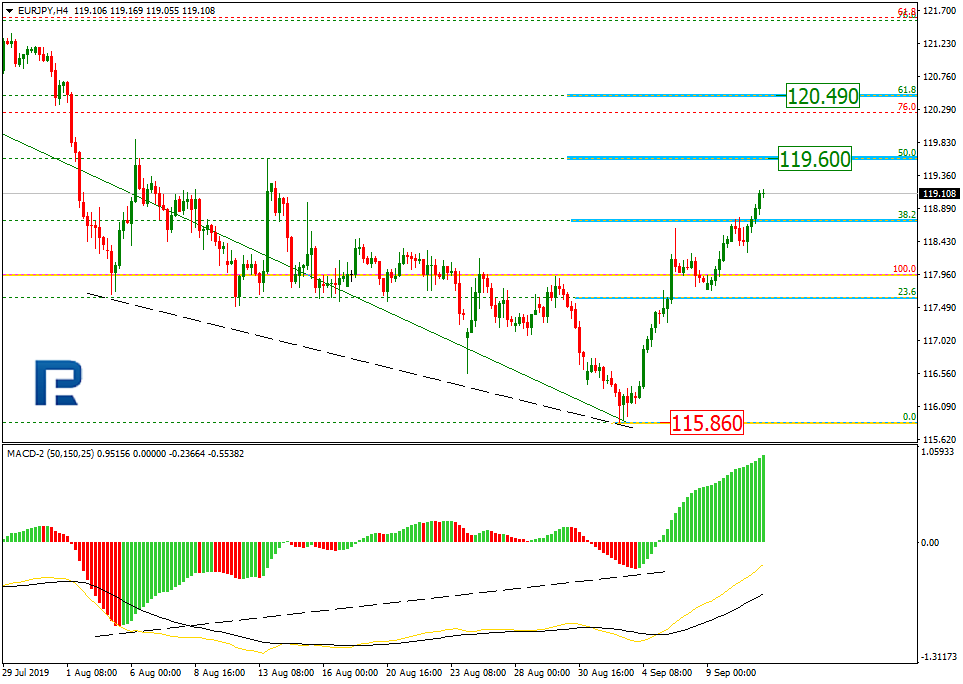
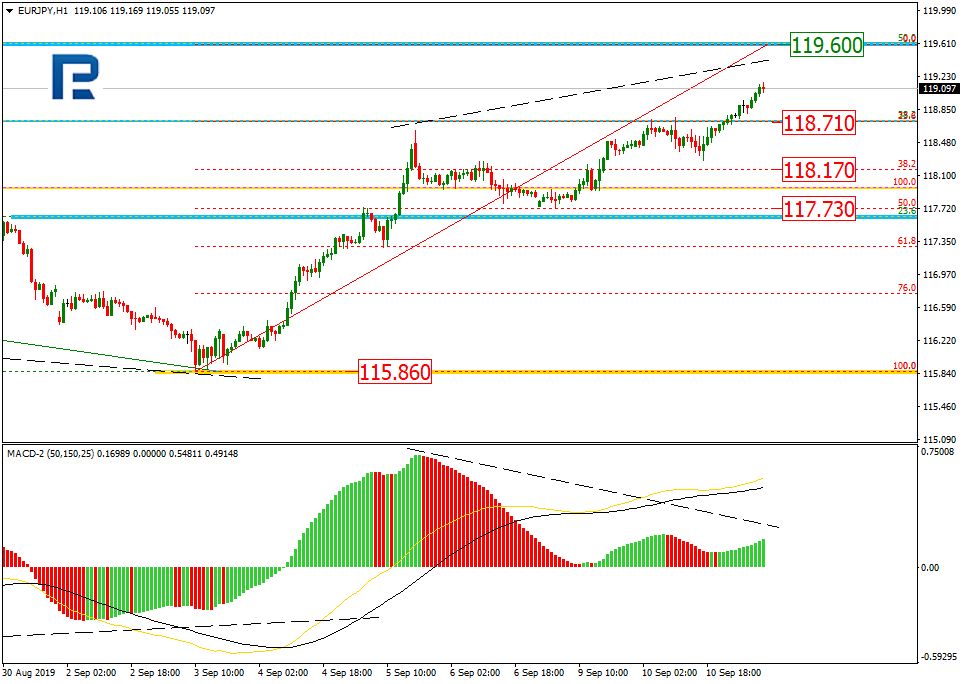
As we can see in the H4 chart, the convergence made EURJPY start a quick correctional uptrend, which is getting close to 50.0% fibo at 119.60. The next upside target may be 61.8% fibo at 120.49. The key support is the low at 115.86.
In the H1 chart, there is a divergence within the uptrend on MACD. After reaching 50.0% fibo at 119.60, the instrument is expected to start a new correction towards 23.6%, 38.2%, and 50.0% fibo at 118.71, 118.17, and 117.73 respectively.
Forecasts presented in this section only reflect the author’s private opinion and should not be considered as guidance for trading. RoboForex bears no responsibility for trading results based on trading recommendations described in these analytical reviews.