12.09.2019
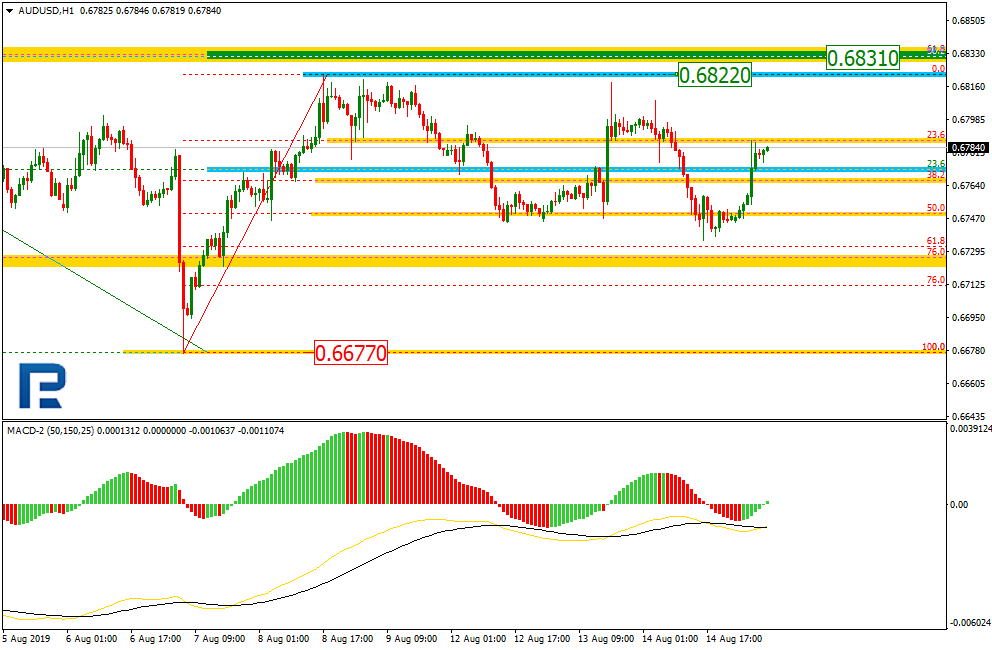
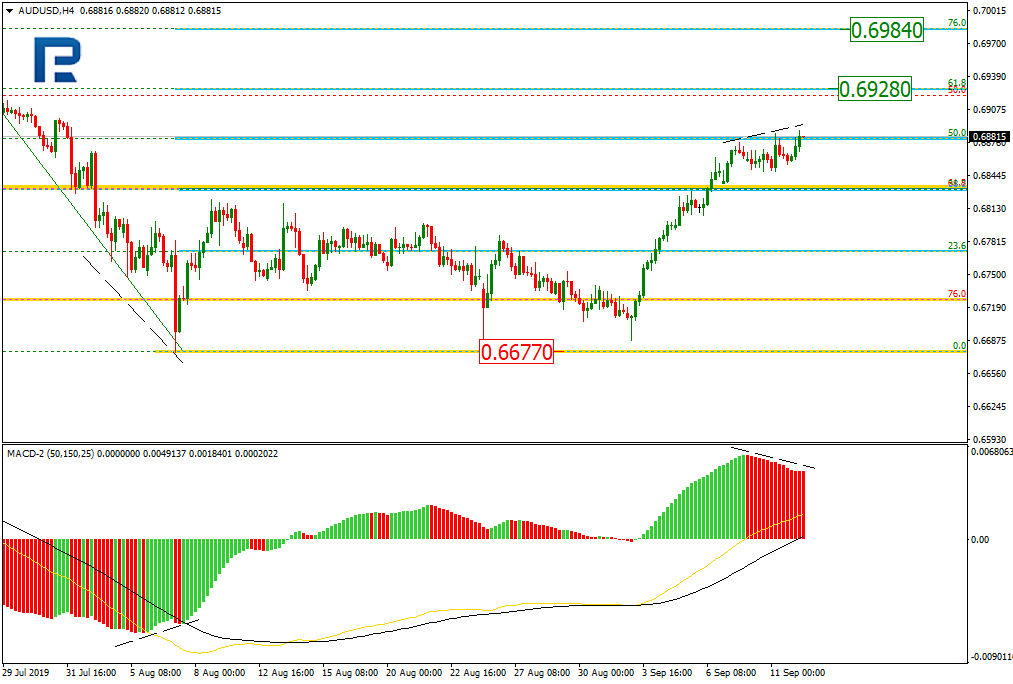
AUDUSD, “Australian Dollar vs US Dollar”
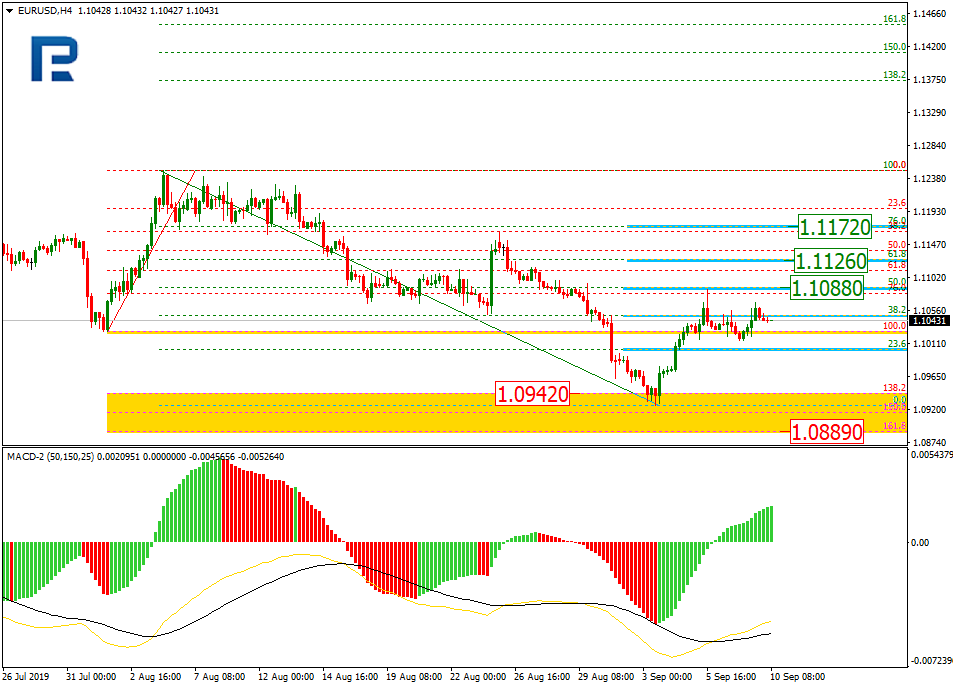
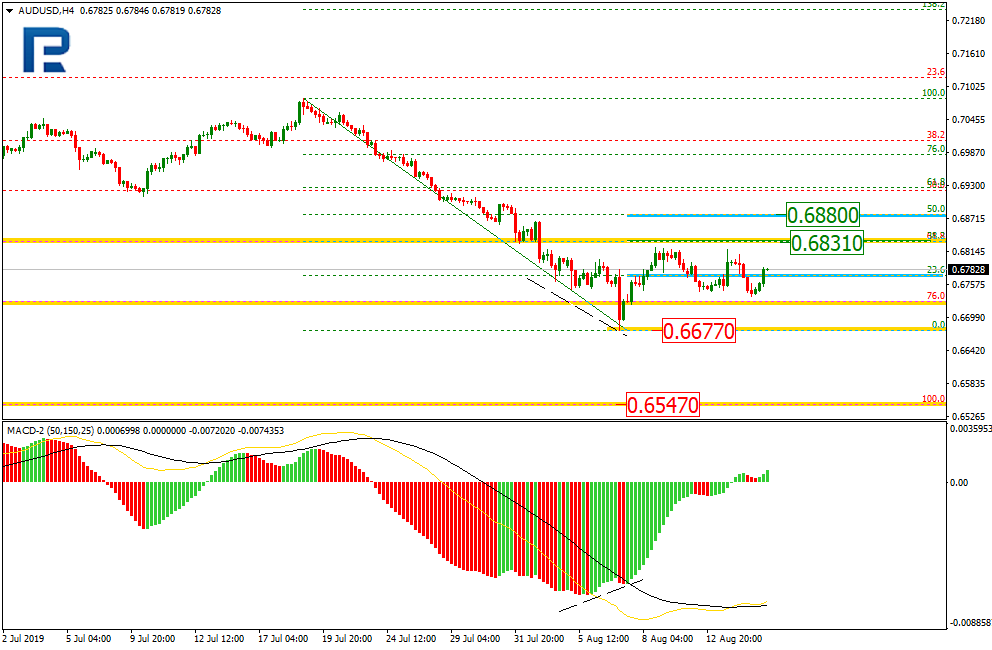
As we can see in the H4 chart, the current correctional uptrend has already reached 50.0% fibo and may continue growing towards 61.8% and 76.0% fibo at 0.6928 and 0.6984 respectively. At the same time, there is a divergence on MACD, which may indicate a possible correction.

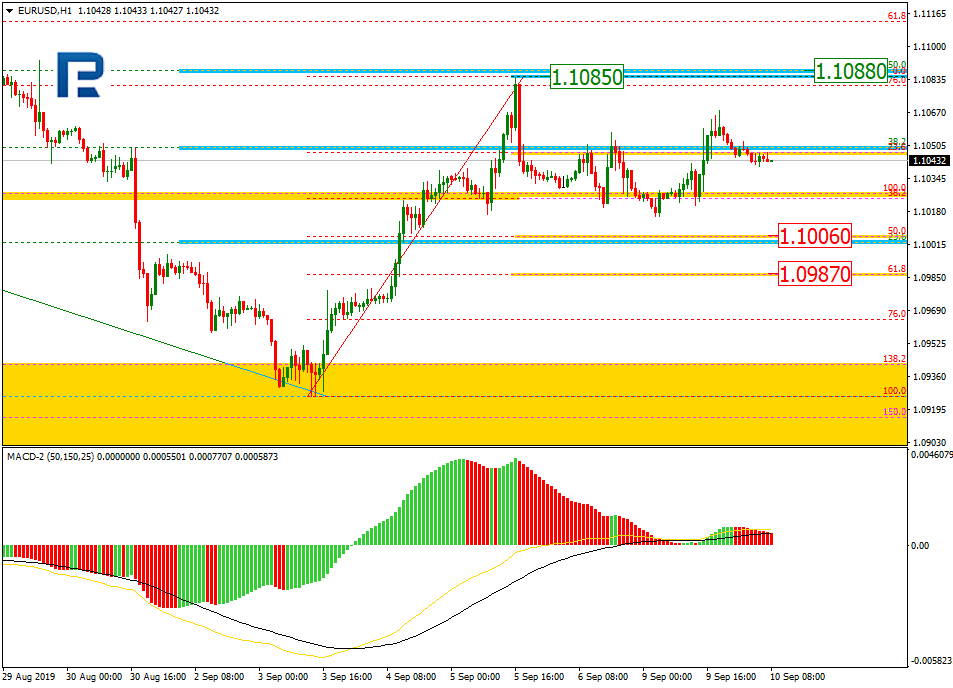
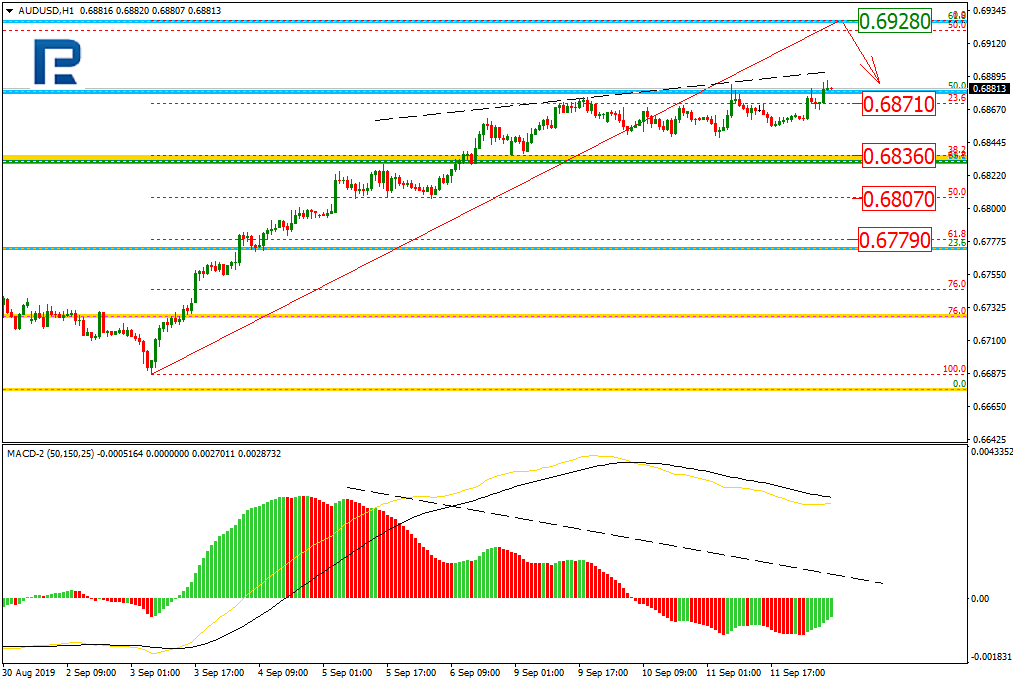
In the H1 chart, there is a divergence on MACD, which is making AUDUSD slow down the current rising tendency. Possibly, after reaching 61.8% at 0.6928, the price may start a pullback. The target of this pullback may be 23.6%, 38.2%, 50.0%, and 61.8% fibo at 0.6871, 0.6836, 0.6807, and 0.6779 respectively.
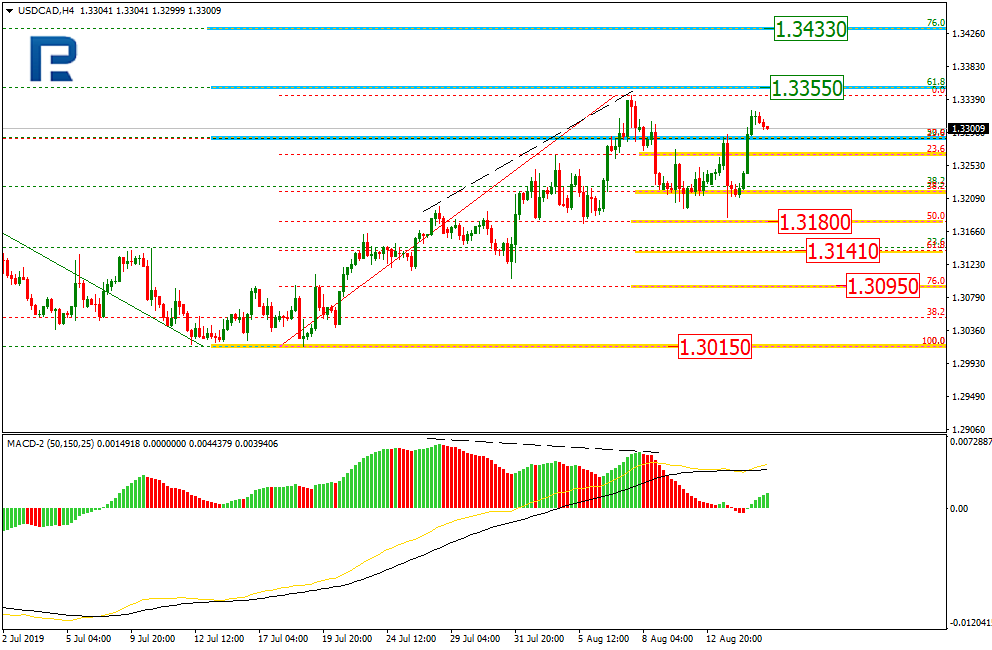
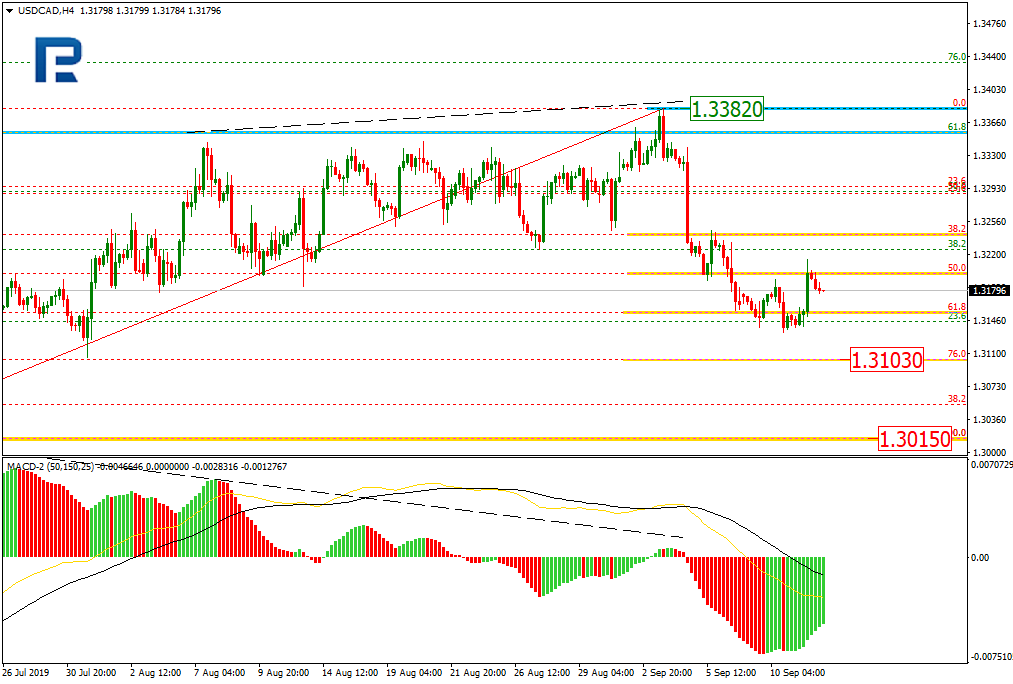
USDCAD, “US Dollar vs Canadian Dollar”
As we can see in the H4 chart, the divergence made USDCAD start a new descending wave, which has already reached 61.8% fibo. In the nearest future, the pair may start a new pullback. After completing the pullback, the instrument may resume falling towards 76.0% fibo at 1.3103 and then the low at 1.3015.
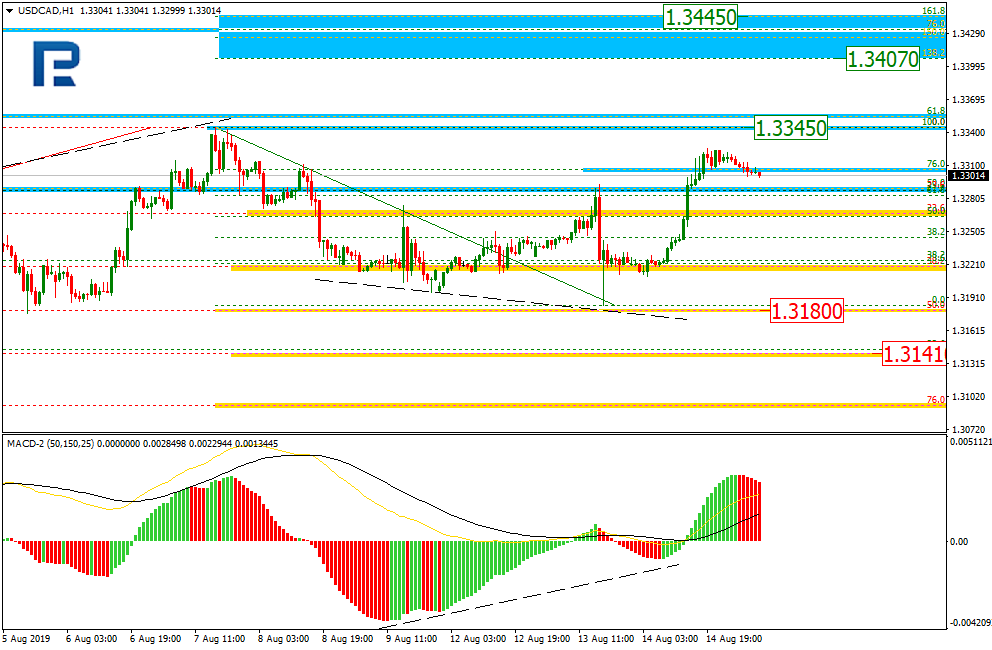
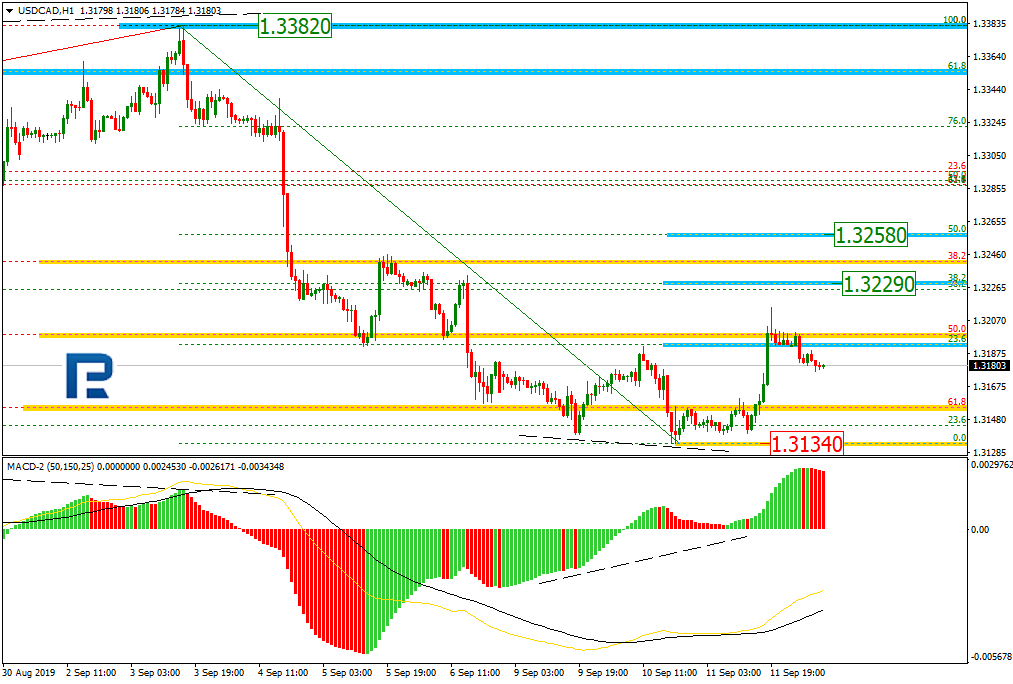
In the H1 chart, the pair is correcting after the convergence and has already reached 23.6% fibo. The next upside targets may be 38.2% and 50.0% fibo at 1.3229 and 1.3258 respectively. The support is the low at 1.3134.
Back to listAttention!
Forecasts presented in this section only reflect the author’s private opinion and should not be considered as guidance for trading. RoboForex bears no responsibility for trading results based on trading recommendations described in these analytical reviews.