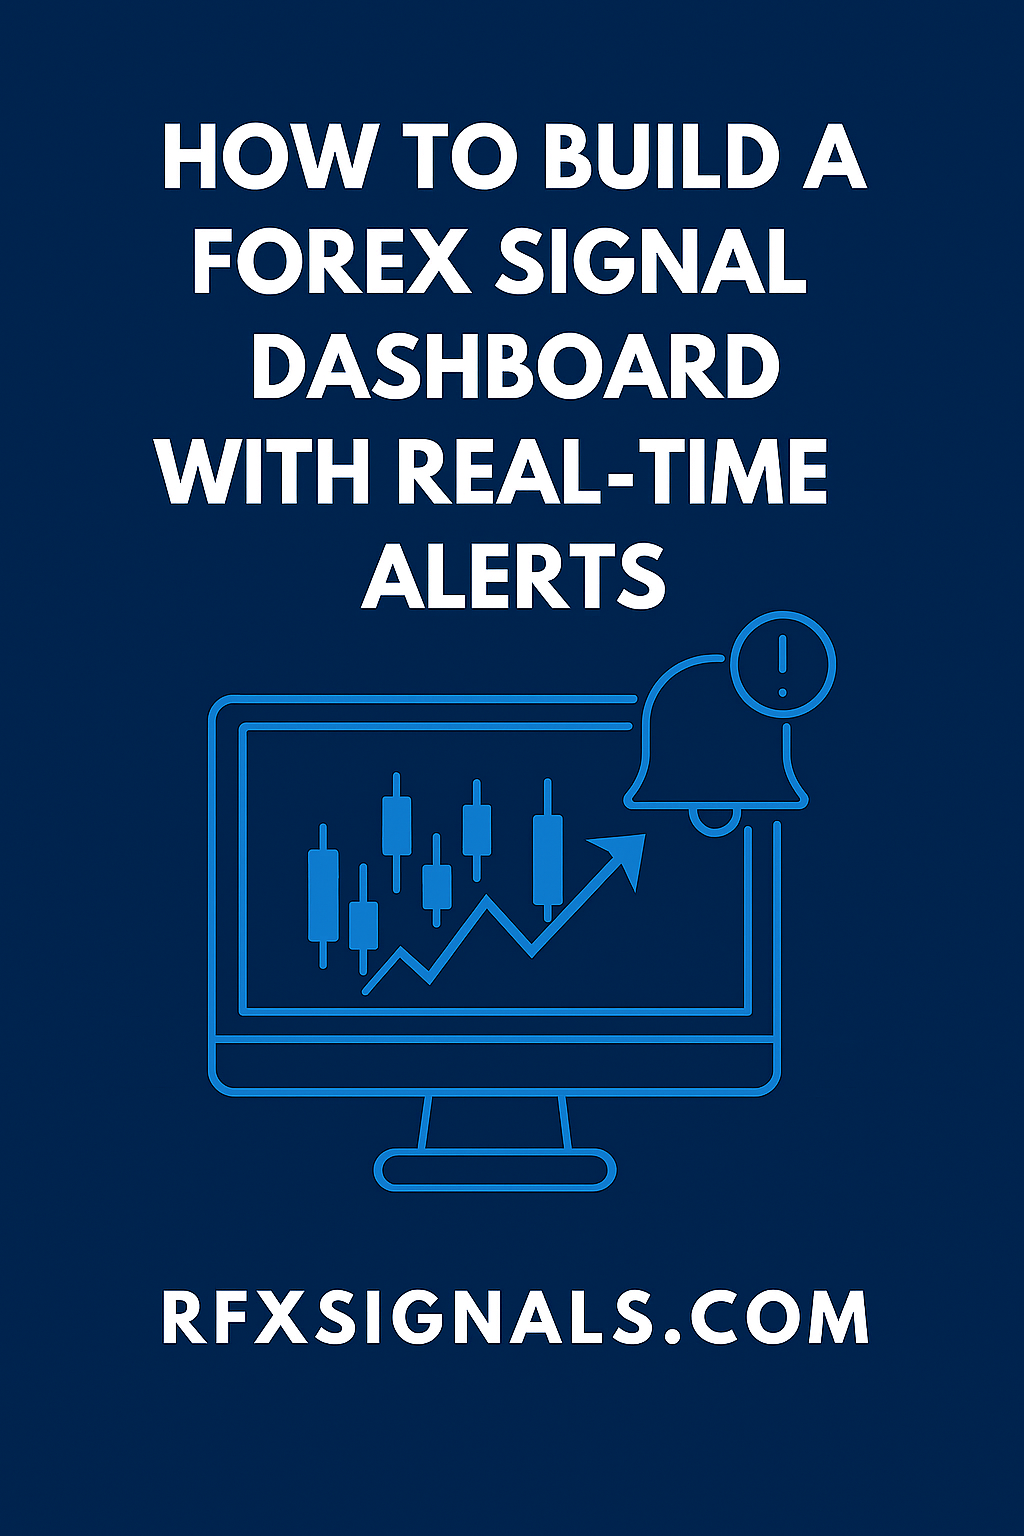
Fibonacci Retracements Analysis 27.08.2021 (AUDUSD, USDCAD)

AUDUSD, “Australian Dollar vs US Dollar”

In the daily chart, the downtrend is looking quite stable despite the current correction to the upside, which started after an attempt to test 38.2% at 0.7052. After the pullback is over, the asset may continue trading towards 50.0% and 61.8% fibo at 0.6758 and 0.6464 respectively. The key resistance is the high at 0.8007.

AUDUSD_DAILY
Risk Warning: the result of previous trading operations do not guarantee the same results in the future

The H4 chart of AUDUSD shows the potential upside correctional targets are convergence on MACD – 23,6%, 38.2%, and 50.0% at 0.7292, 0.7406, and 0.7498 respectively. A breakout of the local support at 0.7106 will lead to a further mid-term downtrend.

AUDUSD_H4
Risk Warning: the result of previous trading operations do not guarantee the same results in the future

USDCAD, “US Dollar vs Canadian Dollar”

As we can see in the daily chart, after an attempt to reach 38.2% fibo at 1.3022 and local divergence on MACD, the pair is correcting downwards. After finishing the pullback, the asset may form a new wave to the upside with the targets at 50.0% and 61.8% fibo at 1.3336 and 1.3650 respectively. The key support remains at the low at 1.2007.

USDCAD_D1
Risk Warning: the result of previous trading operations do not guarantee the same results in the future

The H4 chart shows the potential targets of the current descending correction. After divergence on MACD, the pair was falling and reached 38.2% but then rebounded from it. The next descending impulse may head towards 50.0%, 61.8%, and 76.0% fibo at 1.2478, 1.2366, and 1.2234 respectively. The local resistance is the fractal high at 1.2949.

USDCAD_H4
Risk Warning: the result of previous trading operations do not guarantee the same results in the future

EURUSD is hanging in the air. Overview for 27.08.2021

EURUSD remains stable in anticipation of Powell’s comments.

The major currency pair remains neutral in anticipation of the speech to be delivered by the US Fed Chairman Jerome Powell. The current quote for the instrument is 1.1760.

Yesterday, monetary policymakers shared their opinions in Jackson Hole and commented on the reduction of the regulator’s stimulus programs. The common voice is quite positive and the current economic recovery allows to decrease the QE program volume as early as the end of 2021. The key reason for this is the inflation boost and uncertainty of how the indicator might behave next year.

At the moment, the volume of the Fed’s program is $120 billion every month. Sure, this volume might have been already reduced – it is what market players are expecting since the American economy improved pretty much, which is confirmed by the macroeconomic statistics.

The second estimate of the US GDP for the second quarter of 2021 was good: the indicator showed 6.6% against the previous estimate of 6.5%. although it was expected to improve up to 6.7%. However, there will be the third estimate, which may show an even better number.

Today, apart from the comments from Jackson Hole, one should pay attention to the reports on the Personal Income/Spending from the USA. Also, there will be the revised data on the Consumer Sentiment from the University of Michigan, which is expected to improve in August.

Japanese Candlesticks Analysis 26.08.2021 (XAUUSD, NZDUSD, GBPUSD)

XAUUSD, “Gold vs US Dollar”

As we can see in the H4 chart, the correction within the uptrend continues. After forming several reversal patterns, such as Hammer, not far from the support level, XAUUSD may reverse and start a new growth to reach the resistance area at 1830.00. At the same time, an opposite scenario implies that the price may continue falling towards 1760.50 before resuming its ascending tendency.

XAUUSD
Risk Warning: the result of previous trading operations do not guarantee the same results in the future

NZDUSD, “New Zealand vs US Dollar”

As we can see in the H4 chart, after testing the resistance area, NZDUSD has formed several reversal patterns, such as Harami. At the moment, the asset may reverse in the form of a new pullback. In this case, the correctional target may be the support level at 0.6905. After testing this level, the asset may rebound from it and continue moving upwards. However, an alternative scenario implies that the price may grow to reach 0.7035 without correcting towards the support level.

NZDUSD
Risk Warning: the result of previous trading operations do not guarantee the same results in the future

GBPUSD, “Great Britain Pound vs US Dollar”

As we can see in the H4 chart, the asset is still forming another correctional wave. By now, GBPUSD has formed several reversal patterns, such as Hammer and Engulfing, not far from the support level. At the moment, the pair is reversing and starting a new growth. In this case, the upside target may be the channel’s upside border at 1.3785. After testing this level, the market may rebound from it and resume falling. Still, there might be an alternative scenario, according to which the asset may fall towards the next support area at 1.3640 without testing the resistance area.

GBPUSD
Risk Warning: the result of previous trading operations do not guarantee the same results in the future

Ichimoku Cloud Analysis 26.08.2021 (USDCHF, EURJPY, USDJPY)

USDCHF, “US Dollar vs Swiss Franc”

USDCHF is trading at 0.9146; the instrument is moving below Ichimoku Cloud, thus indicating a descending tendency. The markets could indicate that the price may test the cloud’s downside border at 0.9155 and then resume moving downwards to reach 0.9010. Another signal in favor of a further downtrend will be a rebound from the upside border of a Triangle pattern. However, the bearish scenario may no longer be valid if the price breaks the cloud’s upside border and fixes above 0.9190. In this case, the pair may continue growing towards 0.9275. To confirm further decline, the asset must break the pattern’s downside border and fix below 0.9085.

USDCHF
Risk Warning: the result of previous trading operations do not guarantee the same results in the future

EURJPY, “Euro vs Japanese Yen”

EURJPY is trading at 129.38; the instrument is moving above Ichimoku Cloud, thus indicating an ascending tendency. The markets could indicate that the price may test the cloud’s upside border at 128.95 and then resume moving upwards to reach 130.60. Another signal in favor of a further uptrend will be a rebound from the rising channel’s downside border. However, the bullish scenario may no longer be valid if the price breaks the cloud’s downside border and fixes below 128.25. In this case, the pair may continue falling towards 127.35.

EURJPY
Risk Warning: the result of previous trading operations do not guarantee the same results in the future

USDJPY, “US Dollar vs Japanese Yen”

USDJPY is trading at 109.98; the instrument is moving above Ichimoku Cloud, thus indicating an ascending tendency. The markets could indicate that the price may test the cloud’s downside border at 109.75 and then resume moving upwards to reach 111.05. Another signal in favor of a further uptrend will be a rebound from the downside border of the Triangle pattern. However, the bullish scenario may no longer be valid if the price breaks the cloud’s downside border and fixes below 109.25. In this case, the pair may continue falling towards 108.35. To confirm further growth, the asset must break the pattern’s upside border and fix above 110.30.

USDJPY
Risk Warning: the result of previous trading operations do not guarantee the same results in the future

Fibonacci Retracements Analysis 26.08.2021 (Brent, Dow Jones)

Brent

In the H4 chart, Brent is steadily moving upwards after convergence on MACD and has already reached 50.0% fibo. Later, the asset may continue growing towards 61.8% fibo at 72.72. This ascending movement should be considered as a correction, that’s why it may later be followed by a new decline to break the low at 65.03 and reach the mid-term 23.6% fibo at 62.90. The resistance is still close to the high at 77.48.

BRENT_H4
Risk Warning: the result of previous trading operations do not guarantee the same results in the future

As we can see in the H1 chart, divergence on MACD is making the price complete the ascending wave and may indicate a new decline soon to reach 23.6%, 38.2%, 50.0%, 61.8%, and 76.0% fibo at 70.36, 69.35, 68.53, 67.70, and 66.72 respectively. The resistance is the local high at 72.01.

BRENT_H1
Risk Warning: the result of previous trading operations do not guarantee the same results in the future

Dow Jones

The daily chart shows another attempt to grow and break the high at 35631.0. However, as long as the price is moving below the high, divergence on MACD may force the index to continue falling. In this case, the bearish targets are 23.6%, 38.2%, 50.0%, and 61.8% fibo at 31500.0, 28980.0, 26925.0, and 24870.0 respectively.

US30CASH
Risk Warning: the result of previous trading operations do not guarantee the same results in the future

In the H1 chart, the asset is moving upwards and has already reached 76.0% fibo. This technical picture implies that the index may break the high at 35631.0 and continue growing towards the post-correctional extension area between 138.2% and 161.8% fibo at 36035.0 and 36288.00 respectively. The local support is the low at 34569.0.

DJI
Risk Warning: the result of previous trading operations do not guarantee the same results in the future

The Euro stopped growing. Overview for 26.08.2021

EURUSD is hanging in the air while anticipating the results of the first day of the Jackson Hole symposium.

The major currency pair is looking rather neutral on Thursday – everyone is expecting something to happen in Jackson Hole. The current quote for the instrument is 1.1764.

Actually, monetary policymakers will mostly talk online due to the pandemic. Today, investors are completely focused on the speech to be delivered by Jerome Powell, the US Fed chairman. No one really knows what he might say but he is mostly expected to be quite “soft” and avoid talking about an early reduction of the regulator’s stimulus programs at the end of this year. The more signals in favour of an early decrease in the QE, the better for the USD. On the other hand, the softer and more blurred QE-related comments, the higher the probability the “greenback” falls.

Among the things that may support the American currency is the piece of news saying that the USA approved vaccines from Pfizer and BioNTech, which may significantly boost the anti-coronavirus vaccination campaign. In this case, the USA may take the pandemic under control early in 2022. It means that both businesses and consumers may become more active, at least in theory. All this is undoubtedly positive for the economy.

As for the statistics, today one should pay attention to the second estimate of the US GDP for the second quarter of 2021, which is expected to show 6.7% against the previous estimate. The stronger the data, the better for the USD.

The Yen is plummeting. Overview for 26.08.2021

USDJPY has been growing for the third consecutive trading session.

The Japanese Yen is quickly falling against the USD. The current quote for the instrument is 110.20.

The problem is probably not the external background – of course, there is a demand for risks, which reduces the interest to the “safe” Yen. However, the key reasons are more global, for example, the semiconductor supply shortage. That’s quite a hit in the Japanese economy’s pocket because it’s the reason why Toyota is ready to shut down 14 facilities and reduce the output by 40% in September alone.

Shortage of chips may remain an issue at least until the end of 2021 if the pandemic continues to have a negative influence on businesses in Asia. The increasing number of new coronavirus cases in Japan, Malaysia, and China forces manufacturers to be more cautious when planning long-term. It’s not good news for the Japanese economy.

The semiconductor crisis did a lot of damage to the Japanese car manufacturers. Decreases in tax payments will influence both the country’s budget and economy in the future. Shutdowns of car factories will surely affect the export, the thing that is supporting the current recovery of the Japanese economy. However, no one can say right now when this crisis is over.

rfxsignals August 24, 2021 No Comments

Daily Free Forex Signals For 24-08- 2021

Here your going to see Daily Free Forex Signals For 24-08- 2021 to free forex signal alert from our kitkat trading system and other trading logic’s .we provide like this free forex signals from 2012 on wards with more than 50,000 traders around the world .The free forex signals have 70 to 85% quality always .we give for you a note as maximum focus take profit 1 as your target and must use stop loss values .if you have any other query’s please visit our live chat or email option


USDCHF SELL-0.91119
SL-0.91521
TP1-0.90932
TP2-0.90737

USDJPY SELL-109.514
SL-110.009
TP1-109.281
TP2-108.991

GBPJPY SELL-150.226
SL-150.723
TP1-150.015
TP2-149.788

GBPCHF SELL-1.24984
SL-1.25411
TP1-1.24771
TP2-1.24572

EURJPY SELL-128.631
SL-129.101
TP1-128.444
TP2-128.233

GBPUSD SELL-1.37053
SL-1.37508
TP1-1.36824
TP2-1.36627

rfxsignals August 18, 2021 No Comments

Daily Free Forex Signals For 18-08- 2021

Here your going to see Daily Free Forex Signals For 18-08- 2021 to free forex signal alert from our kitkat trading system and other trading logic’s .we provide like this free forex signals from 2012 on wards with more than 50,000 traders around the world .The free forex signals have 70 to 85% quality always .we give for you a note as maximum focus take profit 1 as your target and must use stop loss values .if you have any other query’s please visit our live chat or email option

GBPAUD SELL-1.89193
SL-1.89745
TP1-1.88970
TP2-1.88725

GBPCHF SELL-1.25411
SL-1.25726
TP1-1.25235
TP2-1.25066

EURNZD BUY -1.69422
SL-1.68774
TP1-1.69753
TP2-1.70036

AUDUSD SELL-0.72567
SL-0.72884
TP1-0.72362
TP2-0.72136

USDCHF SELL-0.91256
SL-0.91521
TP1-0.91019
TP2-0.90812

EURAUD BUY -1.61597
SL-1.61050
TP1-1.61887
TP2-1.62207
#mt4 #forex #forextrader #trading #forextrading #bitcoin #trader #cryptocurrency #forexlifestyle #entrepreneur #crypto #forexsignal #investment #business #binaryoption #passiveincome #daytrader #btc

Murrey Math Lines 23.07.2021 (Brent, S&P 500)

BRENT

In the H4 chart, after breaking the 200-day Moving Average, Brent is trading above it, thus indicating an ascending tendency. In this case, the price is expected to continue growing towards the resistance at 8/8. However, this scenario may no longer be valid if the asset breaks 6/8 to the downside. After that, the instrument may move downwards and reach the support at 5/8.

BRENT_H4
Risk Warning: the result of previous trading operations do not guarantee the same results in the future

As we can see in the M15 chart, the pair has broken the upside line of the VoltyChannel indicator and, as a result, may continue its growth.

BRENT_M15
Risk Warning: the result of previous trading operations do not guarantee the same results in the future

S&P 500

In the H4 chart, the S&P Index is trading above the 200-day Moving Average, thus indicating an ascending tendency. In this case, the price is expected to continue growing towards the resistance at +1/8. However, this scenario may no longer be valid if the asset breaks 8/8 to the downside. After that, the instrument may fall to reach the support at 7/8.

S&P 500_H4
Risk Warning: the result of previous trading operations do not guarantee the same results in the future

As we can see in the M15 chart, the pair has broken the upside line of the VoltyChannel indicator and, as a result, may continue trading upwards.

S&P 500_M15
Risk Warning: the result of previous trading operations do not guarantee the same results in the future