Daily Free Forex Signals For 04/05/2020
Here your going to see Daily Free Forex Signals For 04/05/2020 to free forex signal alert from our kitkat trading system and other trading logic’s .we provide like this free forex signals from 2012 on wards with more than 50,000 traders around the world .The free forex signals have 70 to 85% quality always .we give for you a note as maximum focus take profit 1 as your target and must use stop loss values .if you have any other query’s please visit our live chat or email option
GBPCAD SELL-1.75630
SL-1.76161
TP1-1.75434
TP2-1.75193
GBPNZD SELL-2.06288
SL-2.06672
TP1-2.06069
TP2-2.05856
EURNZD SELL-1.81267
SL-1.81704
TP1-1.81050
TP2-1.80873
EURAUD SELL-1.71012
SL-1.71515
TP1-1.70827
TP2-1.70638
EURGBP SELL-0.87706
SL-0.88074
TP1-0.87495
TP2-0.87295
EURCHF SELL-1.05373
SL-1.05820
TP1-1.05161
TP2-1.04919
EURCAD SELL-1.54331
SL-1.54849
TP1-1.54075
TP2-1.53841
NZDCAD BUY -0.85325
SL-0.84782
TP1-0.85571
TP2-0.87555
GBPAUD SELL-1.94663
SL-1.95078
TP1-1.94460
TP2-1.94238
GBPCHF SELL-1.19728
SL-1.21100
TP1-1.19291
TP2-1.18823
GBPJPY SELL-132.711
SL-133.446
TP1-132.380
TP2-132.063
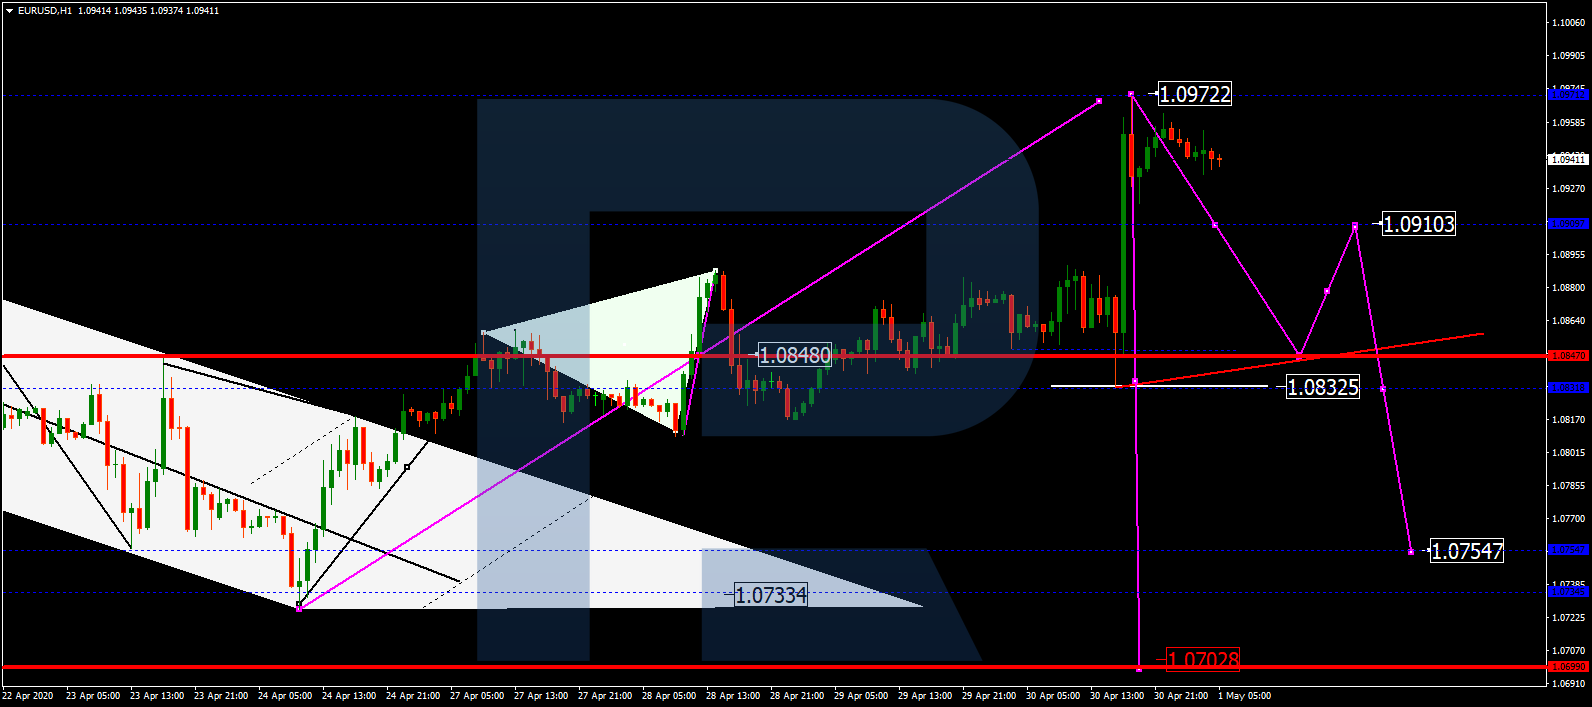
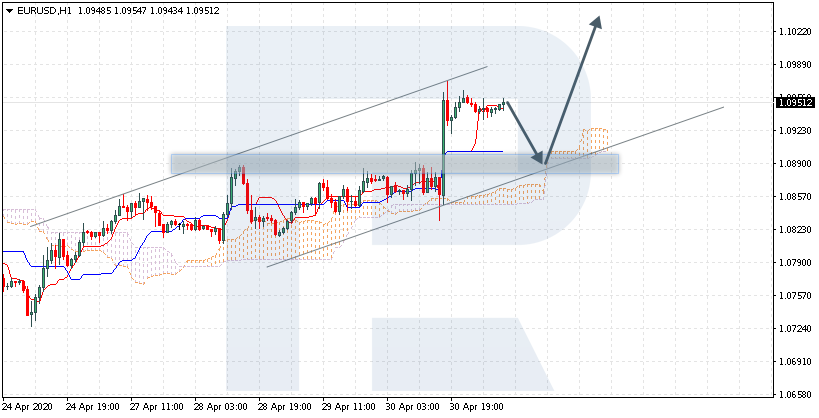
EURUSD SELL-1.09300
SL-1.09795
TP1-1.09100
TP2-1.08889
RESULT
Yesterday GBPCAD SELL SIGNAL reaches target 2 and we got 38 pips profit now 🙂
Yesterday GBPNZD SELL SIGNAL reaches target 2 and we got 40 pips profit now 🙂
Yesterday EURNZD SELL SIGNAL reaches target 2 and we got 37 pips profit now 🙂
Yesterday EURAUD SELL SIGNAL reaches target 2 and we got 40 pips profit now 🙂
Yesterday EURGBP SELL SIGNAL reaches target 1 and we got 20 pips profit now 🙂
Yesterday GBPAUD SELL SIGNAL reaches target 2 and we got 38 pips profit now 🙂
Yesterday EURUSD SELL SIGNAL reaches target 1 and we got 20 pips profit now 🙂