Fibonacci Retracements Analysis 27.12.2019 (BITCOIN, ETHEREUM)
BTCUSD, “Bitcoin vs US Dollar”
As we can see in the H4 chart, the convergence made the pair reverse and start a new rising correction, which has already reached 23.6% fibo and may yet continue towards 38.2% and 50.05% fibo at 7995.00 and 8480.00 respectively. However, if the price breaks the local low at 6430.30, BTCUSD may continue falling to reach mid-term 76.0% fibo at 5700.00. The key mid-term downside target is still the low at 3121.90.

![]()
In the H1 chart, the pair is correcting after the divergence on MACD. The price has already reached 38.2% fibo; right now, it is trading close to this level. The next descending impulse may fall to reach 50.0% and 61.8% fibo at 7059.00 and 6910.00 respectively. The resistance is the high at 7687.30.

![]()
ETHUSD, “Ethereum vs. US Dollar”
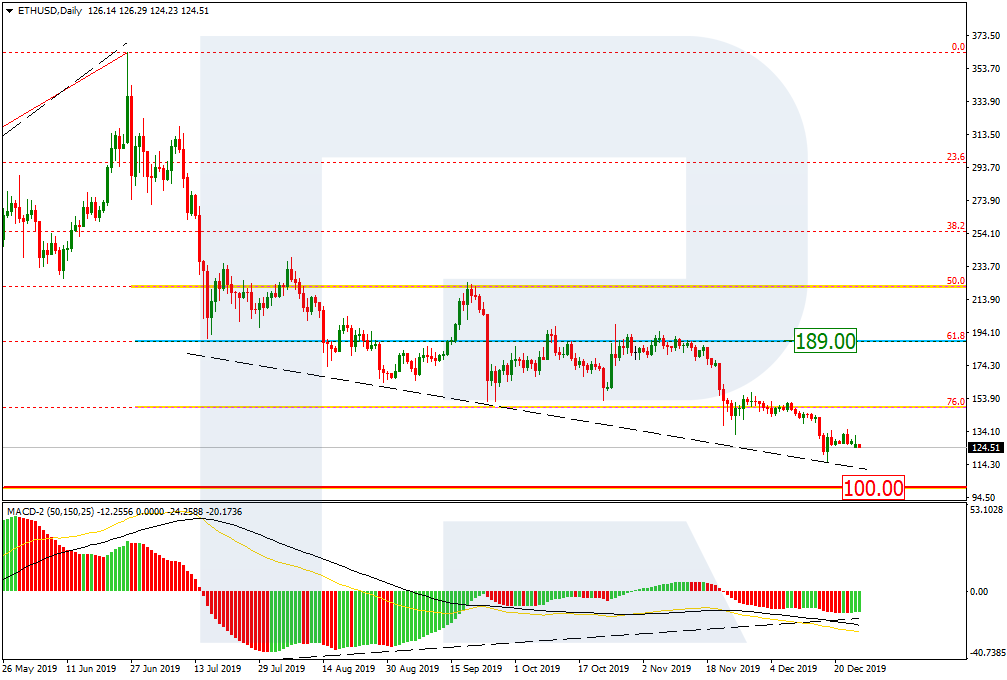
As we can see in the daily chart, the downtrend continues to reach a psychologically-crucial level of 100.00. At the same time, there is a convergence on MACD, which may indicate a new pullback towards the resistance (61.8% fibo at 189.00).

![]()
The H4 chart shows a short-term growth towards 23.6% fibo at 135.68 after the convergence. In case it breaks this level, the current rising movement may continue to reach 38.2% and 50.0% fibo at 147.70 and 157.57 respectively. However, if the pair breaks the low, it may test the support at 100.00.

![]()