Ichimoku Cloud Analysis 10.01.2020 (AUDUSD, NZDUSD, USDCAD)

Ichimoku Cloud Analysis 10.01.2020 (AUDUSD, NZDUSD, USDCAD)

10.01.2020

AUDUSD, “Australian Dollar vs US Dollar”

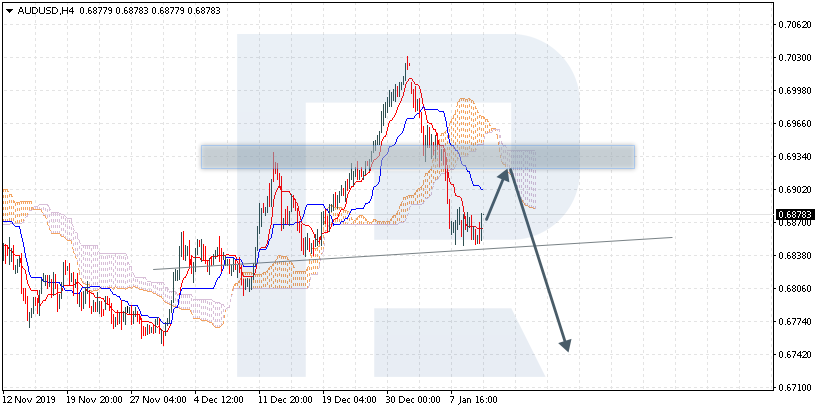
AUDUSD is trading at 0.6878; the instrument is moving below Ichimoku Cloud, thus indicating a descending tendency. The markets could indicate that the price may test the cloud’s downside border at 0.6925 and then resume moving downwards to reach 0.6745. Another signal to confirm further descending movement is the price’s rebounding from the resistance level. However, the scenario that implies further decline may be canceled if the price breaks the cloud’s upside border and fixes above 0.6975. In this case, the pair may continue growing towards 0.7055. After breaking the support area and fixing below 0.6825, the price may continue moving downwards and complete Head & Shoulders reversal pattern.
AUDUSD
Risk Warning: the result of previous trading operations do not guarantee the same results in the future

NZDUSD, “New Zealand Dollar vs US Dollar”

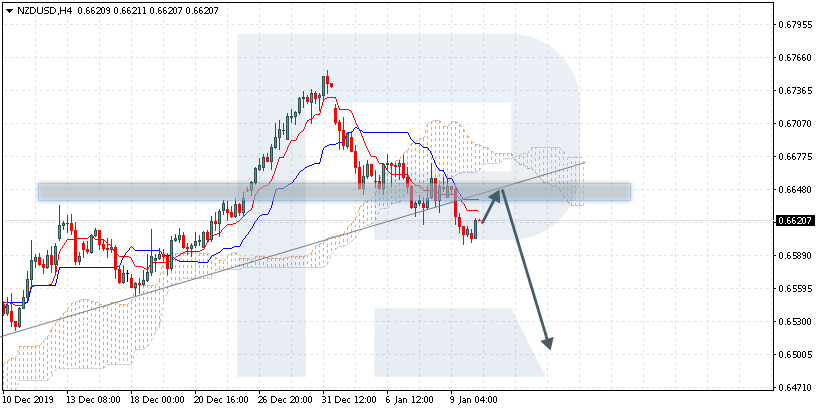
NZDUSD is trading at 0.6620; the instrument is moving below Ichimoku Cloud, thus indicating a descending tendency. The markets could indicate that the price may test Tenkan-Sen and Kijun-Sen at 0.6650 and then resume moving downwards to reach 0.6505. Another signal to confirm further descending movement is the price’s rebounding from the trend line. However, the scenario that implies further decline may be canceled if the price breaks the cloud’s upside border and fixes above 0.6715. In this case, the pair may continue growing towards 0.6805.
NZDUSD
Risk Warning: the result of previous trading operations do not guarantee the same results in the future

USDCAD, “US Dollar vs Canadian Dollar”

USDCAD is trading at 1.3060; the instrument is moving inside Ichimoku Cloud, thus indicating a sideways tendency. The markets could indicate that the price may test Tenkan-Sen and Kijun-Sen at 1.3035 and then resume moving upwards to reach 1.3195. Another signal to confirm further ascending movement is the price’s rebounding from the support level. However, the scenario that implies further growth may be canceled if the price breaks the cloud’s downside border and fixes below 1.2955. In this case, the pair may continue falling towards 1.2875.

USDCAD

Forex Technical Analysis & Forecast 10.01.2020 (EURUSD, GBPUSD, USDCHF, USDJPY, AUDUSD, USDRUB, USDCAD, GOLD, BRENT, BTCUSD)

Forex Technical Analysis & Forecast 10.01.2020 (EURUSD, GBPUSD, USDCHF, USDJPY, AUDUSD, USDRUB, USDCAD, GOLD, BRENT, BTCUSD)

10.01.2020

EURUSD, “Euro vs US Dollar”

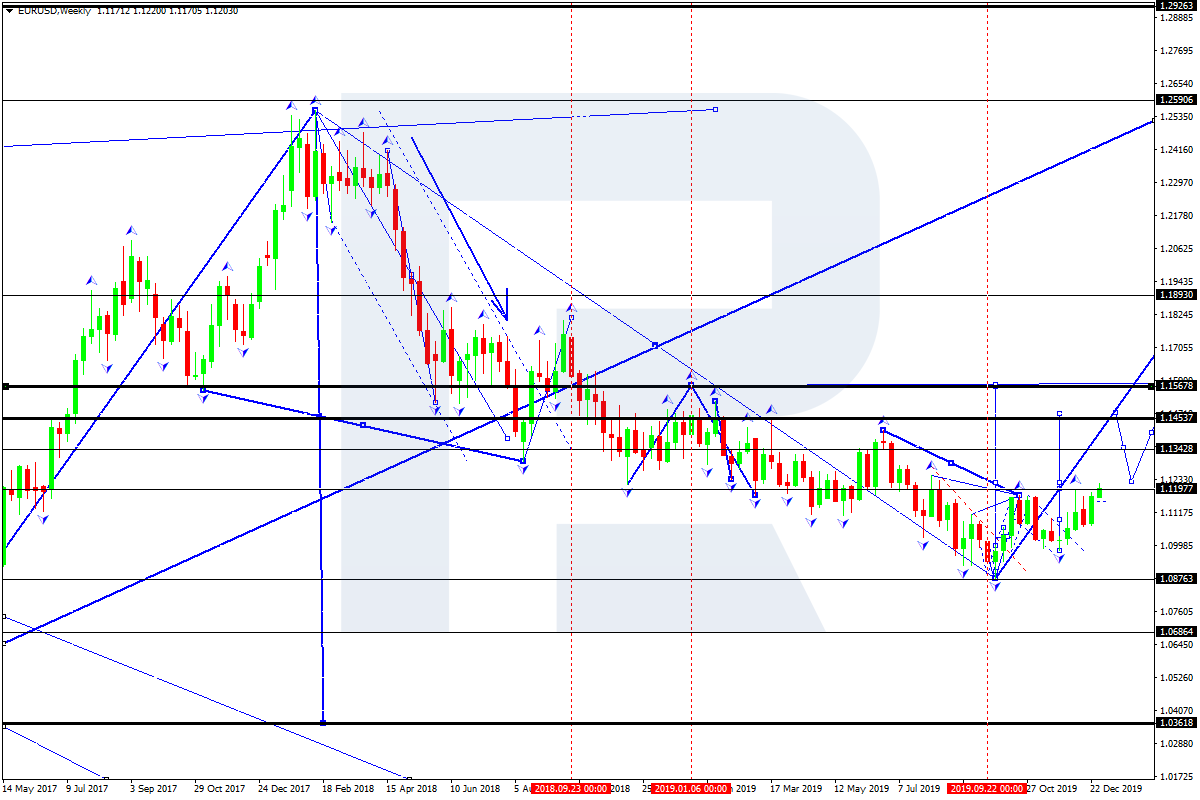
EURUSD is still moving downwards; it has formed another consolidation range around 1.1107. Today, the pair may form a new descending structure towards 1.1090 to complete the correctional wave. If the price breaks 1.1111, the instrument may resume moving upwards with the first target at 1.1200.

EURUSD
Risk Warning: the result of previous trading operations do not guarantee the same results in the future

GBPUSD, “Great Britain Pound vs US Dollar”

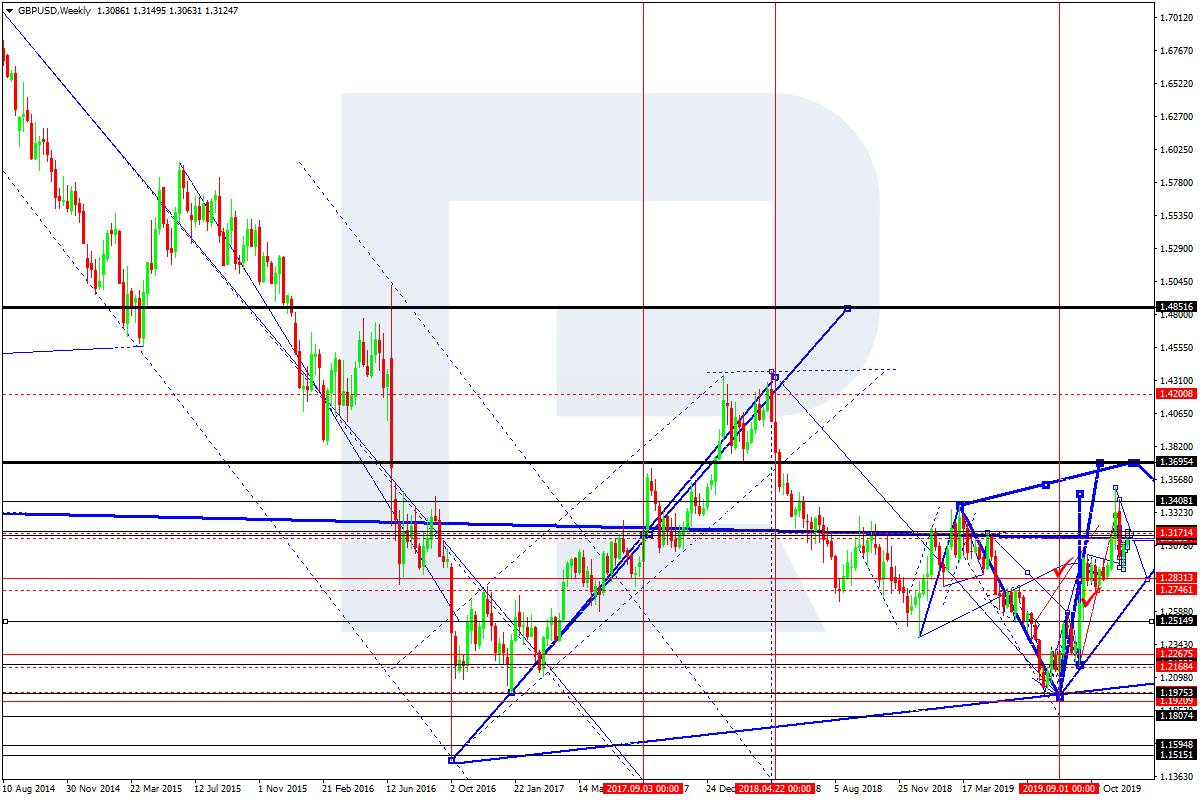
GBPUSD has reached the target of the descending structure at 1.3050, which may be considered as the first half of the third wave. Possibly, today the pair may consolidate around this level and then expand the range down to 1.3000. Later, the market may resume falling with the short-term target at 1.2888.

GBPUSD
Risk Warning: the result of previous trading operations do not guarantee the same results in the future

USDCHF, “US Dollar vs Swiss Franc”

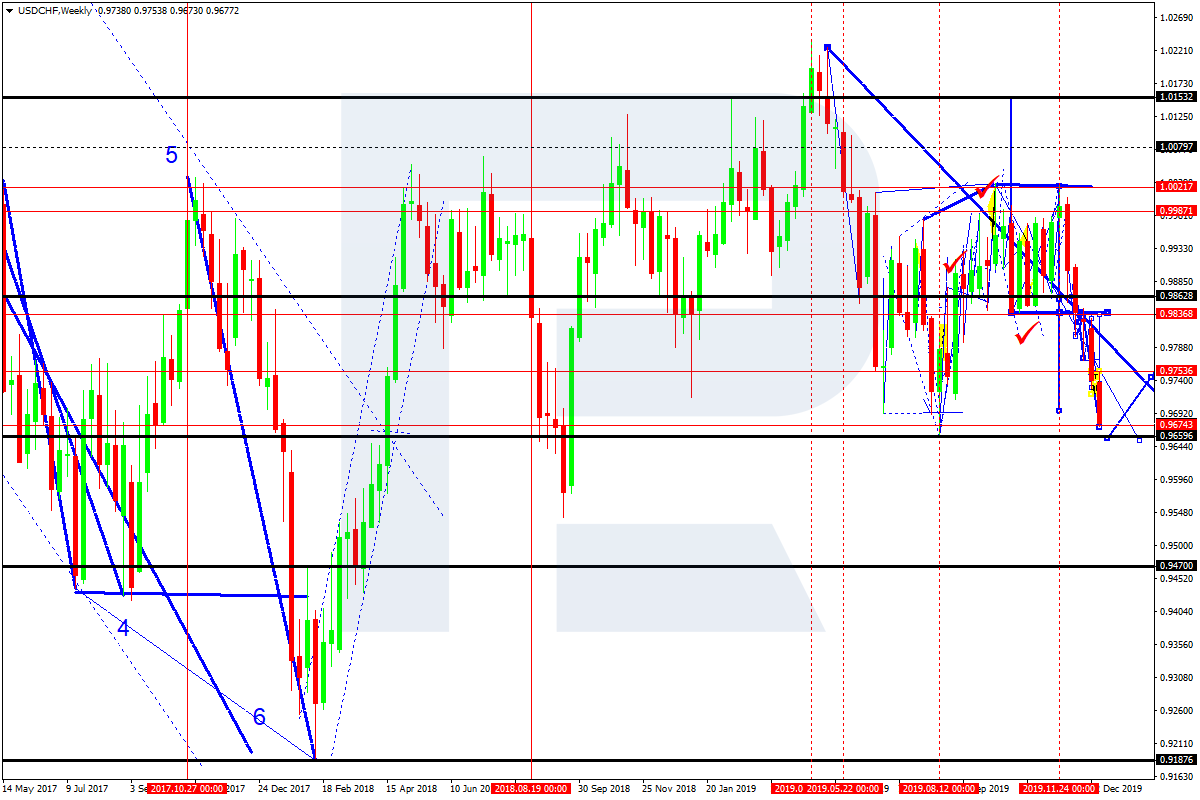
USDCHF has formed another consolidation range around 0.9718. Possibly, today the pair may grow towards 0.9770. After that, the instrument may start a new decline to reach 0.9717 and then form one more ascending structure with the target at 0.9790.

USDCHF
Risk Warning: the result of previous trading operations do not guarantee the same results in the future

USDJPY, “US Dollar vs Japanese Yen”

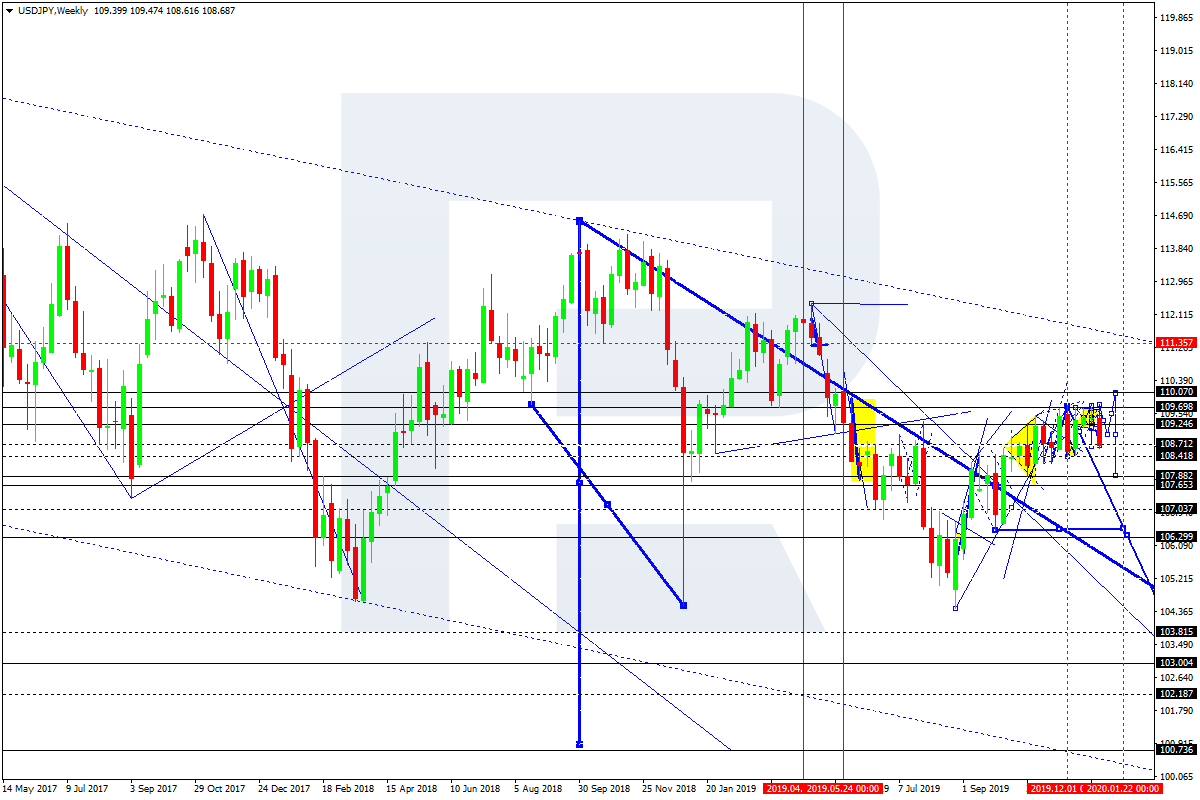
USDJPY is growing with the target at 109.75. Today, the pair may reach 109.70. Later, the market may form a new descending structure towards 109.50 and then resume moving upwards to reach the above-mentioned target and complete this ascending wave. After that, the instrument may start another decline with the first target at 107.85.

USDJPY
Risk Warning: the result of previous trading operations do not guarantee the same results in the future

AUDUSD, “Australian Dollar vs US Dollar”

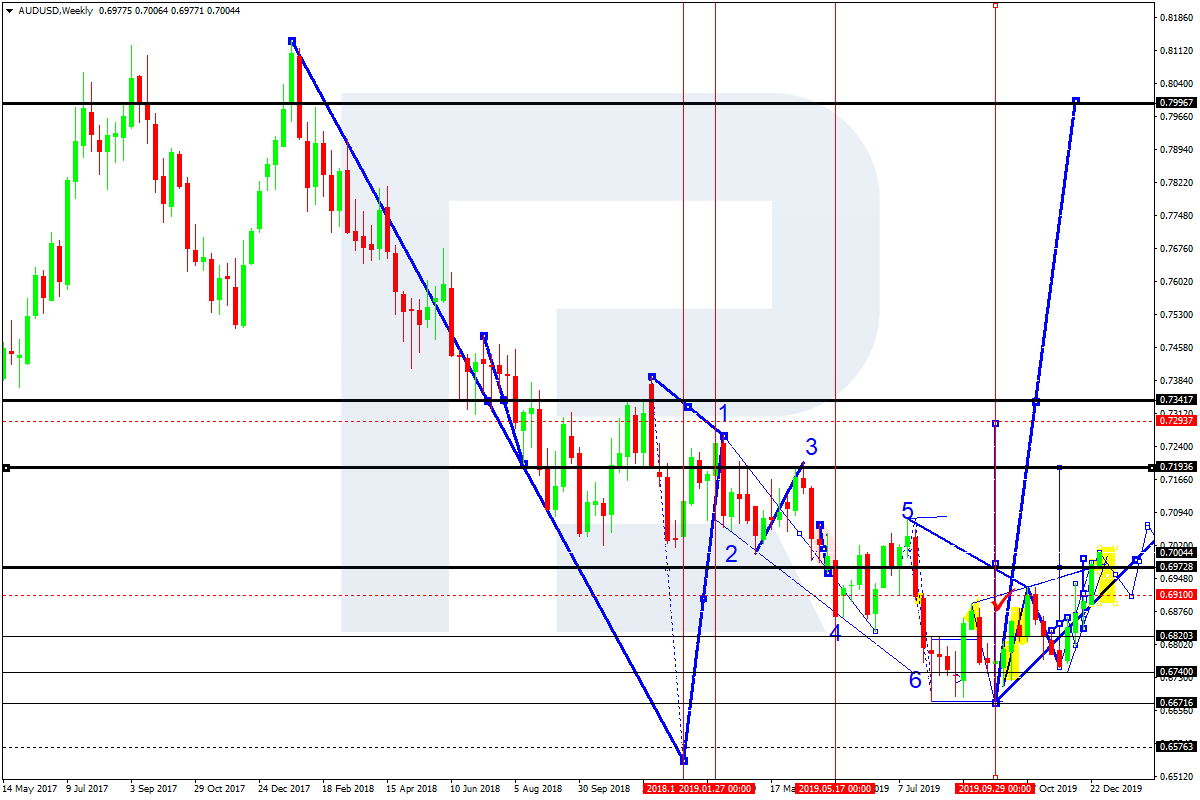
AUDUSD is still consolidating above 0.6850 without any particular direction. Possibly, the pair may form one more ascending structure towards 0.6898 and then resume moving downwards to reach 0.6872. continue growing with the target at 0.6945. After that, the instrument may start another growth to break 0.6898 and then continue trading inside the uptrend with the first target at 0.6945.

AUDUSD
Risk Warning: the result of previous trading operations do not guarantee the same results in the future

USDRUB, “US Dollar vs Russian Ruble”

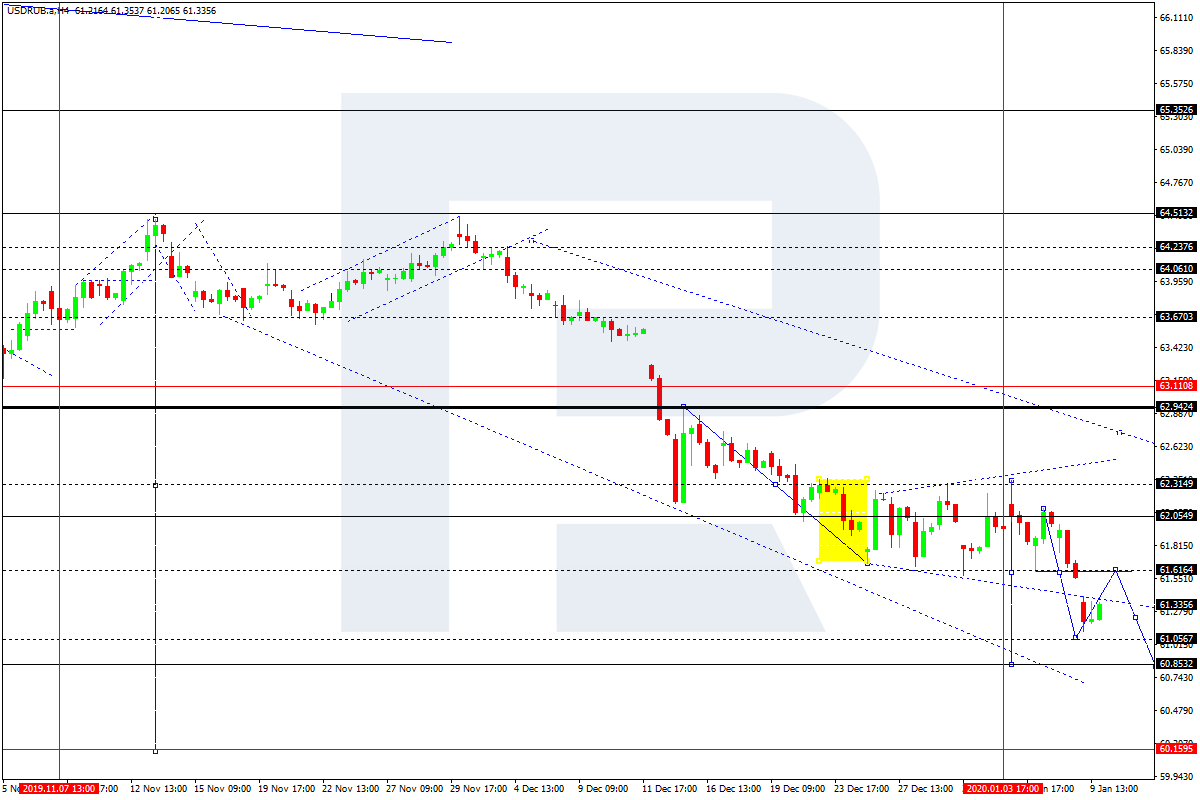
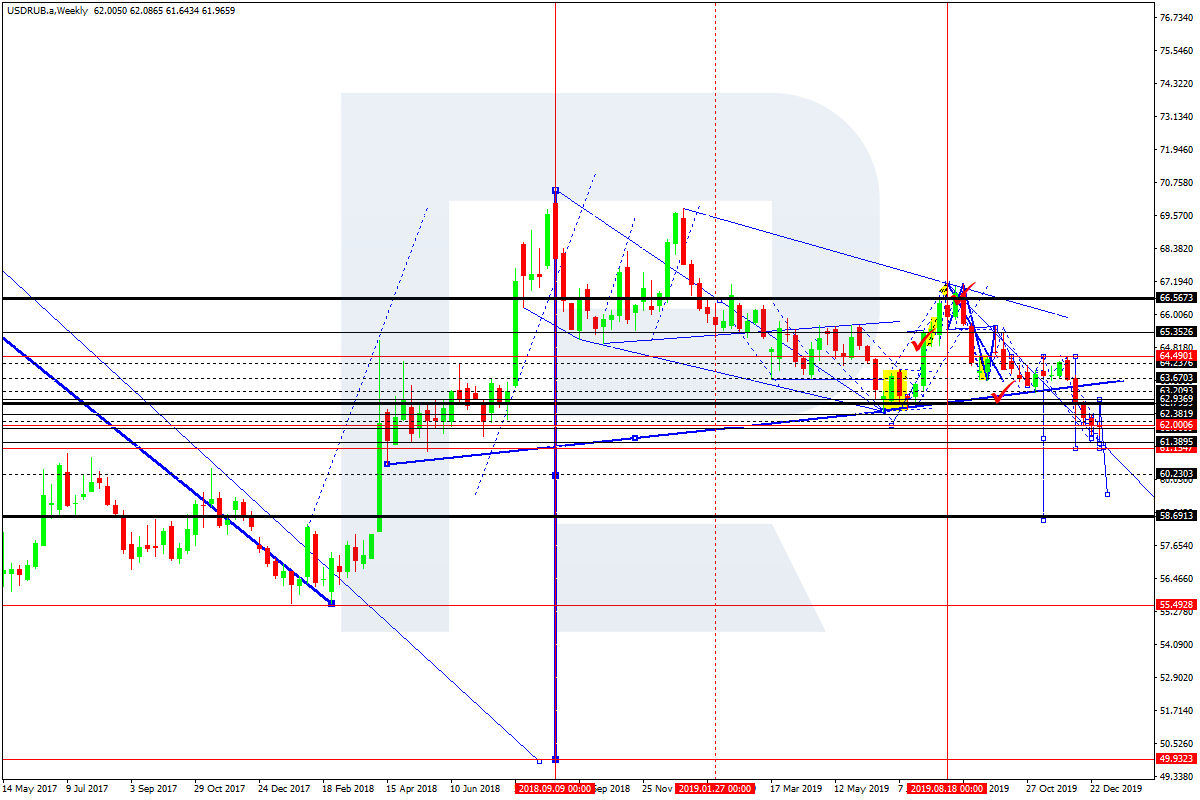
USDRUB is falling towards 61.00; it has already reached the short-term target at 61.12. The main scenario implies that the price may test 61.50 from below and then resume trading inside the downtrend to reach 61.00.

USDRUB
Risk Warning: the result of previous trading operations do not guarantee the same results in the future

USDCAD, “US Dollar vs Canadian Dollar”

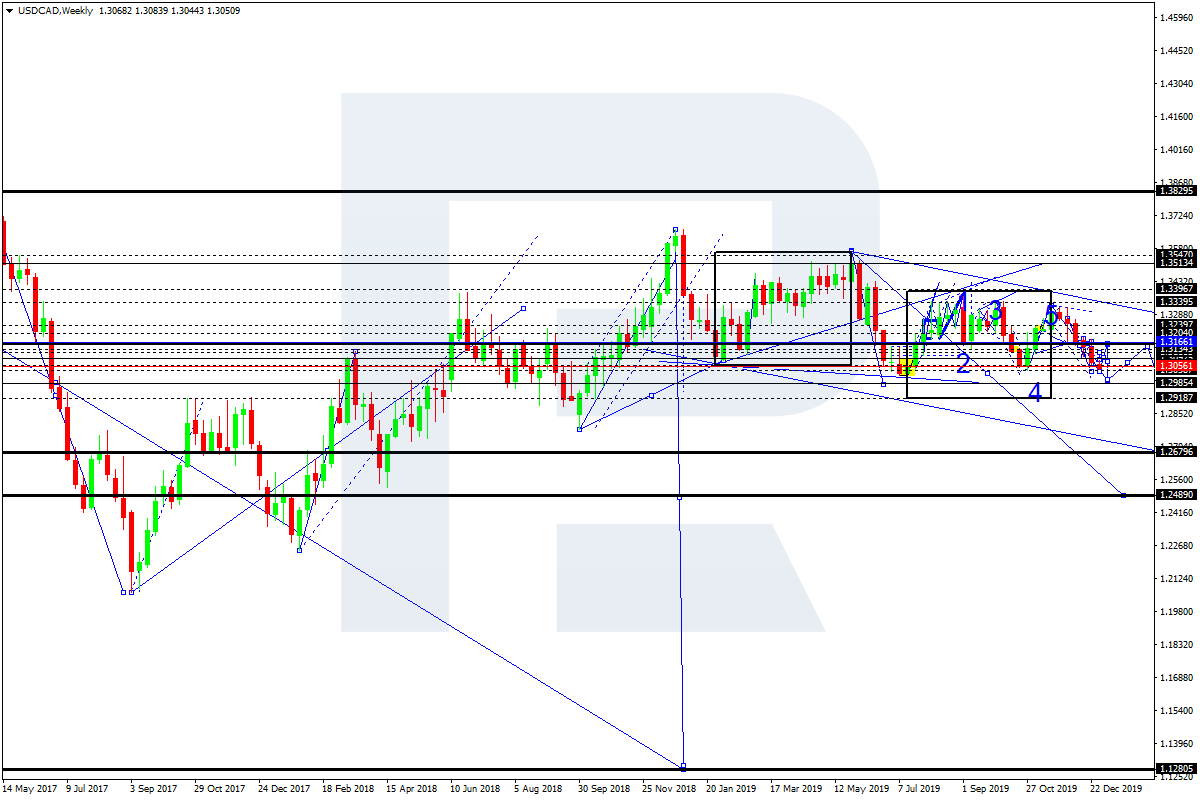
USDCAD continues growing towards 1.3131. Later, the market may start another decline to reach 1.3040 and then form one more ascending structure with the target at 1.3150.

USDCAD
Risk Warning: the result of previous trading operations do not guarantee the same results in the future

XAUUSD, “Gold vs US Dollar”

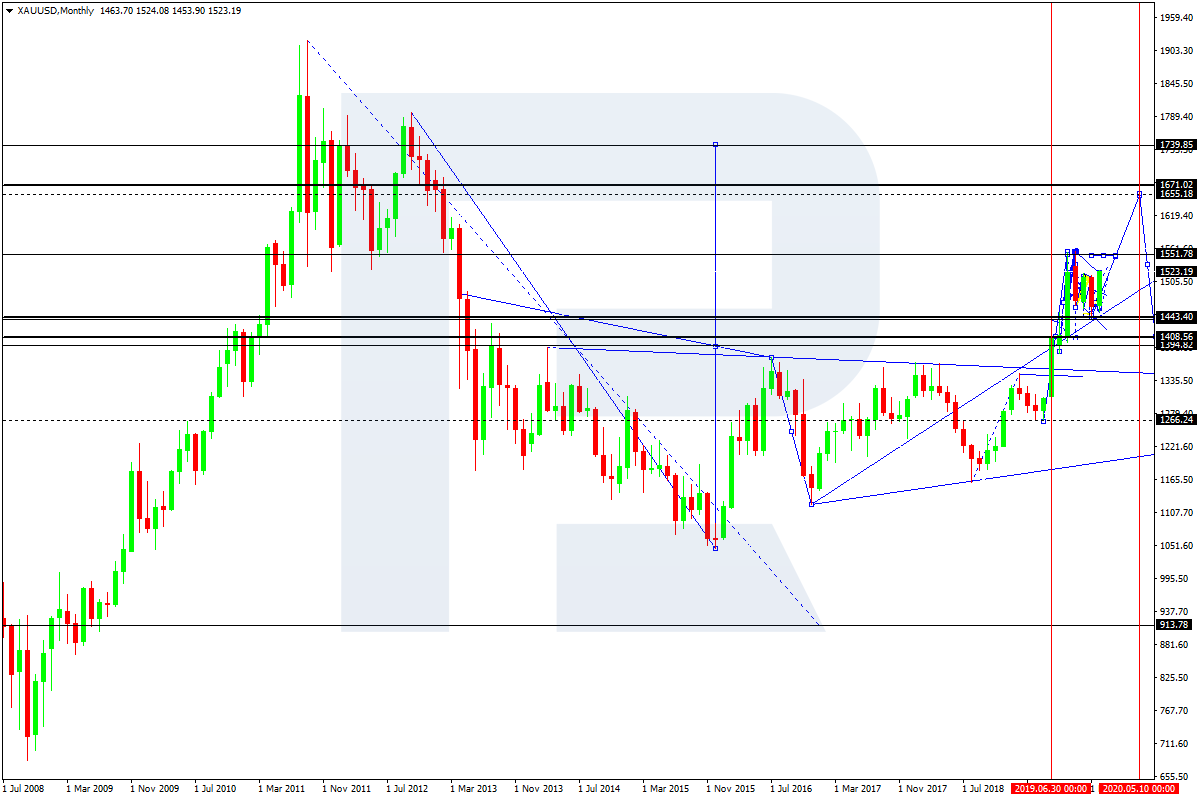
Gold continues moving downwards. After expanding the consolidation range down to 1540.00 and forming the ascending impulse towards 1556.40 along with the correction at 1547.30, Gold has defined the borders of a new consolidation range. If later the price breaks this range to the upside at 1558.00, the market may resume moving upwards to reach 1568.20; if to the downside at 1540.00 – start a new decline with the target at 1516.00.

GOLD
Risk Warning: the result of previous trading operations do not guarantee the same results in the future

BRENT

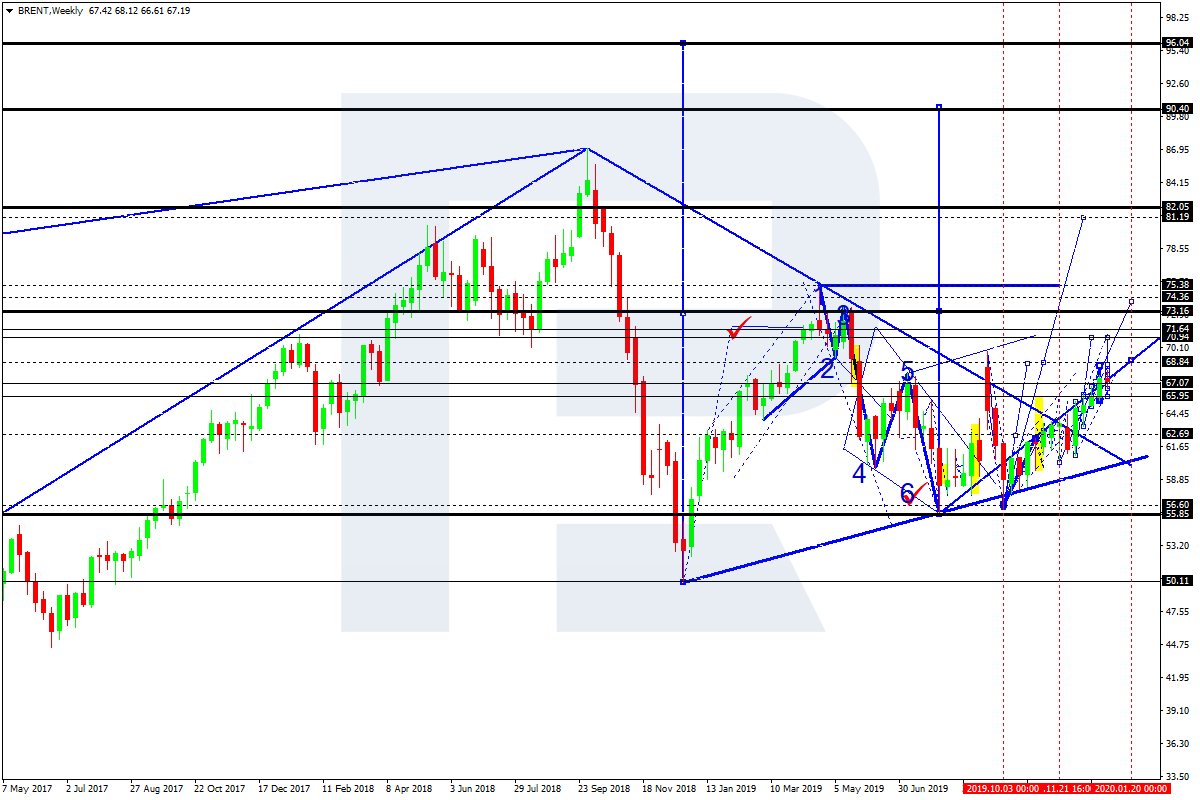
Brent is consolidating around 65.95 and may resume growing. If later the price breaks this range to the upside at 66.60, the market may resume moving upwards with the first target at 68.55; if to the downside at 64.90 – extend the correction and form a new descending structure to reach 63.30.

BRENT
Risk Warning: the result of previous trading operations do not guarantee the same results in the future

BTCUSD, “Bitcoin vs US Dollar”

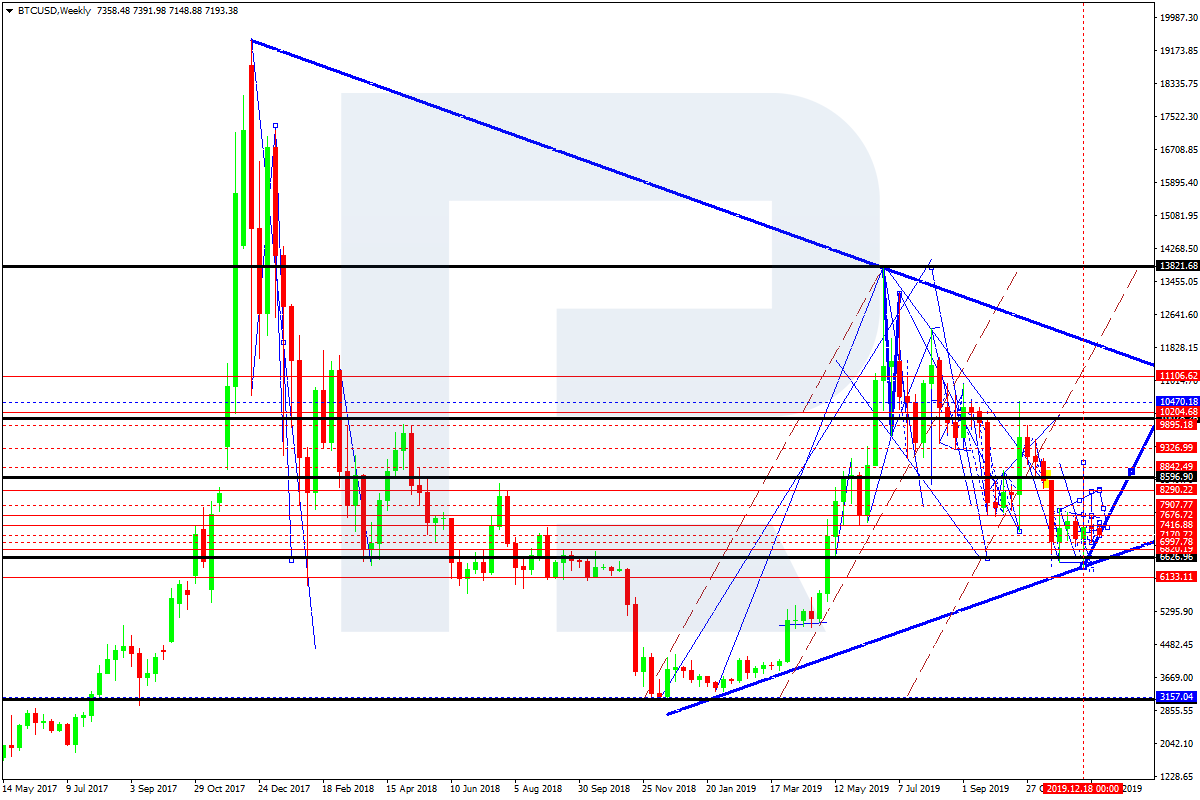
BTCUSD has reached its short-term downside target at 7750.00. Possibly, today the pair may start a new growth to reach 8050.00 and then resume falling towards 7700.00 to finish the correction. Later, the market may form one more ascending structure with the target at 8600.00.

BITCOIN
Risk Warning: the result of previous trading operations do not guarantee the same results in the future

The Euro remains under pressure. Overview for 10.01.2020

The Euro remains under pressure. Overview for 10.01.2020

10.01.2020

On Friday, the major currency pair continues trading “in the red”, but bears aren’t as active as they used to be.

EURUSD is trying to reach stability on Friday morning, but there are still more bears than bulls in the instrument. The current quote for the pair is 1.1108.

The USA is scheduled to report on its labor market this week. On Wednesday, the country published the ADP Non-Farm Employment Change, which showed 202K in December after being 124K in November and against the expected reading of 140K.

Yesterday, the USA published the weekly Unemployment Claims report, which was 214K after being 223K the week before. It’s quite good, although the readings are inside the reference values.

Later today, investors will be surely interested in the Non-Farm Employment Change, which is expected to show 266K in December after being 162K in the previous month. Another report, the Average Hourly Earnings, is anticipated to show +0.2% m/m in December after expanding by 0.3%m/m in November. Marker expectations relating to the Unemployment Rate are 3.5%.

The stronger the labor market numbers, the better for the American currency.

Fibonacci Retracements Analysis 10.01.2020 (BITCOIN, ETHEREUM)

Fibonacci Retracements Analysis 10.01.2020 (BITCOIN, ETHEREUM)

10.01.2020

BTCUSD, “Bitcoin vs US Dollar”

As we can see in the daily chart, BTCUSD has finished the correctional uptrend at the long-term resistance, which is 50.0% fibo at 8500.00. However, we shouldn’t exclude further growth towards 61.8% at 8958.00, but only after a short-term decline, because “Golden Cross” on MACD has been formed very recently. Still, the main scenario implies that the instrument is expected to start a new descending wave to reach the low at 6430.30 and then mid-term 76.0% fibo at 5700.00.

BITCOIN
Risk Warning: the result of previous trading operations do not guarantee the same results in the future

In the H4 chart, the pair is correcting towards the local support, which is 23.6% fibo at 7395.00. If the price rebounds, it may start a new impulse to reach 61.8% fibo at 8958.00. Later, BTCUSD may break this level and fix below it. In this case, the instrument may continue falling to attack the low.

BTCUSD_H4
Risk Warning: the result of previous trading operations do not guarantee the same results in the future

ETHUSD, “Ethereum vs. US Dollar”

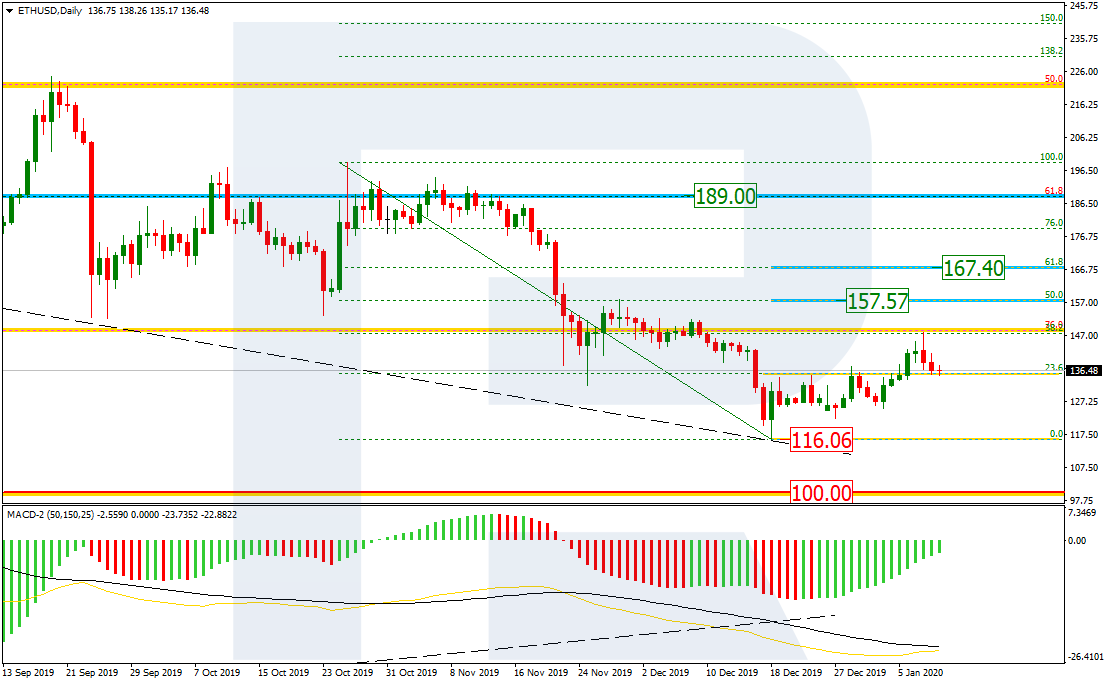
As we can see in the daily chart, the correctional uptrend has stopped at 38.2% fibo. According to the main scenario, the price is expected to fall and reach the low at 116.06, but the next rising wave may head towards 50.0% and 61.8% fibo at 157.57 and 167.40 respectively.

ETHEREUM
Risk Warning: the result of previous trading operations do not guarantee the same results in the future

The H4 chart shows that after reaching 38.2% fibo, the price has started a new decline. MACD indicates further growth after a short-term decline.

ETHUSD
Risk Warning: the result of previous trading operations do not guarantee the same results in the future

Ichimoku Cloud Analysis 08.01.2020 (AUDUSD, NZDUSD, USDCAD)

Ichimoku Cloud Analysis 08.01.2020 (AUDUSD, NZDUSD, USDCAD)

08.01.2020

AUDUSD, “Australian Dollar vs US Dollar”

AUDUSD is trading at 0.6869; the instrument is moving below Ichimoku Cloud, thus indicating a descending tendency. The markets could indicate that the price may test Tenkan-Sen and Kijun-Sen at 0.6905 and then resume moving downwards to reach 0.6765. Another signal to confirm further descending movement is the price’s rebounding from the resistance level. However, the scenario that implies further decline may be canceled if the price breaks the cloud’s upside border and fixes above 0.6980. In this case, the pair may continue growing towards 0.7065.

AUDUSD
Risk Warning: the result of previous trading operations do not guarantee the same results in the future

NZDUSD, “New Zealand Dollar vs US Dollar”

NZDUSD is trading at 0.6643; the instrument is moving below Ichimoku Cloud, thus indicating a descending tendency. The markets could indicate that the price may test the cloud’s downside border at 0.6660 and then resume moving downwards to reach 0.6455. Another signal to confirm further descending movement is the price’s rebounding from the rising channel’s downside border. However, the scenario that implies further decline may be canceled if the price breaks the cloud’s upside border and fixes above 0.6735. In this case, the pair may continue growing towards 0.6855.

NZDUSD
Risk Warning: the result of previous trading operations do not guarantee the same results in the future

USDCAD, “US Dollar vs Canadian Dollar”

USDCAD is trading at 1.2980; the instrument is moving below Ichimoku Cloud, thus indicating a descending tendency. The markets could indicate that the price may test the cloud’s downside border at 1.2990 and then resume moving downwards to reach 1.2805. Another signal to confirm further descending movement is the price’s rebounding from the descending channel’s upside border. However, the scenario that implies further decline may be canceled if the price breaks the cloud’s upside border and fixes above 1.3105. In this case, the pair may continue growing towards 1.3185.

USDCAD
Risk Warning: the result of previous trading operations do not guarantee the same results in the future

Japanese Candlesticks Analysis 08.01.2020 (GOLD, NZDUSD)

Japanese Candlesticks Analysis 08.01.2020 (GOLD, NZDUSD)

08.01.2020

XAUUSD, “Gold vs US Dollar”

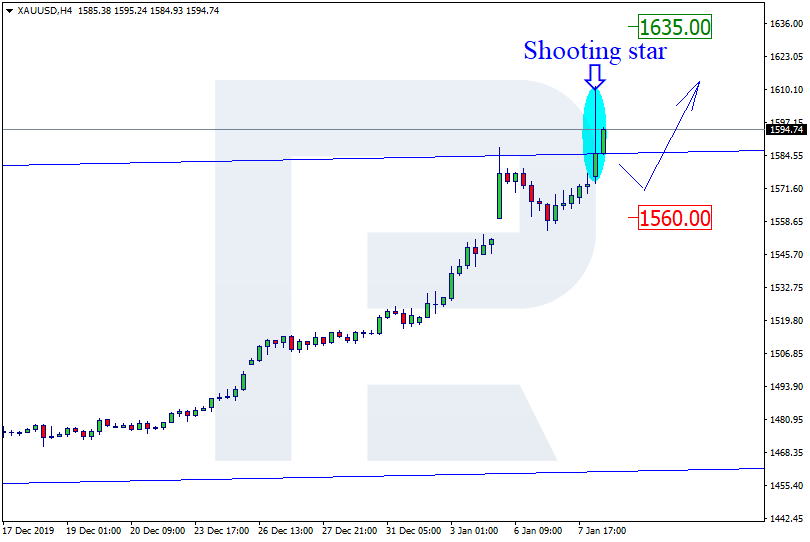
As we can see in the H4 chart, the ascending tendency continues. After breaking the rising channel’s upside border, XAUUSD has formed Shooting Star reversal pattern. Right now, the pair may start a new correction; the downside target may be at 1560.00. At the same time, we shouldn’t exclude an opposite scenario, which implies that the instrument may continue trading upwards to reach 1635.00.

GOLD
Risk Warning: the result of previous trading operations do not guarantee the same results in the future

NZDUSD, “New Zealand vs. US Dollar”

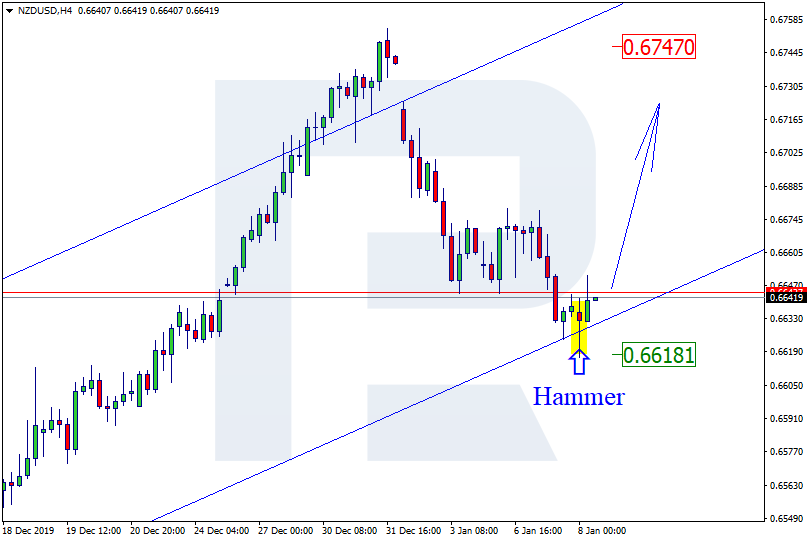
As we can see in the H4 chart, the ascending tendency continues. After forming Hammer pattern near the channel’s downside border, NZDUSD is still trading inside this range. In case the price reverses, the upside target may be the closest resistance level at 0.6747. At the same time, one shouldn’t exclude an opposite scenario, according to which the instrument may fall towards 0.6721.

NZDUSD

The Yen is correcting. Overview for 08.01.2020

The Yen is correcting. Overview for 08.01.2020

08.01.2020

On Wednesday afternoon, the Japanese Yen is correcting against the USD after a pretty volatile beginning of the month. The current quote for the instrument is 108.42.

Today’s numbers showed that the Consumer Confidence Index in Japan increased up to 39.1 points in December after being 38.7 points in the previous month. However, the indicator turned out to be worse than expected, 39.6 points, which is not good.

The Yen was in a great demand ahead of news of escalation in the US-Iranian conflict after the Iranian major general Qasem Soleimani was killed in a targeted U.S. drone strike. Still, the conflict it didn’t have any continuations and the current demand for “safe haven” assets, including the Yen, is going down. However, it is important to remember that the current situation is as “fragile” as before: even theoretical scenario of what may happen are very frightening, which means that the Japanese currency may yet get pretty much stronger against the USD.

Significant strengthening of the Yen may do some harm to the Japanese economy and make the Bank of Japan revise its monetary policy sooner than it is expected.

Forex Technical Analysis & Forecast 31.12.2019 (EURUSD, GBPUSD, USDCHF, USDJPY, AUDUSD, USDRUB, USDCAD, GOLD, BRENT, BTCUSD)

Forex Technical Analysis & Forecast 31.12.2019 (EURUSD, GBPUSD, USDCHF, USDJPY, AUDUSD, USDRUB, USDCAD, GOLD, BRENT, BTCUSD)

31.12.2019

EURUSD, “Euro vs US Dollar”

EURUSD is forming the first ascending wave towards 1.1550. After that, the instrument may start a new correction to reach 1.1200 and then form one more ascending structure with the target at 1.1900. Later, the market may start another correction to return to 1.1550 and resume moving upwards to reach 1.2900. This level is considered as the key target for the entire year of 2020.

EURUSD
Risk Warning: the result of previous trading operations do not guarantee the same results in the future

GBPUSD, “Great Britain Pound vs US Dollar”

GBPUSD is forming the fifth ascending wave with the target at 1.3690. Possibly, the pair may reach this level and then start a new correction towards 1.2850. Later, the market may form the third wave to reach 1.4000 and then start another correction towards 1.3700. After that, the instrument may form one more ascending structure with the target at 1.4850. This level is considered as the key target for the entire year of 2020.

GBPUSD
Risk Warning: the result of previous trading operations do not guarantee the same results in the future

USDCHF, “US Dollar vs Swiss Franc”

After breaking 0.9850 to the downside, USDCHF may continue the correction towards 0.9660. After that, the instrument may reverse and correct to reach 0.9850, thus forming a wide consolidation range. If later the price breaks this range to the downside, the market may continue trading inside the downtrend towards 0.9450. This level is considered as the key target for the entire year of 2020.

USDCHF
Risk Warning: the result of previous trading operations do not guarantee the same results in the future

USDJPY, “US Dollar vs Japanese Yen”

USDJPY has broken 109.14 to the downside. Possibly, the pair may start the fifth descending wave towards 103.00. This level is considered as the key target for the entire year of 2020. However, the first downside target is at 107.90.

USDJPY
Risk Warning: the result of previous trading operations do not guarantee the same results in the future

AUDUSD, “Australian Dollar vs US Dollar”

AUDUSD is trading to break 0.6970 upwards. Possibly, the pair may consolidate around this level and even start a new correction towards 0.6900. If later the price breaks this range to the upside, the market may form the third ascending wave to reach 0.7200 and then start another correction towards 0.7000. After that, the instrument may form one more ascending structure with the target at 0.7300. This level is considered as the key target for the entire year of 2020.

AUDUSD
Risk Warning: the result of previous trading operations do not guarantee the same results in the future

USDRUB, “US Dollar vs Russian Ruble”

USDRUB has broken 63.00 and may continue trading inside the downtrend towards 55.00. This level is considered as the key target for the entire year of 2020.

USDRUB
Risk Warning: the result of previous trading operations do not guarantee the same results in the future

USDCAD, “US Dollar vs Canadian Dollar”

USDCAD is still moving downwards to reach 1.2960. Later, the market may start another correction towards 1.3200 and then form a new descending structure to reach 1.2680. This level is considered as the key target for the entire year of 2020.

USDCAD
Risk Warning: the result of previous trading operations do not guarantee the same results in the future

XAUUSD, “Gold vs US Dollar”

Gold continues moving upwards; it has almost rebounded from 1447.00 to the upside. Possibly, the pair may continue trading inside the uptrend with the short-term target of the third ascending wave at 1660.00. After that, the instrument may start a new correction to reach 1550.00 or even 1400.00. Later, the market may resume moving upwards with the target at 1685.00. This level is considered as the key target for the entire year of 2020.

GOLD
Risk Warning: the result of previous trading operations do not guarantee the same results in the future

BRENT

Brent continues forming the third ascending wave. Possibly, the pair may break 68.80 and form an upside continuation pattern. The short-term upside target is at 82.00. This level is considered as the key target for the entire year of 2020.

BRENT
Risk Warning: the result of previous trading operations do not guarantee the same results in the future

BTCUSD, “Bitcoin vs US Dollar”

After finishing the ascending pulse at 7600.00, BTCUSD has completed the correction at 7000.00, thus forming a new consolidation range. If later the price breaks this range to the downside at 7000.00, the market may continue trading inside the downtrend towards 4200.00; if to the upside at 7600.00 – start a new growth with the target at 8600.00 and then 11100.00.

BITCOIN

USDJPY is keeping balance. Overview for 27.12.2019

USDJPY is keeping balance. Overview for 27.12.2019

27.12.2019

At the end of the week, USDJPY reached stability after plunging the day before.

The Japanese Yen recovered a little bit after yesterday’s decline against the USD. The current quote for the instrument is 109.50.

Investors that had a couple of days off due to Christmas are back to the market and their interest in the USD as a “safe haven” asset went down.

Today’s reports from Japan were pretty interesting. The Unemployment Rate went from 2.4% in October to 2.2% in November, although it wasn’t expected to change. It looks like the Japanese population sees slowdown in the national economy and vague outside market conditions, and tries to find new sources of income.

The Retail Sales lost 2.1% y/yin November after decreasing by 7.0% y/y the month before and against the expected reading of -1.7% y/y, but it is not surprising: people prefer to save money due to the same dim economic outlook.

The preliminary report on the Industrial Production showed -0.9% m/m in November after being -4.5% m/m in the previous month. The indicator has been falling for two consecutive months, which may indicate a slowdown in the country’s GDP in the fourth quarter. However, the reason for this decline is quite clear: both Export and Consumer Spending went down. Taken together, they have a significant negative influence on the country’s economy.

Such mixed statistics may well be a reason for implementing additional QE mechanisms by the Bank of Japan.

Fibonacci Retracements Analysis 27.12.2019 (BITCOIN, ETHEREUM)

Fibonacci Retracements Analysis 27.12.2019 (BITCOIN, ETHEREUM)

27.12.2019

BTCUSD, “Bitcoin vs US Dollar”

As we can see in the H4 chart, the convergence made the pair reverse and start a new rising correction, which has already reached 23.6% fibo and may yet continue towards 38.2% and 50.05% fibo at 7995.00 and 8480.00 respectively. However, if the price breaks the local low at 6430.30, BTCUSD may continue falling to reach mid-term 76.0% fibo at 5700.00. The key mid-term downside target is still the low at 3121.90.

BTCUSD_H4
Risk Warning: the result of previous trading operations do not guarantee the same results in the future

In the H1 chart, the pair is correcting after the divergence on MACD. The price has already reached 38.2% fibo; right now, it is trading close to this level. The next descending impulse may fall to reach 50.0% and 61.8% fibo at 7059.00 and 6910.00 respectively. The resistance is the high at 7687.30.

BTCUSD_H1
Risk Warning: the result of previous trading operations do not guarantee the same results in the future

ETHUSD, “Ethereum vs. US Dollar”

As we can see in the daily chart, the downtrend continues to reach a psychologically-crucial level of 100.00. At the same time, there is a convergence on MACD, which may indicate a new pullback towards the resistance (61.8% fibo at 189.00).

ETHUSD_D1
Risk Warning: the result of previous trading operations do not guarantee the same results in the future

The H4 chart shows a short-term growth towards 23.6% fibo at 135.68 after the convergence. In case it breaks this level, the current rising movement may continue to reach 38.2% and 50.0% fibo at 147.70 and 157.57 respectively. However, if the pair breaks the low, it may test the support at 100.00.

ETHEREUM_H4
Risk Warning: the result of previous trading operations do not guarantee the same results in the future