rfxsignals December 4, 2023 No Comments

Identifying the Best Forex Strategy for You

Identifying the Best Forex Strategy for You
When it comes to clarifying what the best strategy for trading Forex is, there really is no single answer. The best strategy for trading Forex needs to be suited to the individual. This means you need to consider your personality and work out the best Forex trading system to suit you. What may work well for someone else may not work for you.

best_forex_trading_strategies

best_forex_trading_strategies

Conversely, a strategy that has been discounted by others may turn out to be right for you. Therefore, experimentation may be required to discover the Forex trading strategies that work. It can also remove those that don’t work for you. One of the key aspects to consider is a time frame for your trading style.

There are several types of Forex trading strategy styles from short timeframes to long timeframes. These styles have been widely used over the years and still remain a popular choice from the list of the best Forex trading strategies this year. The best Forex traders always remain aware of the different styles and strategies in their search for how to trade Forex successfully.

Short term timeframes include 60-minute, 30-minute, 15-minute, 5-minute and 1-minute charts.
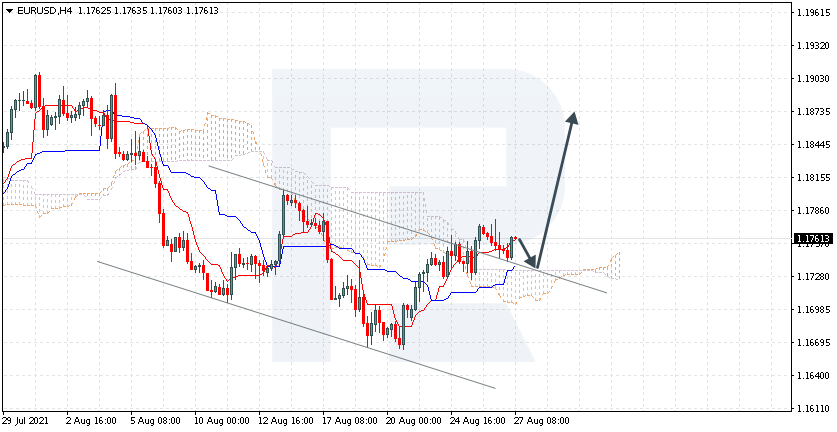
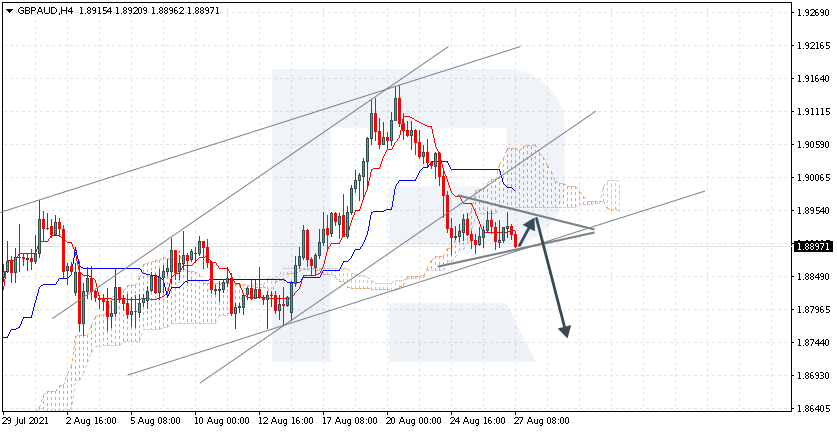
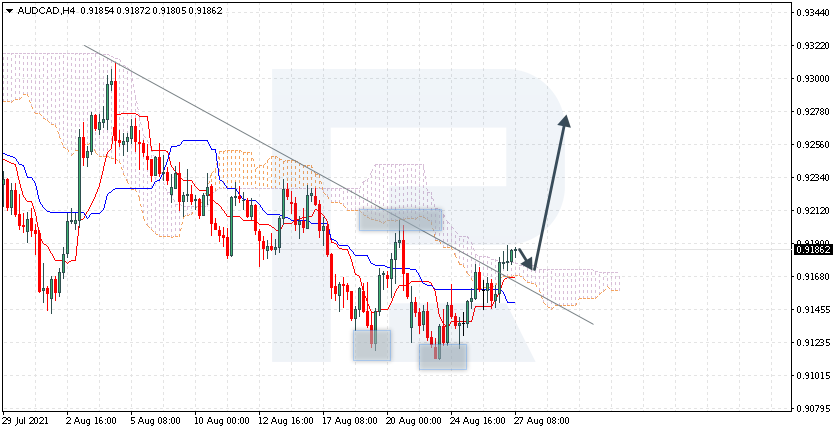
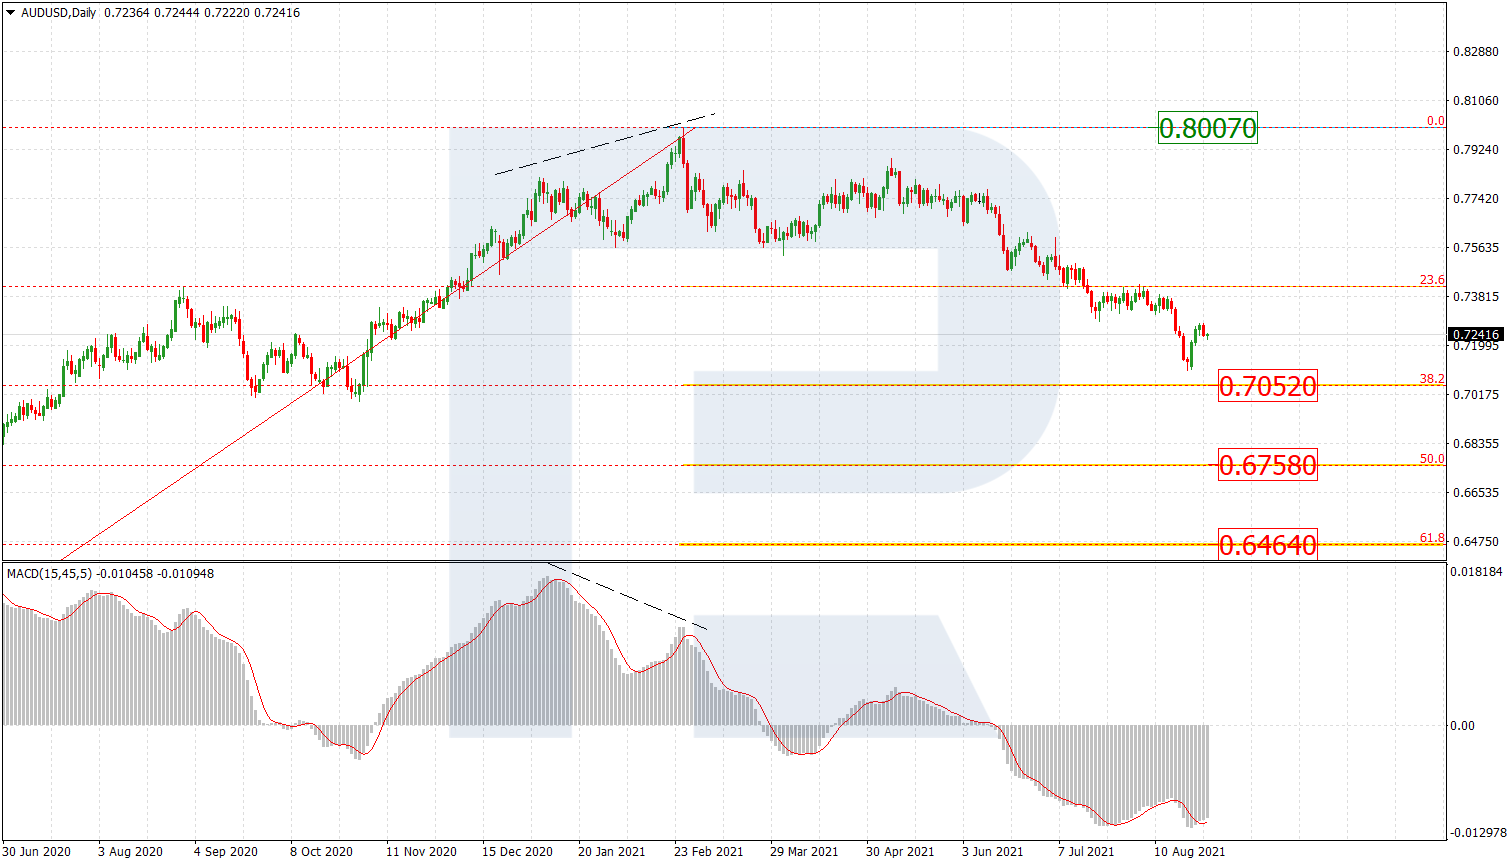
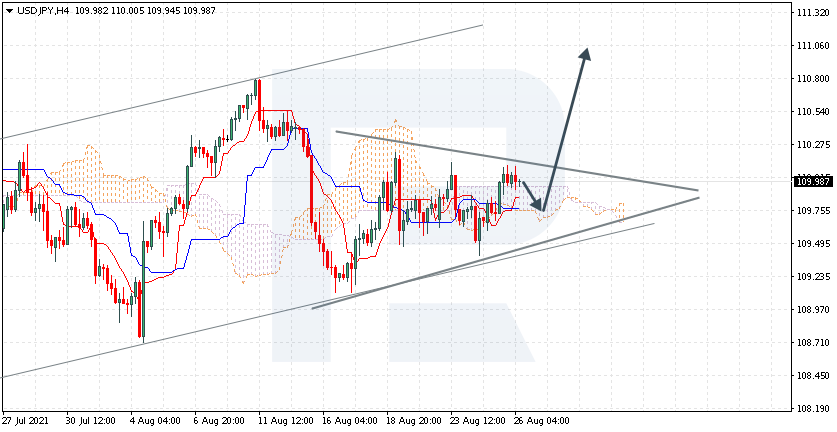
Longer term timeframes include 4-hour, Daily, Weekly and Monthly charts.
A lot of the time when people talk about Forex trading strategies, they are talking about a specific trading method that is usually just one facet of a complete trading plan. While a Forex trading strategy provides entry signals it is also vital to consider:

Position sizing
Risk management
How to exit a trade
Different Types of Forex Trading Strategies
1. Scalping – These are very short-lived trades, possibly held just for just a few minutes. A scalper seeks to quickly beat the bid/offer spread, and skim just a few pips of profit before exiting and is considered one of the most advanced Forex trading strategies out there. This strategy typically uses low time-frame charts, such as the ones that can be found in the MetaTrader 4 Supreme Edition package. This trading platform also offers some of the best Forex indicators for scalping. The Forex-1 minute Trading Strategy can be considered an example of this trading style.

2. Day trading – These are trades that are exited before the end of the day. This removes the chance of being adversely affected by large moves overnight. Day trading strategies are common among Forex trading strategies for beginners. Trades may last only a few hours, and price bars on charts might typically be set to one or two hours.

3. Swing trading – Positions held for several days, whereby traders are aiming to profit from short-term price patterns. A swing trader might typically look at bars every half an hour or hour.

4. Positional trading – Long-term trend following, seeking to maximise profit from major shifts in price. A long-term trader would typically look at the end of day charts. The best positional trading strategies require immense patience and discipline on the part of traders. It requires a good amount of knowledge regarding market fundamentals.

Below is a list of trading strategies regarded to be some of the top Forex trading strategies around and how you can trade them, so you can try and find the right one for you.

Did you know that you can learn to trade step-by-step with our brand new educational course, Forex 101, featuring key insights from professional industry experts? Click the banner below to register for free.

rfxsignals May 12, 2023 No Comments

Daily Free Forex Signals For 12-05-2023

Daily Free Forex Signals For 12-05-2023

EURUSD BUY -1.09302
SL-1.08597
TP1-1.09707
TP2-1.10106

AUDUSD BUY-0.67008
SL-0.66659
TP1-0.67680
TP2-0.68115

GBPUSD BUY -1.25256
SL-1.24268
TP1-1.25791
TP2-1.26357

USDCAD SELL-1.34852
SL-1.35599
TP1-1.34431
TP2-1.33908

rfxsignals October 19, 2021 No Comments

Daily Free Forex Signals For 19-10-2021

Here your going to see Daily Free Forex Signals For 19-10-2021 to free forex signal alert from our kitkat trading system and other trading logic’s .we provide like this free forex signals from 2012 on wards with more than 50,000 traders around the world .The free forex signals have 70 to 85% quality always .we give for you a note as maximum focus take profit 1 as your target and must use stop loss values .if you have any other query’s please visit our live chat or email option


Rfxsignals.com, [19.10.21 13:24]
GBPUSD BUY -1.37903
SL-1.37229
TP1-1.38139
TP2-1.38375

Rfxsignals.com, [19.10.21 13:34]
USDCAD SELL-1.23213
SL-1.23584
TP1-1.22998
TP2-1.22672
#forex #trading #trader #priceaction #forextrading #forextraders #forextrader #forexanalysis #tradinganalysis

Rfxsignals.com, [19.10.21 13:37]
USDJPY SELL-113.909
SL-114.331
TP1-113.719
TP2-113.517
#forex #trading #trader #priceaction #forextrading #forextraders #forextrader #forexanalysis #tradinganalysis

Rfxsignals.com, [19.10.21 13:39]
EURAUD SELL-1.55998
SL-1.56580
TP1-1.55762
TP2-1.55537
#forex #trading #trader #priceaction #forextrading #forextraders #forextrader #forexanalysis #tradinganalysis

Rfxsignals.com, [19.10.21 13:40]
GBPCAD SELL-1.69772
SL-1.70175
TP1-1.69599
TP2-1.69398
#forex #trading #trader #priceaction #forextrading #forextraders #forextrader #forexanalysis #tradinganalysis

Rfxsignals.com, [19.10.21 13:44]
GBPCHF BUY-1.26935
SL-1.26514
TP1-1.27131
TP2-1.27342
#forex #trading #trader #priceaction #forextrading #forextraders #forextrader #forexanalysis #tradinganalysis

Rfxsignals.com, [19.10.21 13:45]
NZDUSD BUY-0.71447
SL-0.71031
TP1-0.71664
TP2-0.71897
#forex #trading #trader #priceaction #forextrading #forextraders #forextrader #forexanalysis #tradinganalysis

Rfxsignals.com, [19.10.21 17:57]
EURCAD BUY-1.43925
SL-1.43399
TP1-1.44186
TP2-1.44451
#forex #trading #trader #priceaction #forextrading #forextraders #forextrader #forexanalysis #tradinganalysis

Rfxsignals.com, [19.10.21 18:03]
gbpcad buy -1.70868
SL-1.70058
TP1-1.71156
TP2-1.71405
#forex #trading #trader #priceaction #forextrading #forextraders #forextrader #forexanalysis #tradinganalysis

Rfxsignals.com, [19.10.21 18:04]
EURGBP SELL-0.84207
SL-0.84687
TP1-0.83947
TP2-0.83730
#forex #trading #trader #priceaction #forextrading #forextraders #forextrader #forexanalysis #tradinganalysis

Rfxsignals.com, [19.10.21 18:09]
EURUSD SELL-1.16447
SL-1.17040
TP1-1.16177
TP2-1.15905
#forex #trading #trader #priceaction #forextrading #forextraders #forextrader #forexanalysis #tradinganalysis

Japanese Candlesticks Analysis 27.08.2021 (USDCAD, AUDUSD, USDCHF)

USDCAD, “US Dollar vs Canadian Dollar”

As we can see in the H4 chart, the asset is correcting. After forming a Harami pattern close to the resistance level, USDCAD may reverse and form a new pullback towards the channel’s downside border. In this case, the correctional target may be the support area at 1.2610. However, an alternative scenario implies that the asset may continue growing to reach 1.2790 without testing the support area.

USDCAD
Risk Warning: the result of previous trading operations do not guarantee the same results in the future

AUDUSD, “Australian Dollar vs US Dollar”

As we can see in the H4 chart, while testing the channel’s upside border, AUDUSD has formed several reversal patterns, such as Harami. At the moment, the asset is reversing. In this case, the downside target may be at 0.7155. At the same time, an opposite scenario implies that the price may return to the resistance area at 0.7275 first and then resume trading downwards.

AUDUSD
Risk Warning: the result of previous trading operations do not guarantee the same results in the future

USDCHF, “US Dollar vs Swiss Franc”

As we can see in the H4 chart, the asset is finishing another correction. By now, the pair has formed several reversal patterns, for example, Hammer and Harami, close to the channel’s downside border. At the moment, USDCHF is reversing and may later grow towards the resistance level. In this case, the upside target may be at 0.9220. Still, there might be an alternative scenario, according to which the asset may correct towards 0.9130 first and then resume trading upwards.

USDCHF
Risk Warning: the result of previous trading operations do not guarantee the same results in the future

Forex Technical Analysis & Forecast 27.08.2021

EURUSD, “Euro vs US Dollar”

After rebounding from 1.1777 and finishing the first descending impulse at 1.1741, EURUSD is correcting to the upside to reach 1.1763, thus forming a new consolidation range around 1.1754. If later the price breaks this range to the downside, the market may resume trading downwards with the target at 1.1720; if to the upside – form one more ascending structure towards 1.1788 and then start a new decline to reach the above-mentioned target.

EURUSD
Risk Warning: the result of previous trading operations do not guarantee the same results in the future

GBPUSD, “Great Britain Pound vs US Dollar”

After rebounding from 1.3767 and completing the descending impulse at 1.3680, GBPUSD is forming a new consolidation range around 1.3690. If later the price breaks this range to the downside, the market may fall to reach 1.3650; if to the upside – correct to test 1.3727 from below and then resume trading within the downtrend with the target at 1.3600.

GBPUSD
Risk Warning: the result of previous trading operations do not guarantee the same results in the future

USDRUB, “US Dollar vs Russian Ruble”

USDRUB has finished another ascending structure at 74.45; right now, it is consolidating below this level. Possibly, today the pair may break this range to the downside and resume trading downwards to break 73.80. After that, the instrument may continue falling with the target at 72.88.

USDRUB
Risk Warning: the result of previous trading operations do not guarantee the same results in the future

USDJPY, “US Dollar vs Japanese Yen”

After rebounding from 110.20, USDJPY is trading downwards to reach 109.50. Possibly, the pair may break the latter level and then continue moving within the downtrend with the short-term target at 108.96.

USDJPY
Risk Warning: the result of previous trading operations do not guarantee the same results in the future

USDCHF, “US Dollar vs Swiss Franc”

USDCHF has finished the ascending structure at 0.9166; right now, it is consolidating around this level. Today, the pair may fall towards 0.9161 and then resume growing to break 0.9191. After that, the instrument may continue trading upwards with the short-term target at 0.9222.

USDCHF
Risk Warning: the result of previous trading operations do not guarantee the same results in the future

AUDUSD, “Australian Dollar vs US Dollar”

After rebounding from 0.7277, AUDUSD continues falling towards 0.7207. Later, the market may grow to reach 0.7234 and then resume trading within the downtrend with the target at 0.7070.

AUDUSD
Risk Warning: the result of previous trading operations do not guarantee the same results in the future

BRENT

After rebounding from 72.00 and finishing the correctional structure at 70.25, Brent is growing towards 72.22 and may later start a new correction to return to 70.25. If the price breaks the latter level to the downside, the market may resume trading downwards to reach 68.60 and then form one more ascending structure with the target at 75.00. On the other hand, the asset may grow to break 72.22 and then continue moving upwards to reach the above-mentioned target.

BRENT
Risk Warning: the result of previous trading operations do not guarantee the same results in the future

XAUUSD, “Gold vs US Dollar”

After completing the correction at 1780.80 and rebounding from this level, Gold is still moving upwards to reach 1812.82. Later, the market may start a new correction with the target at 1750.00.

GOLD
Risk Warning: the result of previous trading operations do not guarantee the same results in the future

S&P 500

After finishing the descending structure at 4468.2, the S&P index is moving upwards to reach 4484.0. if later the price breaks the latter level to the upside, the market may continue trading upwards to reach 4515.5. On the other hand, if the asset falls and breaks 4468.0, the instrument may form one more descending structure with the target at 4380.0.

S&P 500
Risk Warning: the result of previous trading operations do not guarantee the same results in the future

Ichimoku Cloud Analysis 27.08.2021 (EURUSD, GBPAUD, AUDCAD)

EURUSD, “Euro vs US Dollar”

EURUSD is trading at 1.1761; the instrument is moving above Ichimoku Cloud, thus indicating an ascending tendency. The markets could indicate that the price may test the cloud’s upside border at 1.1730 and then resume moving upwards to reach 1.1875. Another signal in favor of a further uptrend will be a rebound from the descending channel’s upside border. However, the bullish scenario may be cancelled if the price breaks the cloud’s downside border and fixes below 1.1675. In this case, the pair may continue falling towards 1.1585.

EURUSD
Risk Warning: the result of previous trading operations do not guarantee the same results in the future

GBPAUD, “Great Britain Pound vs Australian Dollar”

GBPAUD is trading at 1.8897; the instrument is moving below Ichimoku Cloud, thus indicating a descending tendency. The markets could indicate that the price may test Tenkan-Sen and Kijun-Sen at 1.8925 and then resume moving downwards to reach 1.8745. Another signal in favor of a further downtrend will be a rebound from the upside border of a Triangle pattern. However, the bearish scenario may no longer be valid if the price breaks the cloud’s upside border and fixes above 1.9105. In this case, the pair may continue growing towards 1.9205. To confirm further decline, the asset must break the pattern’s downside border and fix below 1.8875.

GBPAUD
Risk Warning: the result of previous trading operations do not guarantee the same results in the future

AUDCAD, “Australian Dollar vs Canadian Dollar”

AUDCAD is trading at 0.9186; the instrument is moving above Ichimoku Cloud, thus indicating an ascending tendency. The markets could indicate that the price may test the cloud’s upside border at 0.9165 and then resume moving upwards to reach 0.9275. Another signal in favor of a further uptrend will be a rebound from the descending trendline. However, the bullish scenario may no longer be valid if the price breaks the cloud’s downside border and fixes below 0.9125. In this case, the pair may continue falling towards 0.9095. To confirm further growth, the asset must break the resistance level and fix above 0.9230, thus completing the formation of a Double Bottom reversal pattern.

AUDCAD
Risk Warning: the result of previous trading operations do not guarantee the same results in the future

Fibonacci Retracements Analysis 27.08.2021 (AUDUSD, USDCAD)

AUDUSD, “Australian Dollar vs US Dollar”

In the daily chart, the downtrend is looking quite stable despite the current correction to the upside, which started after an attempt to test 38.2% at 0.7052. After the pullback is over, the asset may continue trading towards 50.0% and 61.8% fibo at 0.6758 and 0.6464 respectively. The key resistance is the high at 0.8007.

AUDUSD_DAILY
Risk Warning: the result of previous trading operations do not guarantee the same results in the future

The H4 chart of AUDUSD shows the potential upside correctional targets are convergence on MACD – 23,6%, 38.2%, and 50.0% at 0.7292, 0.7406, and 0.7498 respectively. A breakout of the local support at 0.7106 will lead to a further mid-term downtrend.

AUDUSD_H4
Risk Warning: the result of previous trading operations do not guarantee the same results in the future

USDCAD, “US Dollar vs Canadian Dollar”

As we can see in the daily chart, after an attempt to reach 38.2% fibo at 1.3022 and local divergence on MACD, the pair is correcting downwards. After finishing the pullback, the asset may form a new wave to the upside with the targets at 50.0% and 61.8% fibo at 1.3336 and 1.3650 respectively. The key support remains at the low at 1.2007.

USDCAD_D1
Risk Warning: the result of previous trading operations do not guarantee the same results in the future

The H4 chart shows the potential targets of the current descending correction. After divergence on MACD, the pair was falling and reached 38.2% but then rebounded from it. The next descending impulse may head towards 50.0%, 61.8%, and 76.0% fibo at 1.2478, 1.2366, and 1.2234 respectively. The local resistance is the fractal high at 1.2949.

USDCAD_H4
Risk Warning: the result of previous trading operations do not guarantee the same results in the future

EURUSD is hanging in the air. Overview for 27.08.2021

EURUSD remains stable in anticipation of Powell’s comments.

The major currency pair remains neutral in anticipation of the speech to be delivered by the US Fed Chairman Jerome Powell. The current quote for the instrument is 1.1760.

Yesterday, monetary policymakers shared their opinions in Jackson Hole and commented on the reduction of the regulator’s stimulus programs. The common voice is quite positive and the current economic recovery allows to decrease the QE program volume as early as the end of 2021. The key reason for this is the inflation boost and uncertainty of how the indicator might behave next year.

At the moment, the volume of the Fed’s program is $120 billion every month. Sure, this volume might have been already reduced – it is what market players are expecting since the American economy improved pretty much, which is confirmed by the macroeconomic statistics.

The second estimate of the US GDP for the second quarter of 2021 was good: the indicator showed 6.6% against the previous estimate of 6.5%. although it was expected to improve up to 6.7%. However, there will be the third estimate, which may show an even better number.

Today, apart from the comments from Jackson Hole, one should pay attention to the reports on the Personal Income/Spending from the USA. Also, there will be the revised data on the Consumer Sentiment from the University of Michigan, which is expected to improve in August.

Japanese Candlesticks Analysis 26.08.2021 (XAUUSD, NZDUSD, GBPUSD)

XAUUSD, “Gold vs US Dollar”

As we can see in the H4 chart, the correction within the uptrend continues. After forming several reversal patterns, such as Hammer, not far from the support level, XAUUSD may reverse and start a new growth to reach the resistance area at 1830.00. At the same time, an opposite scenario implies that the price may continue falling towards 1760.50 before resuming its ascending tendency.

XAUUSD
Risk Warning: the result of previous trading operations do not guarantee the same results in the future

NZDUSD, “New Zealand vs US Dollar”

As we can see in the H4 chart, after testing the resistance area, NZDUSD has formed several reversal patterns, such as Harami. At the moment, the asset may reverse in the form of a new pullback. In this case, the correctional target may be the support level at 0.6905. After testing this level, the asset may rebound from it and continue moving upwards. However, an alternative scenario implies that the price may grow to reach 0.7035 without correcting towards the support level.

NZDUSD
Risk Warning: the result of previous trading operations do not guarantee the same results in the future

GBPUSD, “Great Britain Pound vs US Dollar”

As we can see in the H4 chart, the asset is still forming another correctional wave. By now, GBPUSD has formed several reversal patterns, such as Hammer and Engulfing, not far from the support level. At the moment, the pair is reversing and starting a new growth. In this case, the upside target may be the channel’s upside border at 1.3785. After testing this level, the market may rebound from it and resume falling. Still, there might be an alternative scenario, according to which the asset may fall towards the next support area at 1.3640 without testing the resistance area.

GBPUSD
Risk Warning: the result of previous trading operations do not guarantee the same results in the future

Ichimoku Cloud Analysis 26.08.2021 (USDCHF, EURJPY, USDJPY)

USDCHF, “US Dollar vs Swiss Franc”

USDCHF is trading at 0.9146; the instrument is moving below Ichimoku Cloud, thus indicating a descending tendency. The markets could indicate that the price may test the cloud’s downside border at 0.9155 and then resume moving downwards to reach 0.9010. Another signal in favor of a further downtrend will be a rebound from the upside border of a Triangle pattern. However, the bearish scenario may no longer be valid if the price breaks the cloud’s upside border and fixes above 0.9190. In this case, the pair may continue growing towards 0.9275. To confirm further decline, the asset must break the pattern’s downside border and fix below 0.9085.

USDCHF
Risk Warning: the result of previous trading operations do not guarantee the same results in the future

EURJPY, “Euro vs Japanese Yen”

EURJPY is trading at 129.38; the instrument is moving above Ichimoku Cloud, thus indicating an ascending tendency. The markets could indicate that the price may test the cloud’s upside border at 128.95 and then resume moving upwards to reach 130.60. Another signal in favor of a further uptrend will be a rebound from the rising channel’s downside border. However, the bullish scenario may no longer be valid if the price breaks the cloud’s downside border and fixes below 128.25. In this case, the pair may continue falling towards 127.35.

EURJPY
Risk Warning: the result of previous trading operations do not guarantee the same results in the future

USDJPY, “US Dollar vs Japanese Yen”

USDJPY is trading at 109.98; the instrument is moving above Ichimoku Cloud, thus indicating an ascending tendency. The markets could indicate that the price may test the cloud’s downside border at 109.75 and then resume moving upwards to reach 111.05. Another signal in favor of a further uptrend will be a rebound from the downside border of the Triangle pattern. However, the bullish scenario may no longer be valid if the price breaks the cloud’s downside border and fixes below 109.25. In this case, the pair may continue falling towards 108.35. To confirm further growth, the asset must break the pattern’s upside border and fix above 110.30.

USDJPY
Risk Warning: the result of previous trading operations do not guarantee the same results in the future