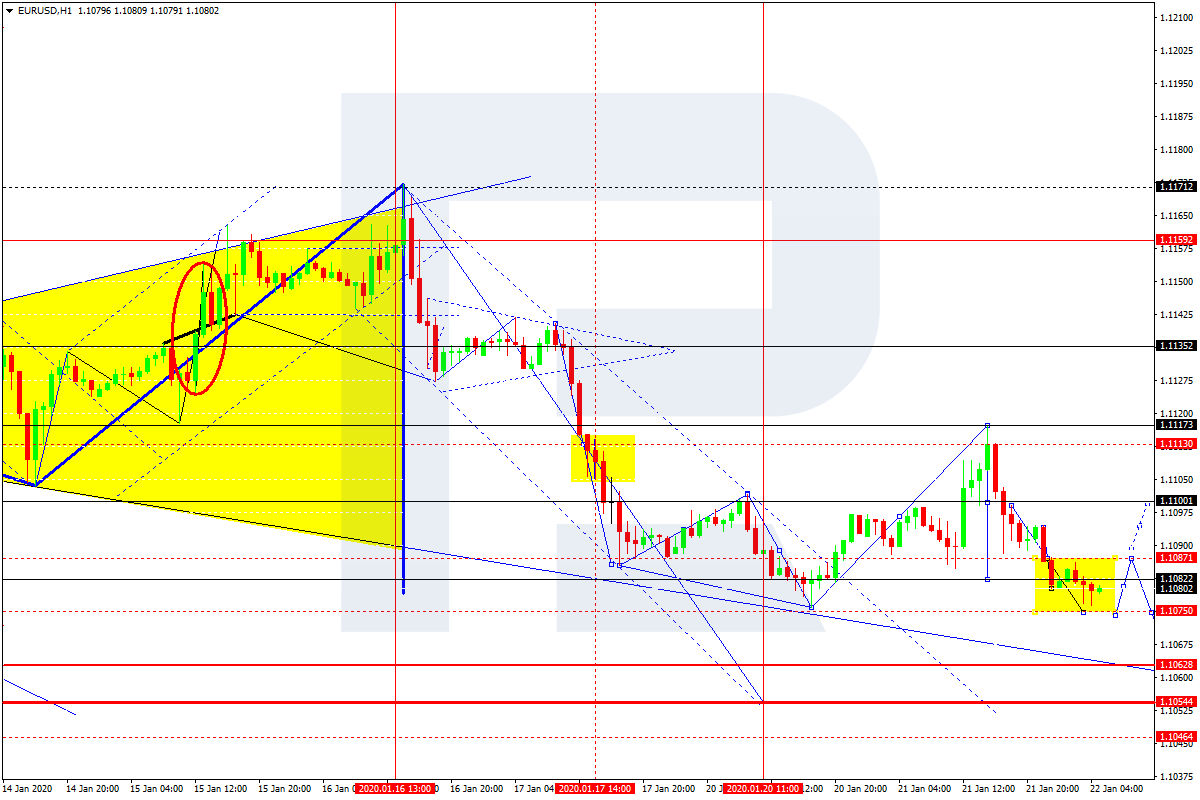
EURUSD, “Euro vs US Dollar”
EURUSD is forming the fifth descending wave; after finishing the correctional wave towards 1.1117, the price has completed another descending structure with the first target at 1.1080. At the moment, the instrument is consolidating. Possibly, the pair may fall to reach 1.1075 and then grow towards 1.1087 at least. Later, the market may start a new decline with the target at 1.1062.

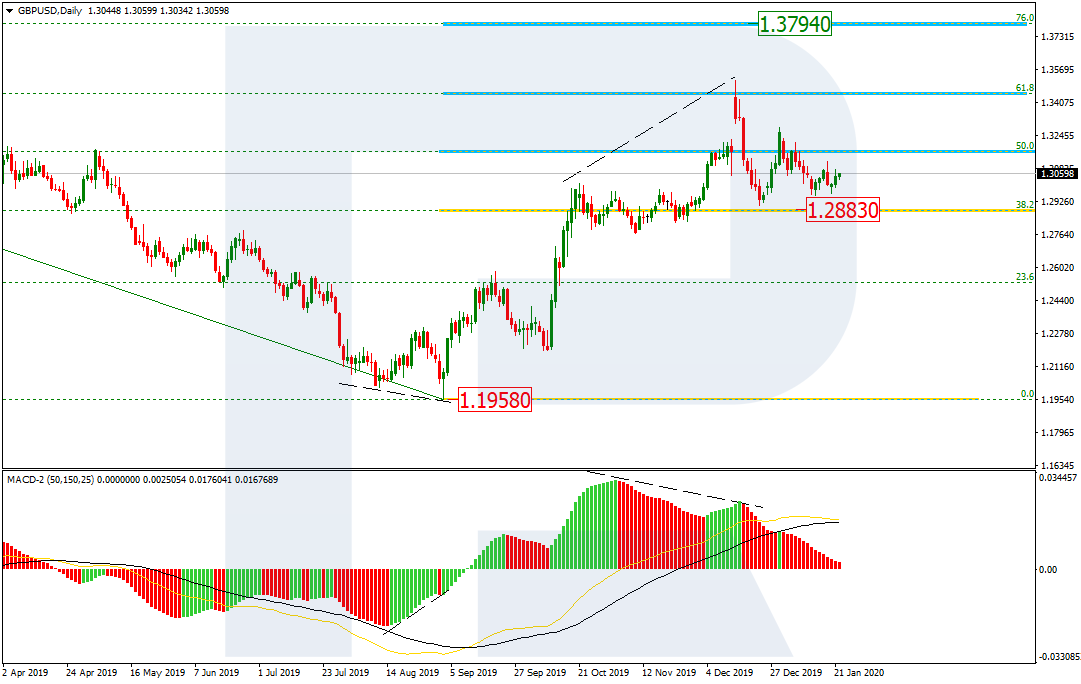
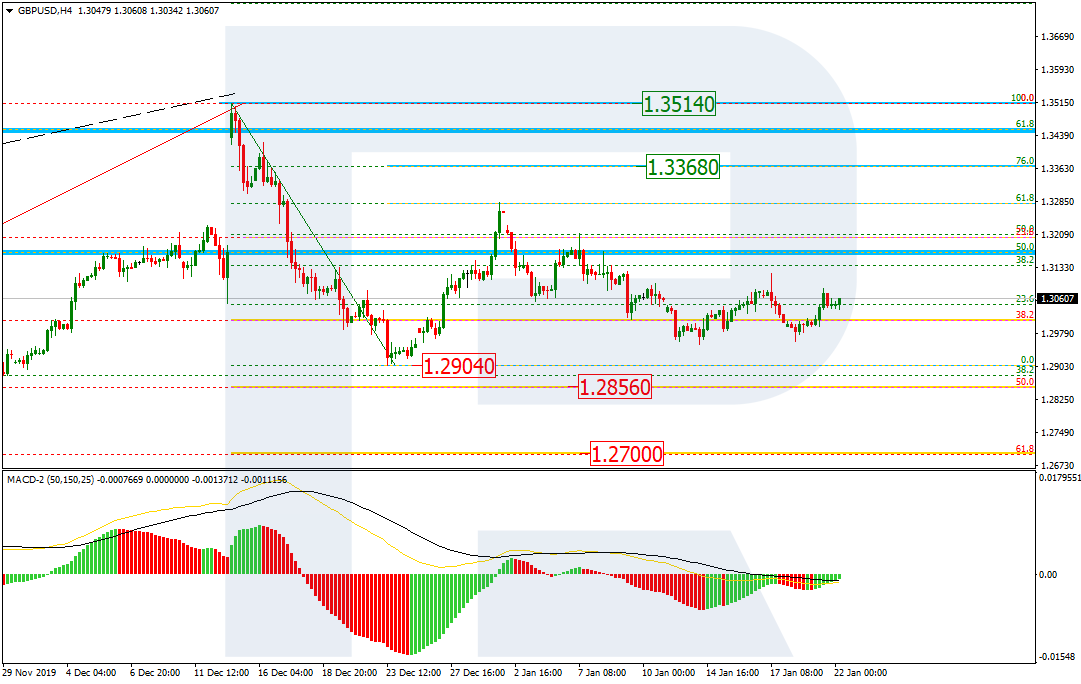
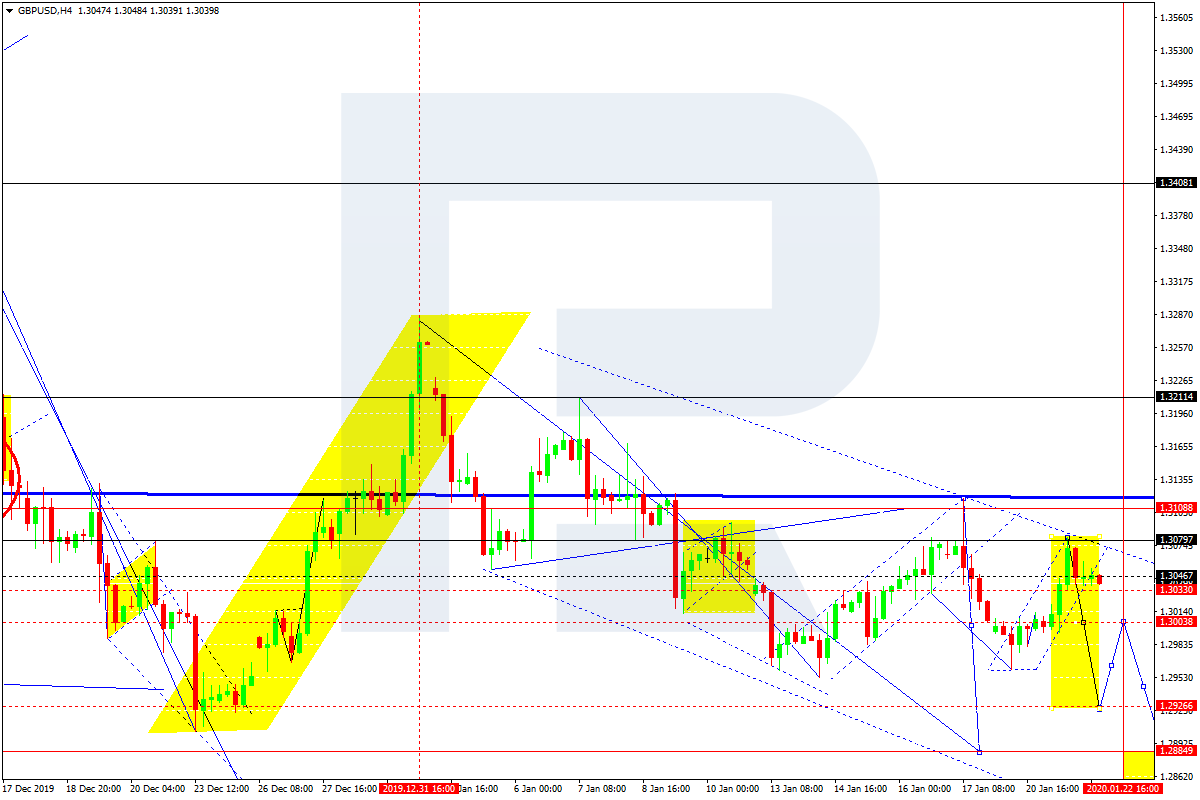
GBPUSD, “Great Britain Pound vs US Dollar”
GBPUSD has finished the ascending correctional structure towards 1.3080. Today, the pair may fall to break 1.3000 and then continue trading inside the downtrend with the short-term target at 1.2927.
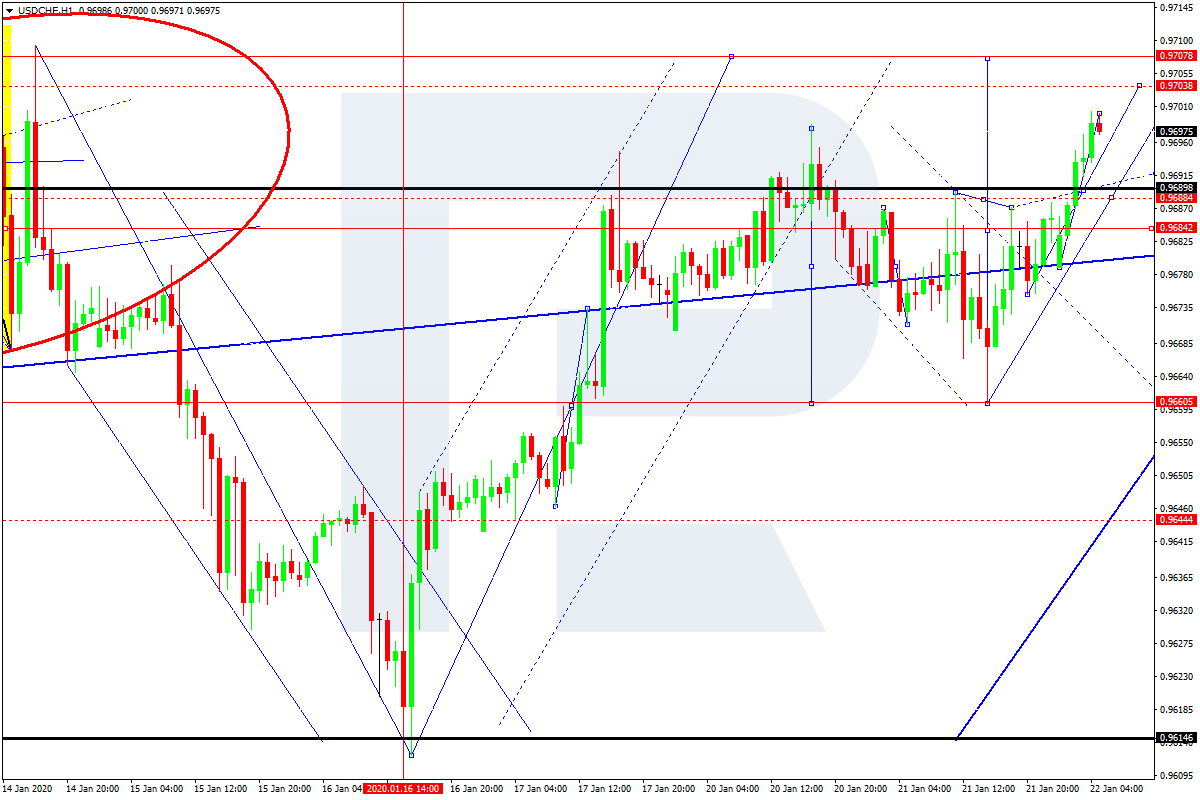
USDCHF, “US Dollar vs Swiss Franc”
USDCHF has broken 0.9688; right now, it is still forming the fifth ascending wave. Possibly, today the pair may test 0.9690 from above and then form one more ascending structure with the short-term target at 0.9703.
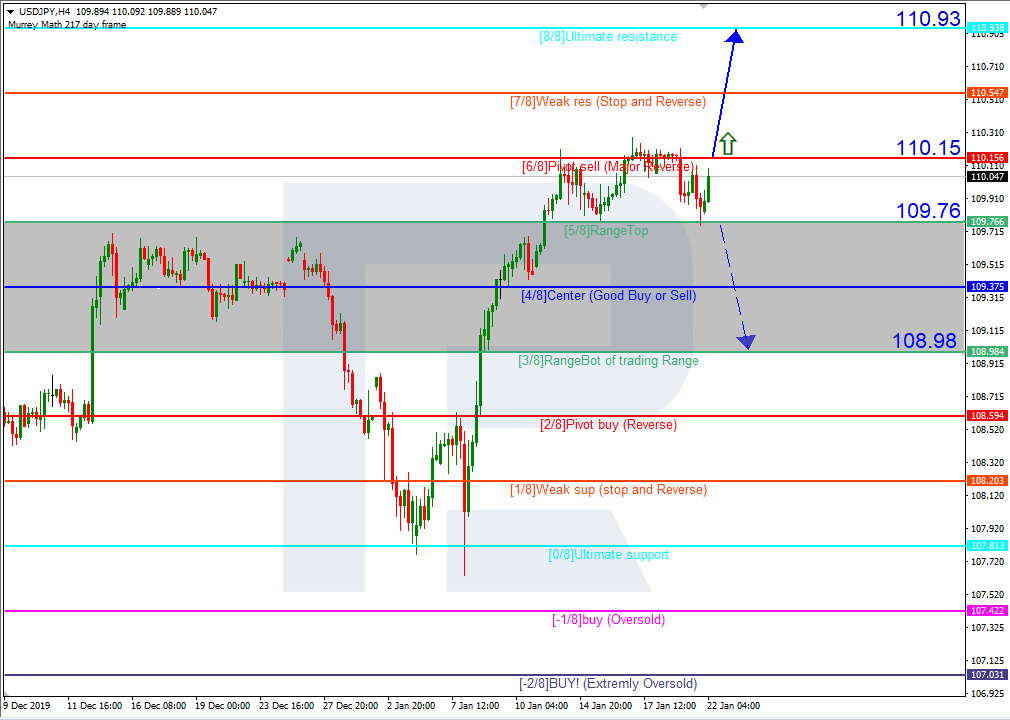
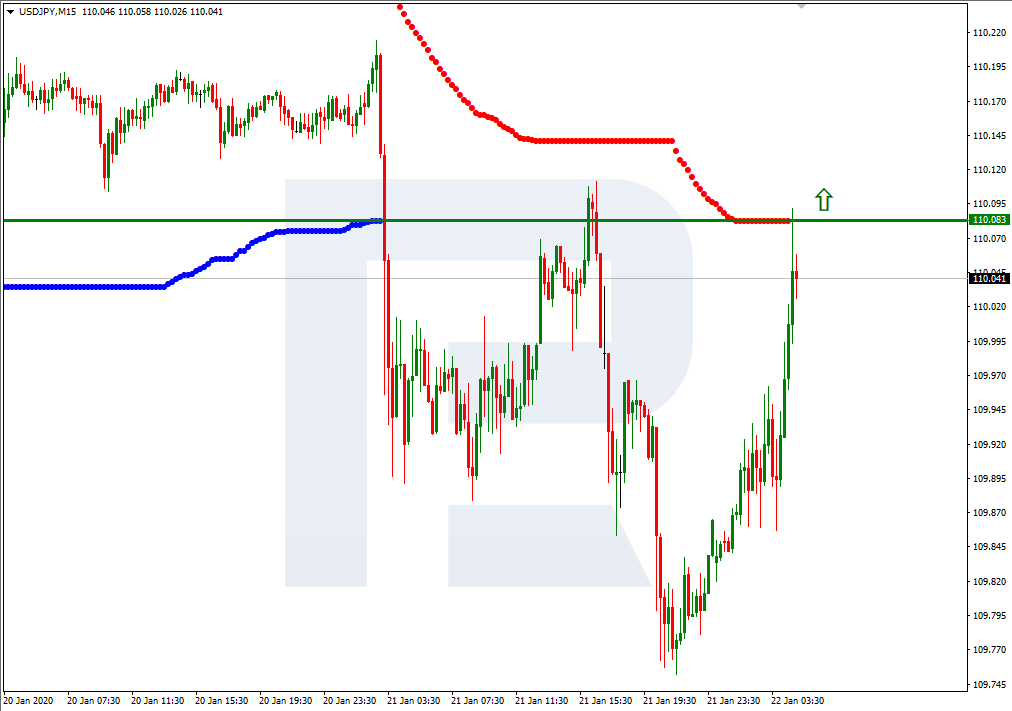
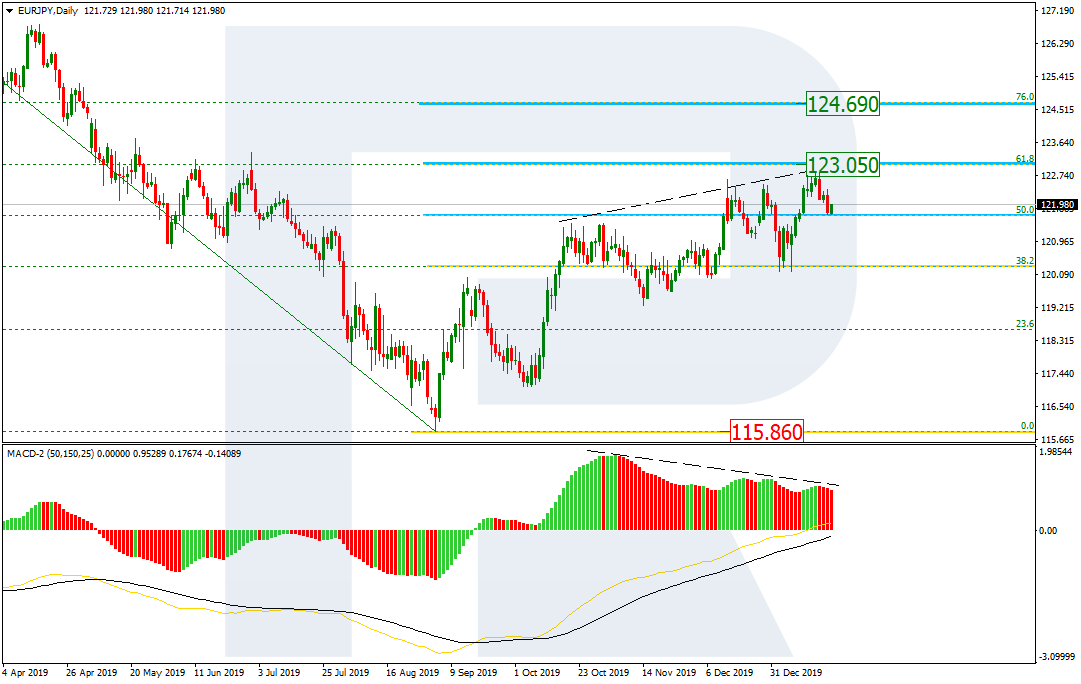
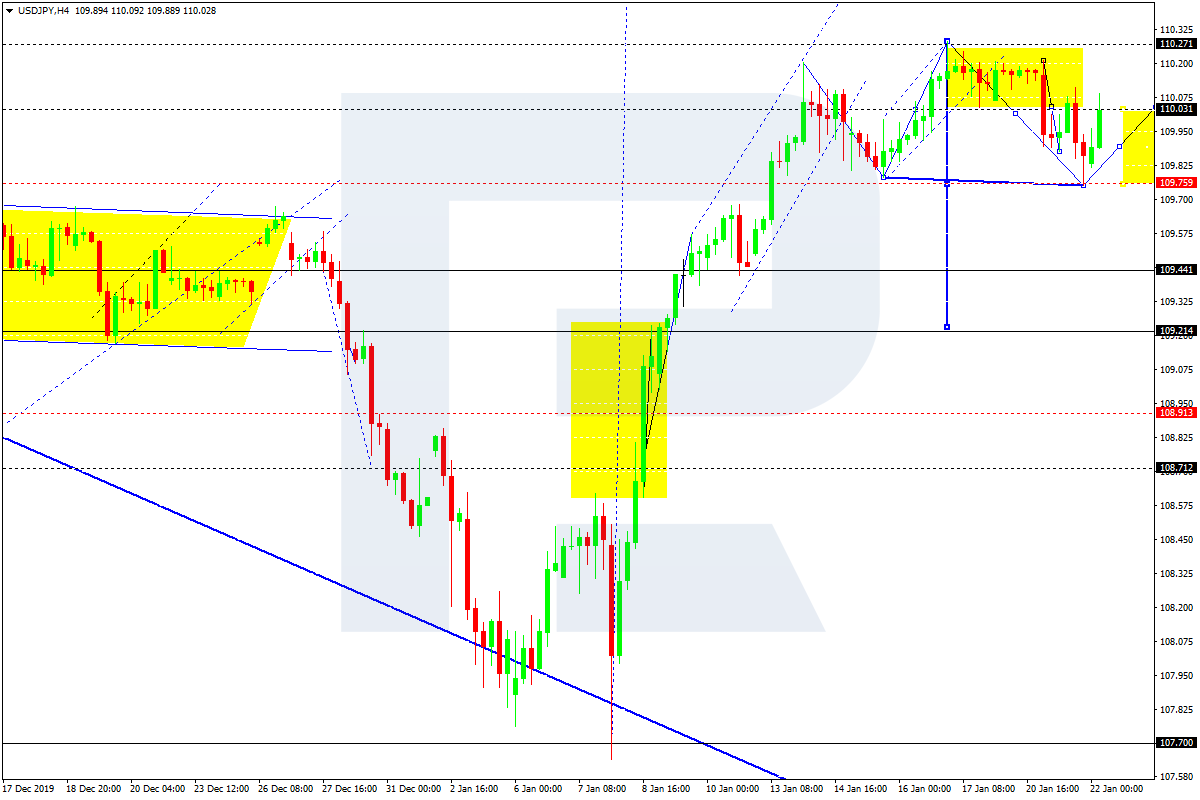
USDJPY, “US Dollar vs Japanese Yen”
After completing the descending impulse at 109.80, USDJPY has finished the correction towards 110.03. Today, the pair may fall to break 109.80 and then continue moving downwards with the short-term target at 109.41.
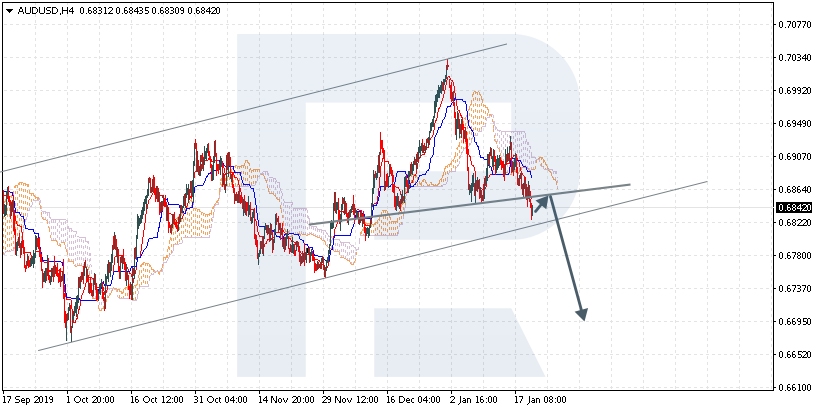
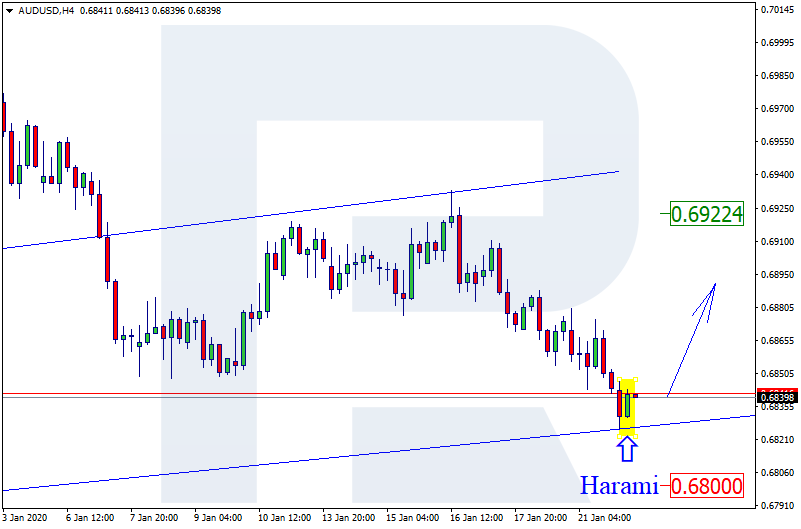
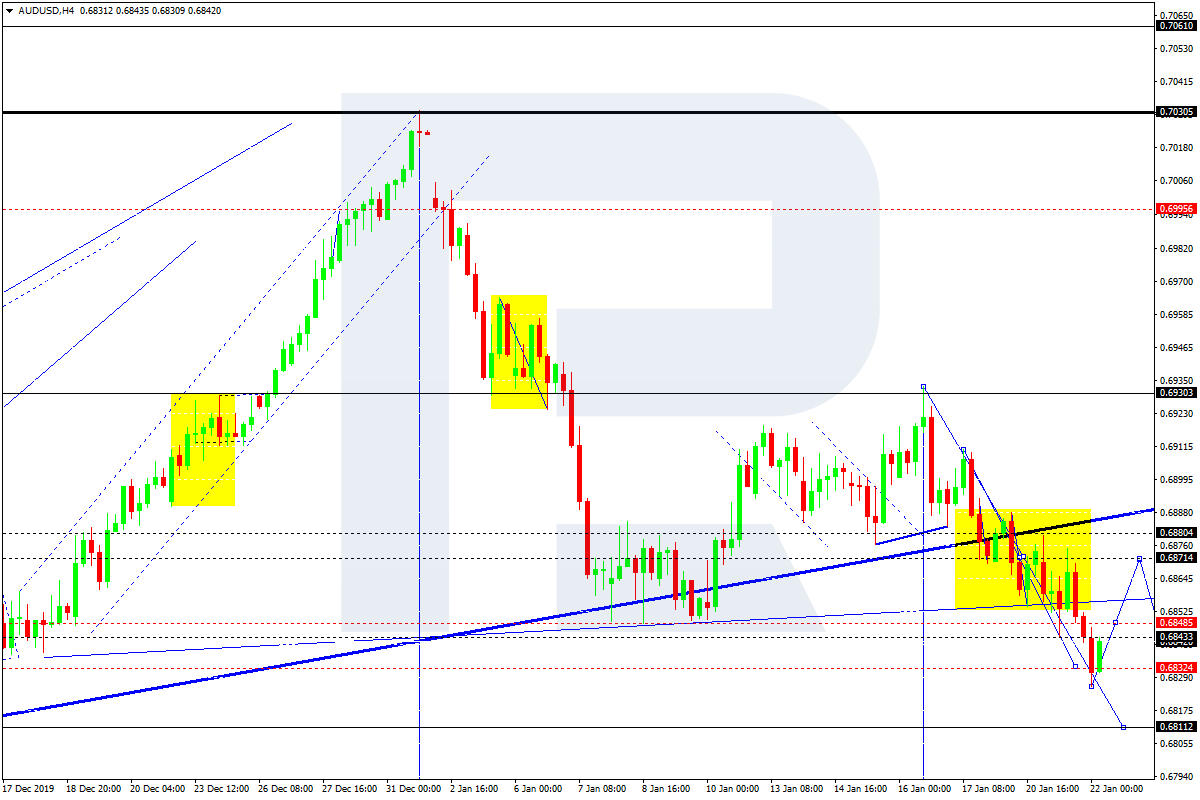
AUDUSD, “Australian Dollar vs US Dollar”
AUDUSD has finished the descending structure towards 0.6832. Possibly, today the pair may resume moving upwards to reach 0.6850 and then start another decline with the target at 0.6811.
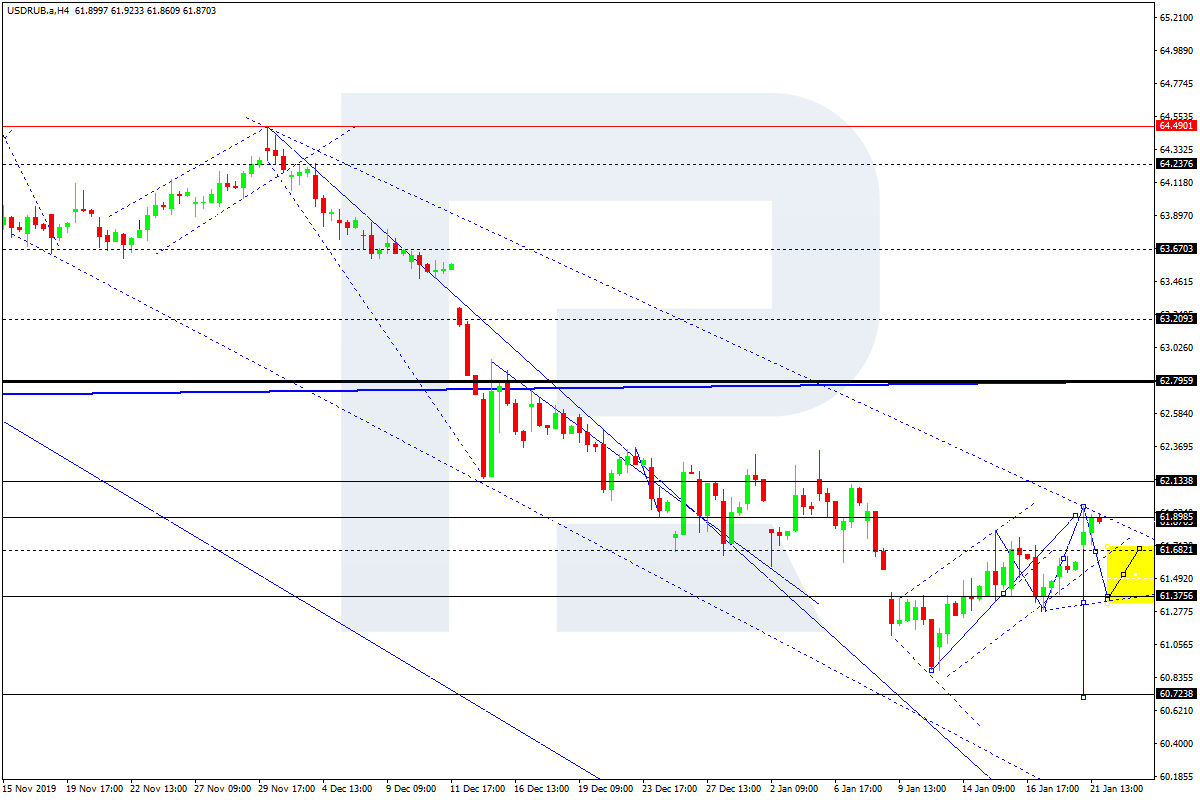
USDRUB, “US Dollar vs Russian Ruble”
USDRUB has reached 61.90; right now, it is consolidating at the top. According to the main scenario, the price is expected to resume trading inside the downtrend with the target at 61.37.
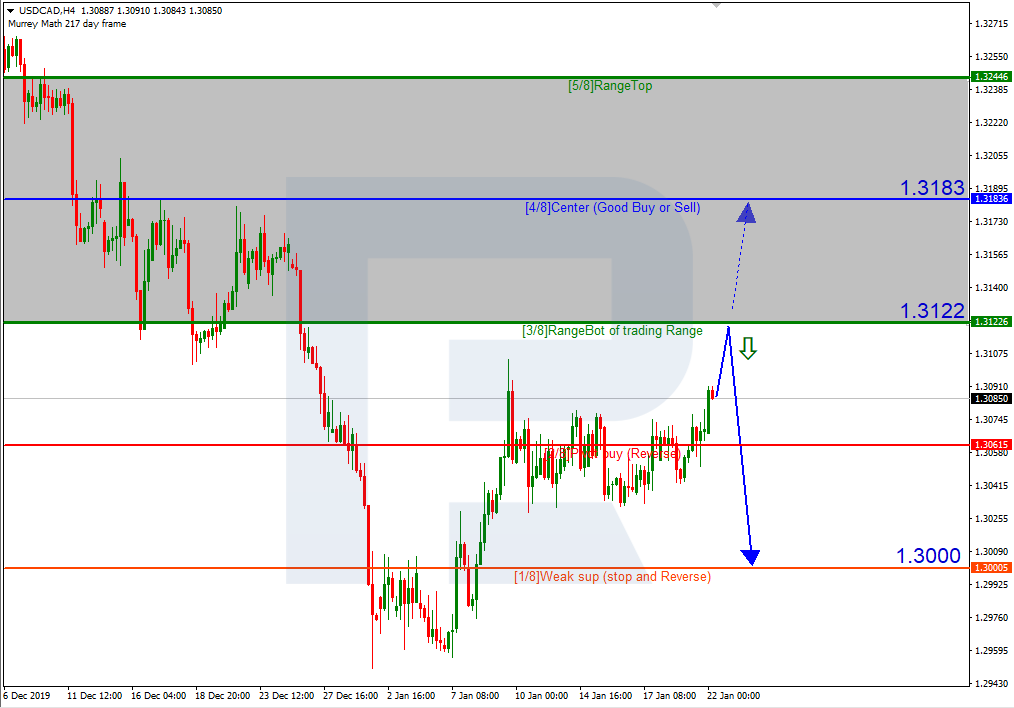
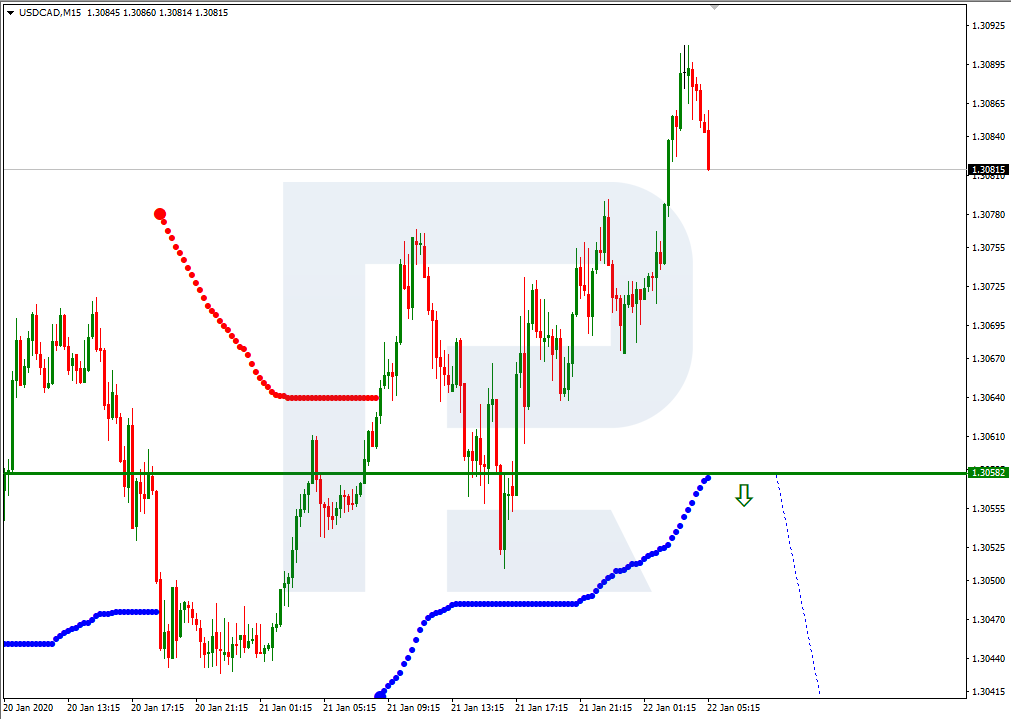
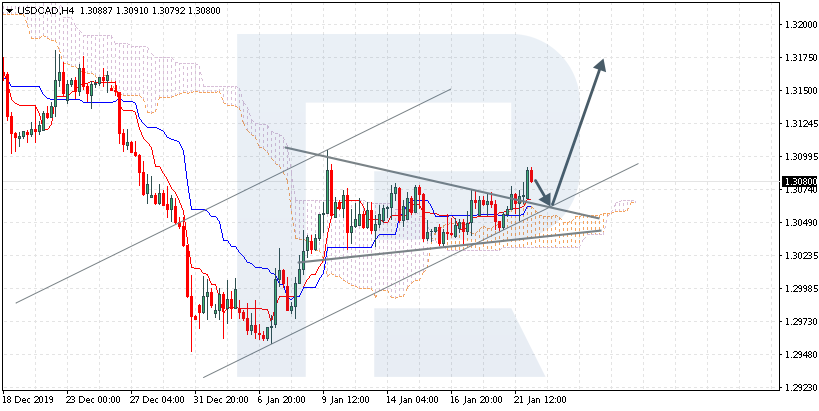
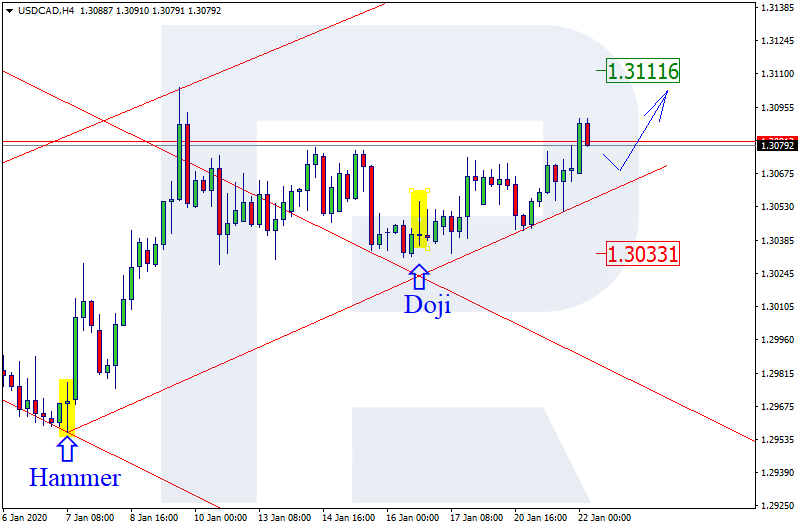
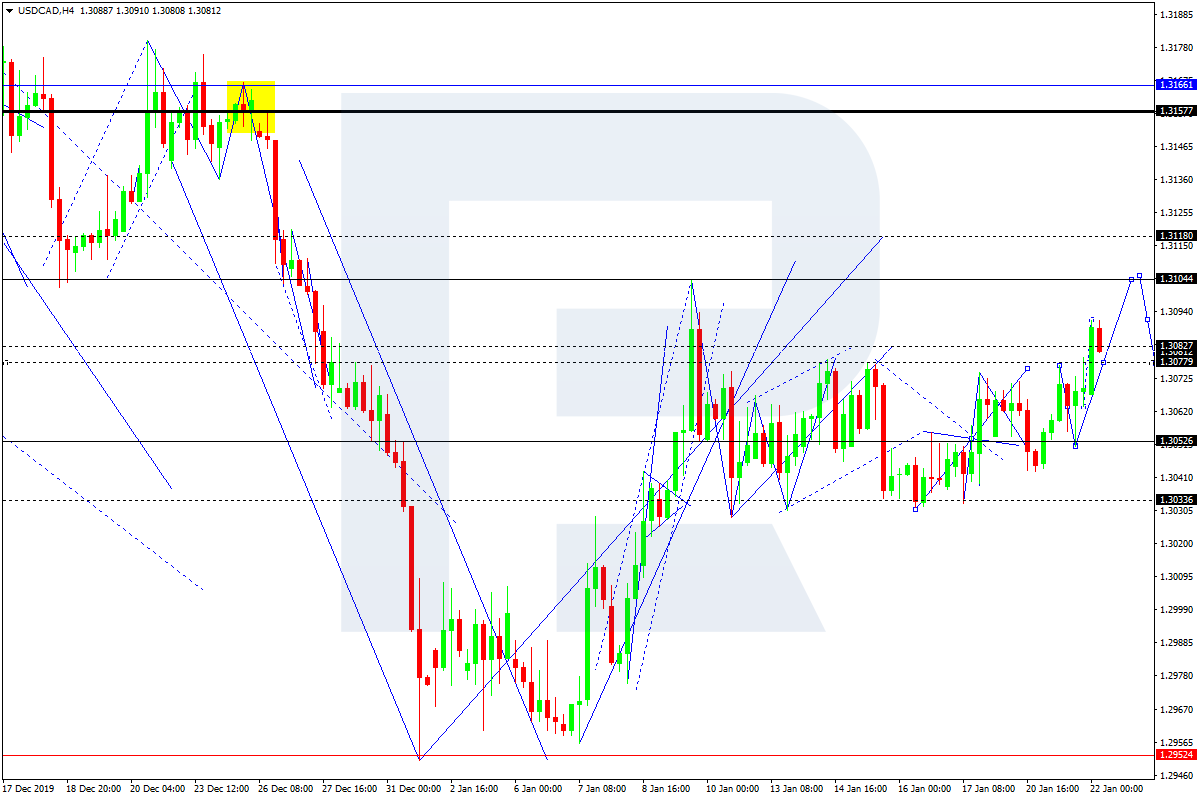
USDCAD, “US Dollar vs Canadian Dollar”
USDCAD is forming another ascending structure towards 1.3104. After that, the instrument may start a new correction to reach 1.3077 and then resume trading upwards growth with the target at 1.3118.
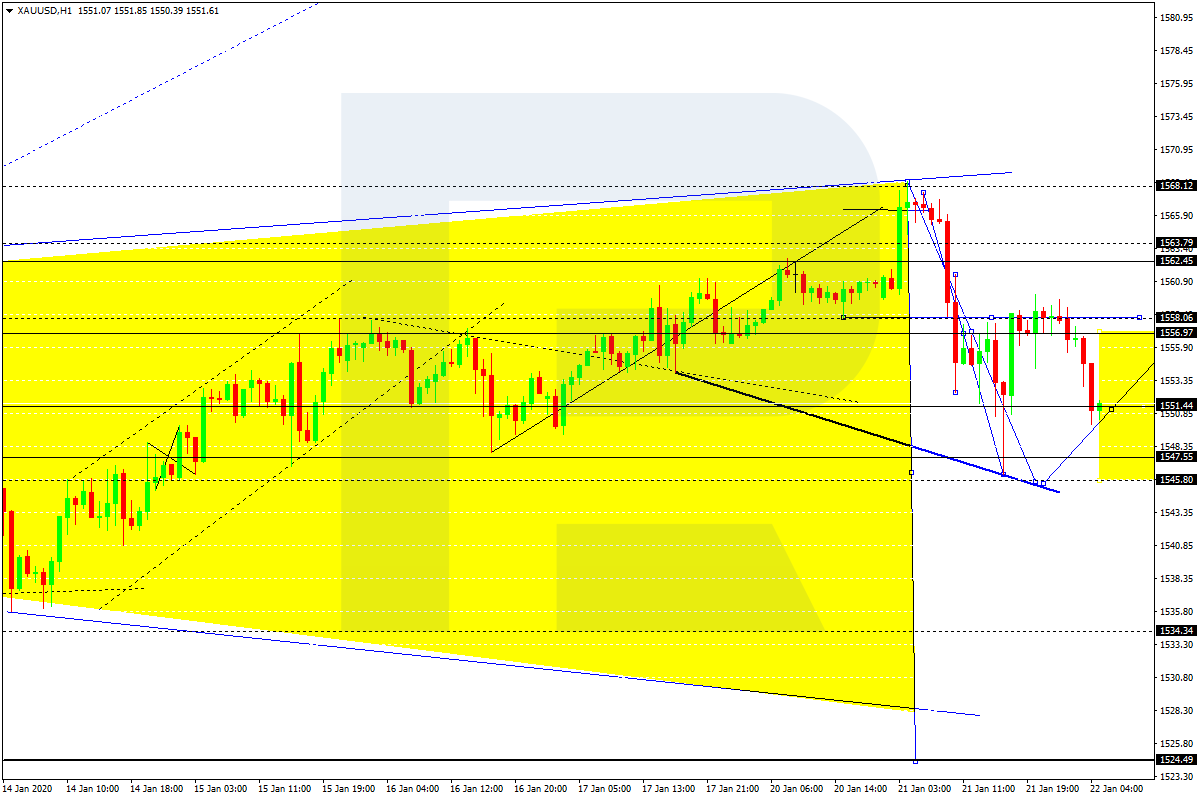
XAUUSD, “Gold vs US Dollar”
Gold is forming one more descending structure towards 1545.80. Later, the market may start another correction with the target at 1556.96 and then resume trading downwards to reach 1534.34.
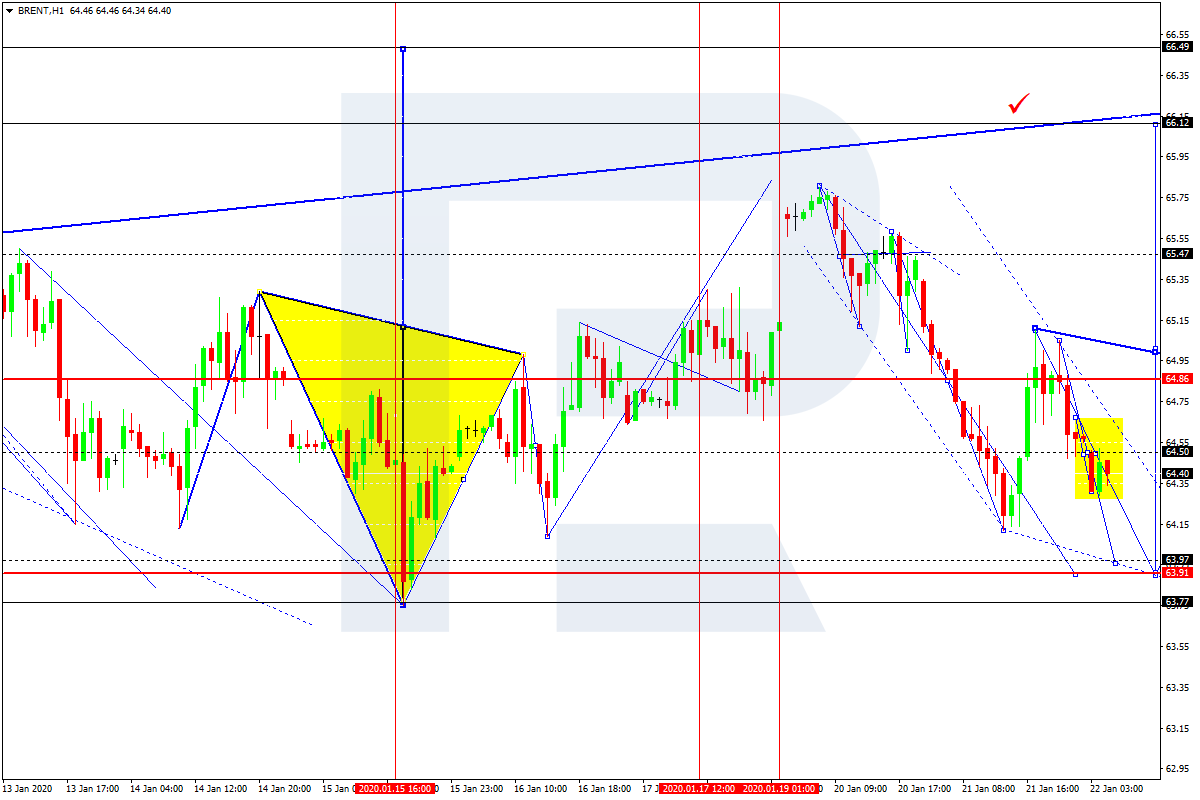
BRENT
Brent is moving downwards. Possibly, the pair may reach 63.97 and then start another growth with the target at 64.90.
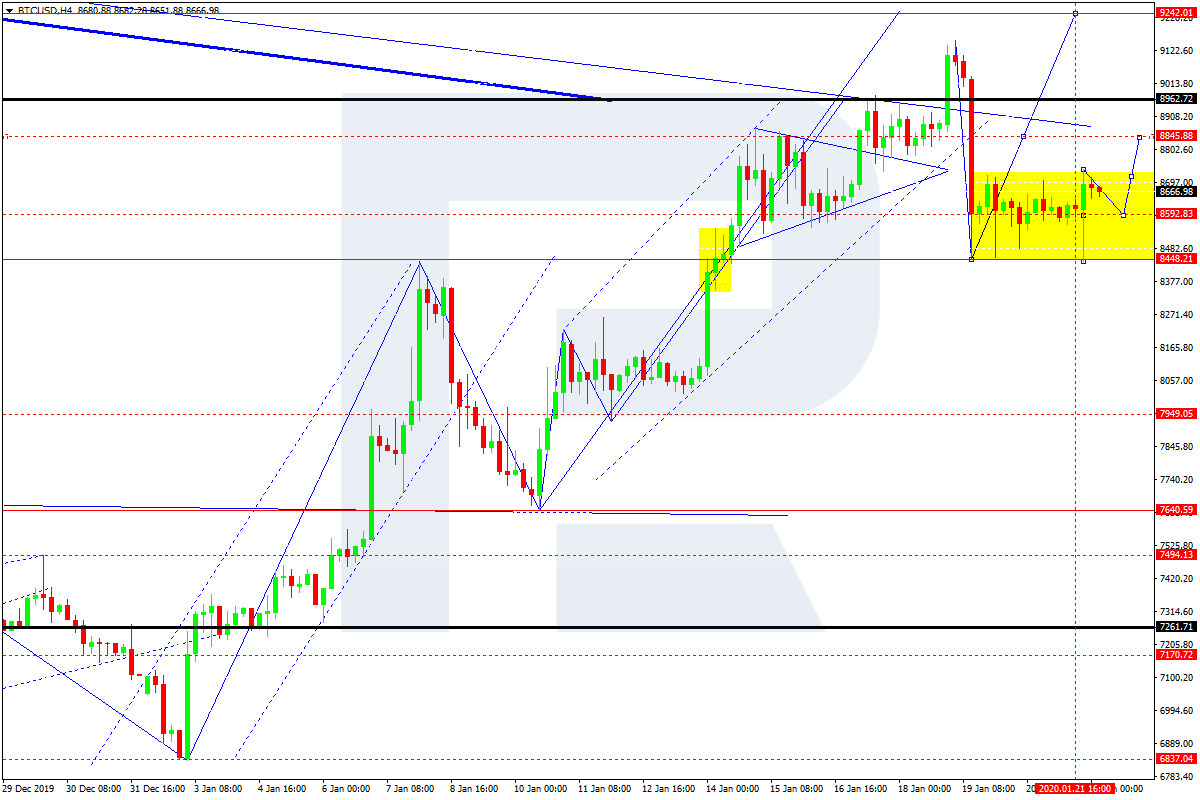
BTCUSD, “Bitcoin vs US Dollar”
BTCUSD is still consolidating around 8600.00. The main scenario implies that the pair may grow to break 8850.00 and then continue trading upwards to reach 9240.00. After that, the instrument may start a new decline with the target at 7700.00.