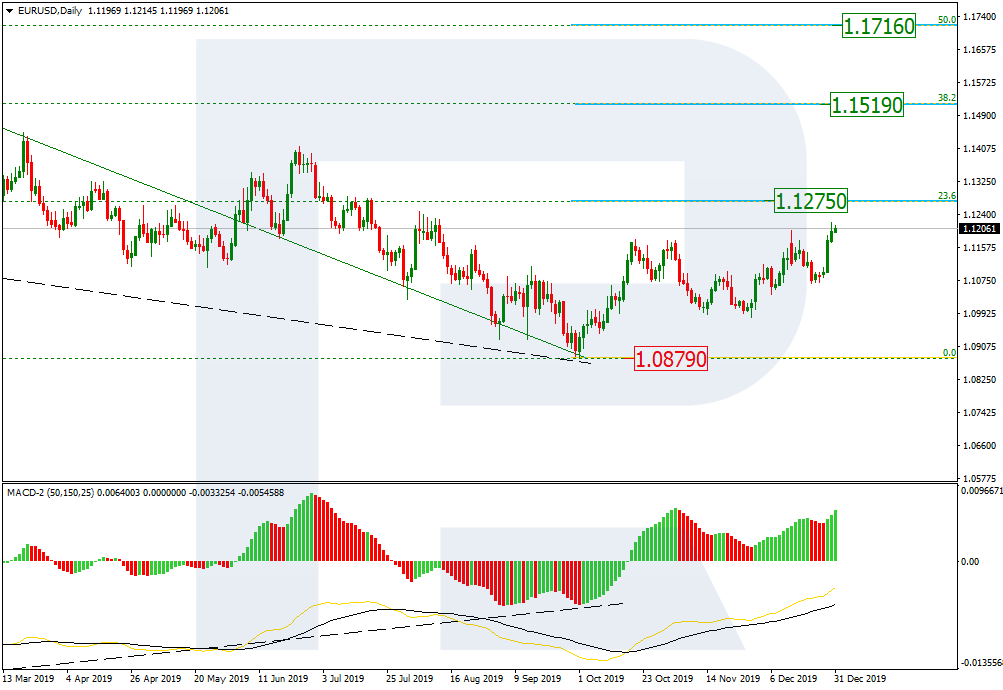
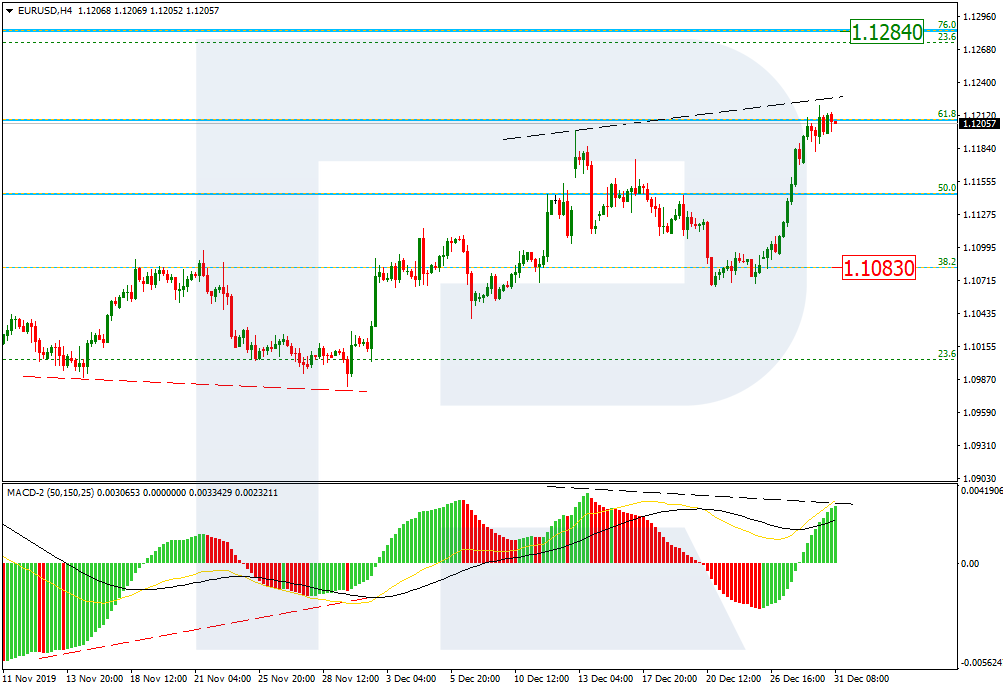
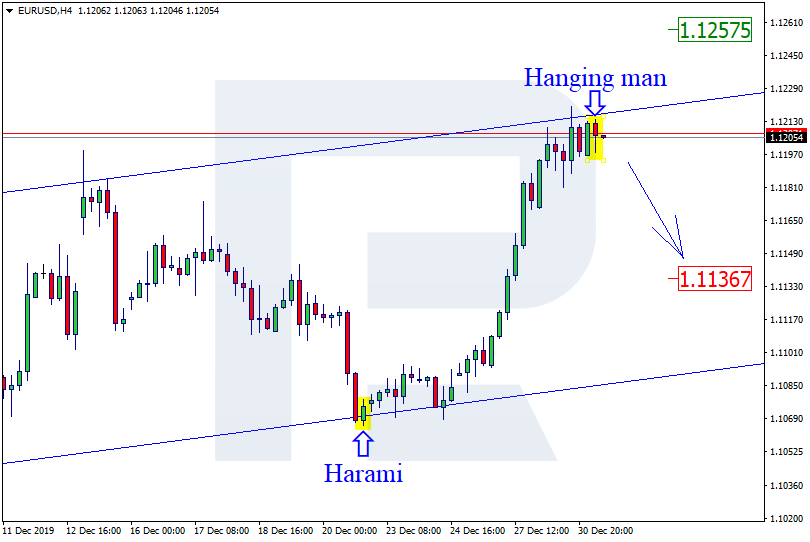
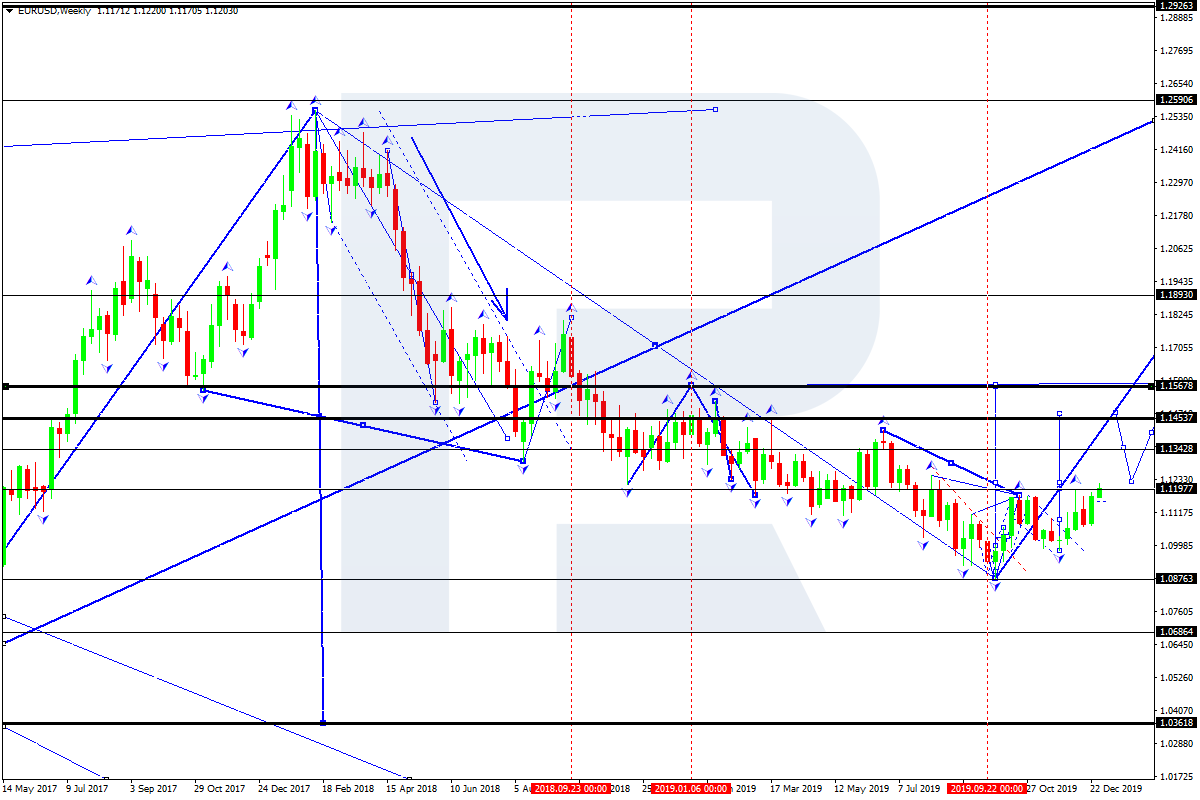
EURUSD, “Euro vs US Dollar”
EURUSD is forming the first ascending wave towards 1.1550. After that, the instrument may start a new correction to reach 1.1200 and then form one more ascending structure with the target at 1.1900. Later, the market may start another correction to return to 1.1550 and resume moving upwards to reach 1.2900. This level is considered as the key target for the entire year of 2020.

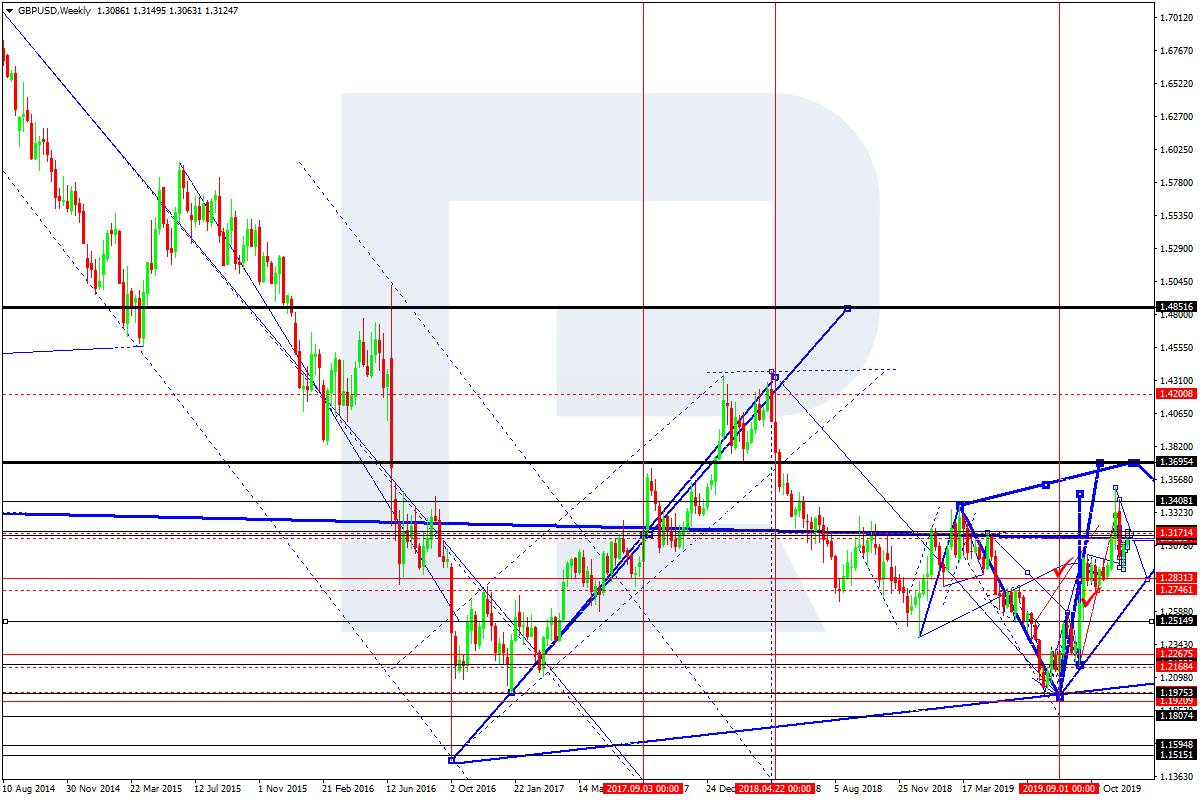
GBPUSD, “Great Britain Pound vs US Dollar”
GBPUSD is forming the fifth ascending wave with the target at 1.3690. Possibly, the pair may reach this level and then start a new correction towards 1.2850. Later, the market may form the third wave to reach 1.4000 and then start another correction towards 1.3700. After that, the instrument may form one more ascending structure with the target at 1.4850. This level is considered as the key target for the entire year of 2020.
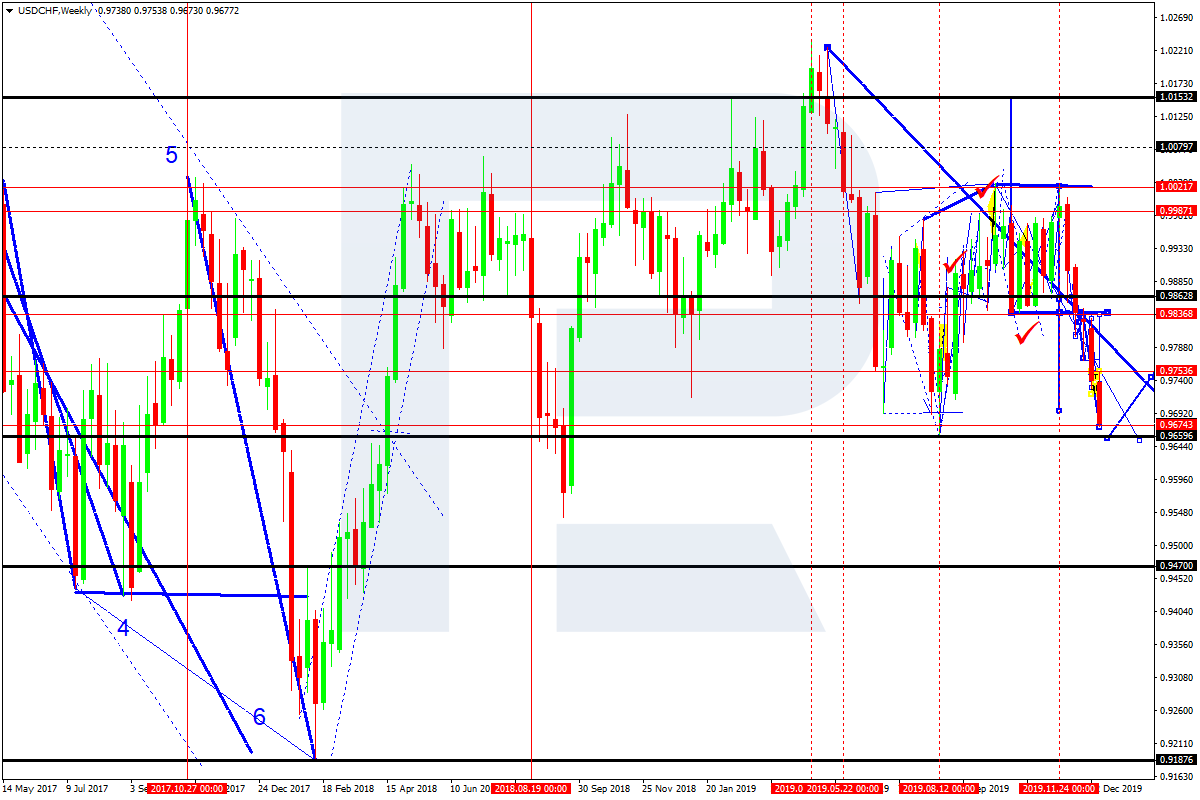
USDCHF, “US Dollar vs Swiss Franc”
After breaking 0.9850 to the downside, USDCHF may continue the correction towards 0.9660. After that, the instrument may reverse and correct to reach 0.9850, thus forming a wide consolidation range. If later the price breaks this range to the downside, the market may continue trading inside the downtrend towards 0.9450. This level is considered as the key target for the entire year of 2020.
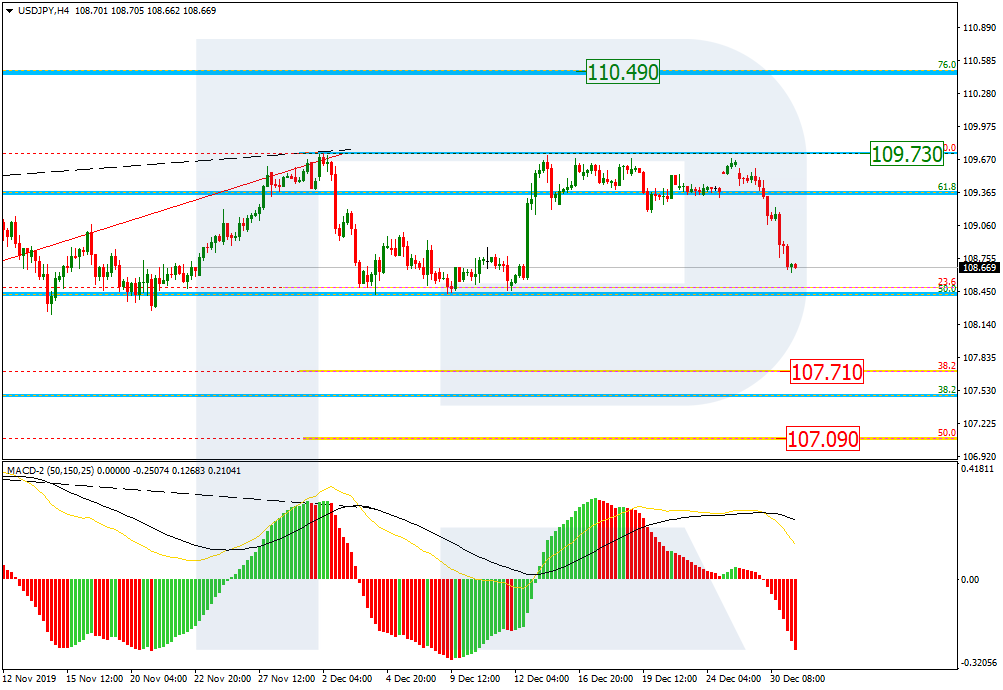
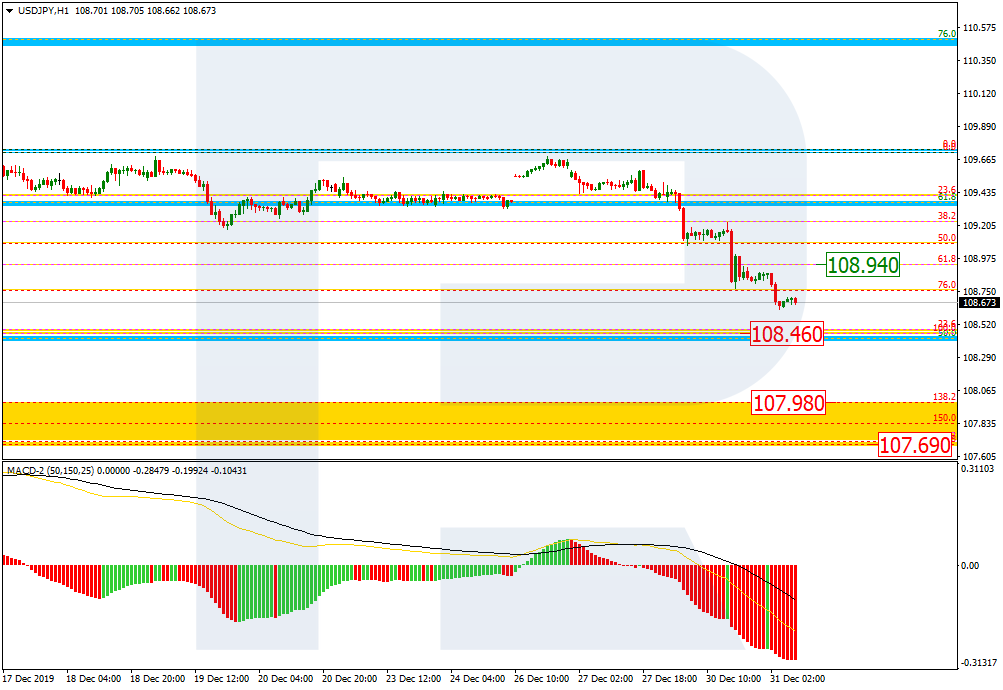
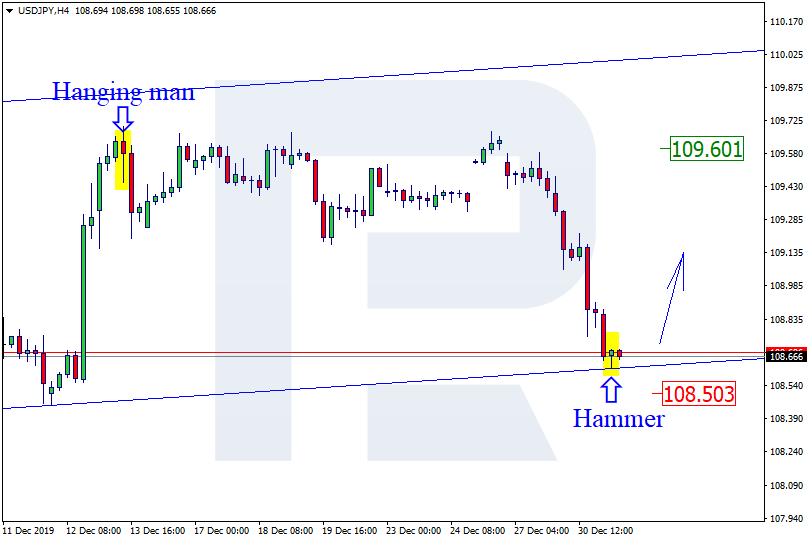
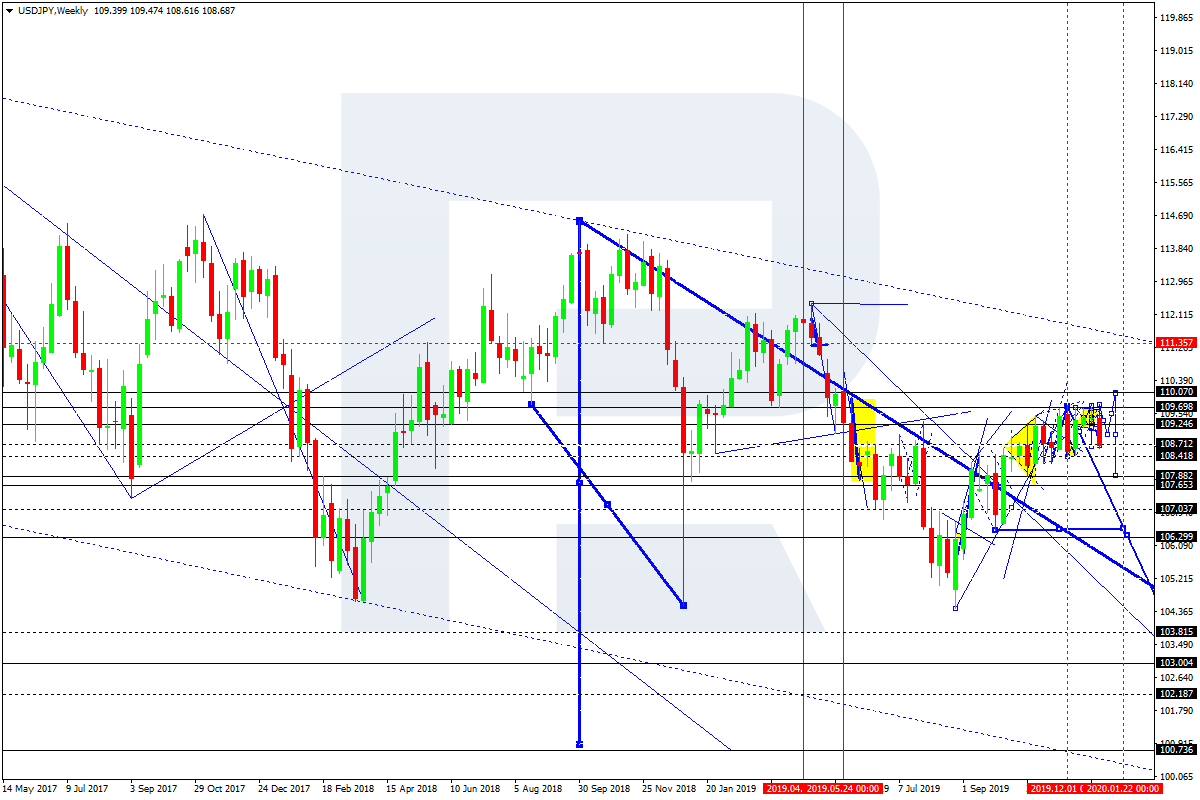
USDJPY, “US Dollar vs Japanese Yen”
USDJPY has broken 109.14 to the downside. Possibly, the pair may start the fifth descending wave towards 103.00. This level is considered as the key target for the entire year of 2020. However, the first downside target is at 107.90.
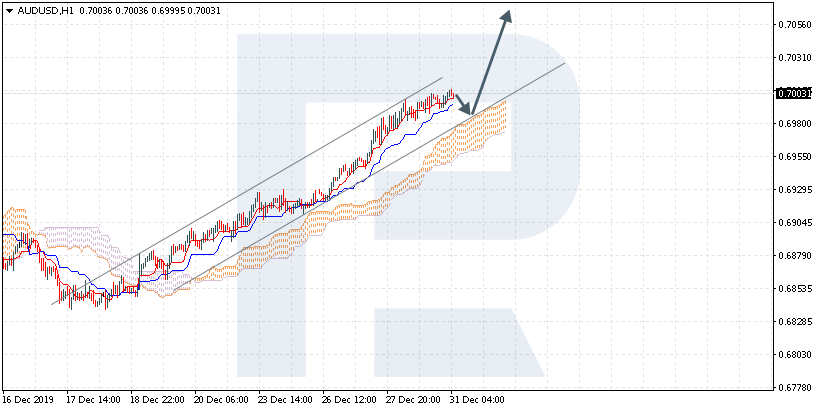
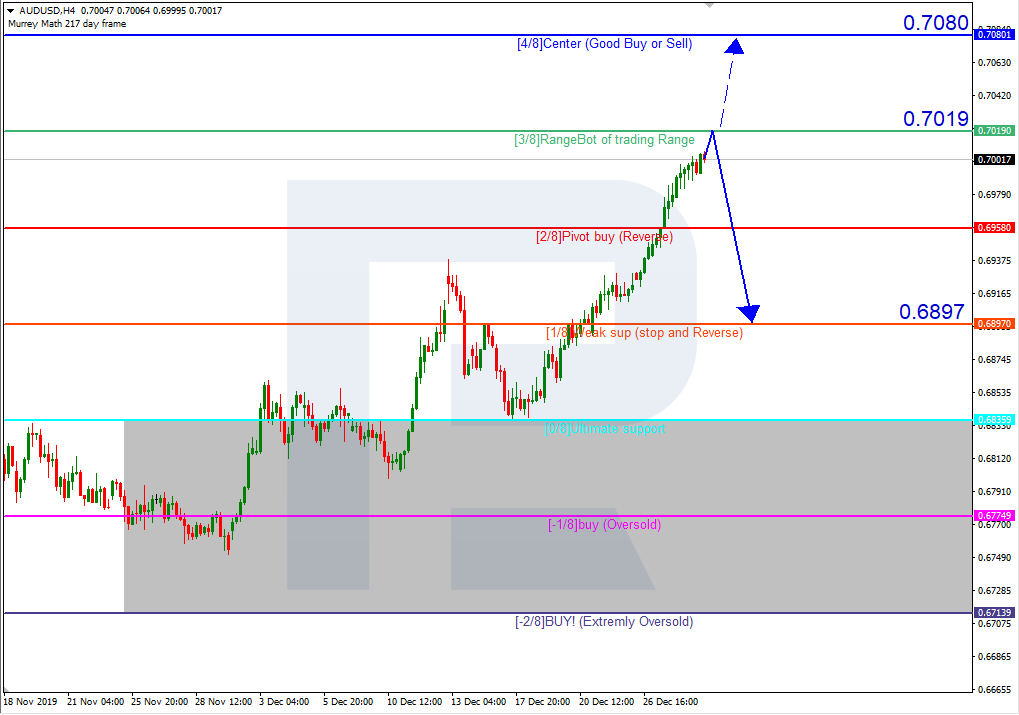
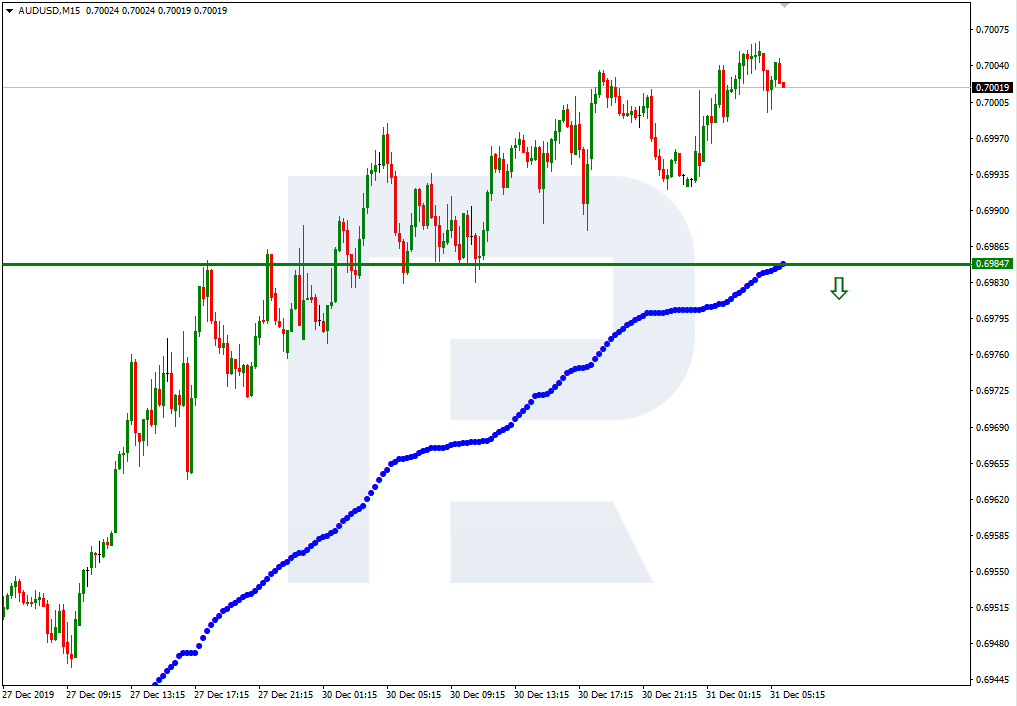
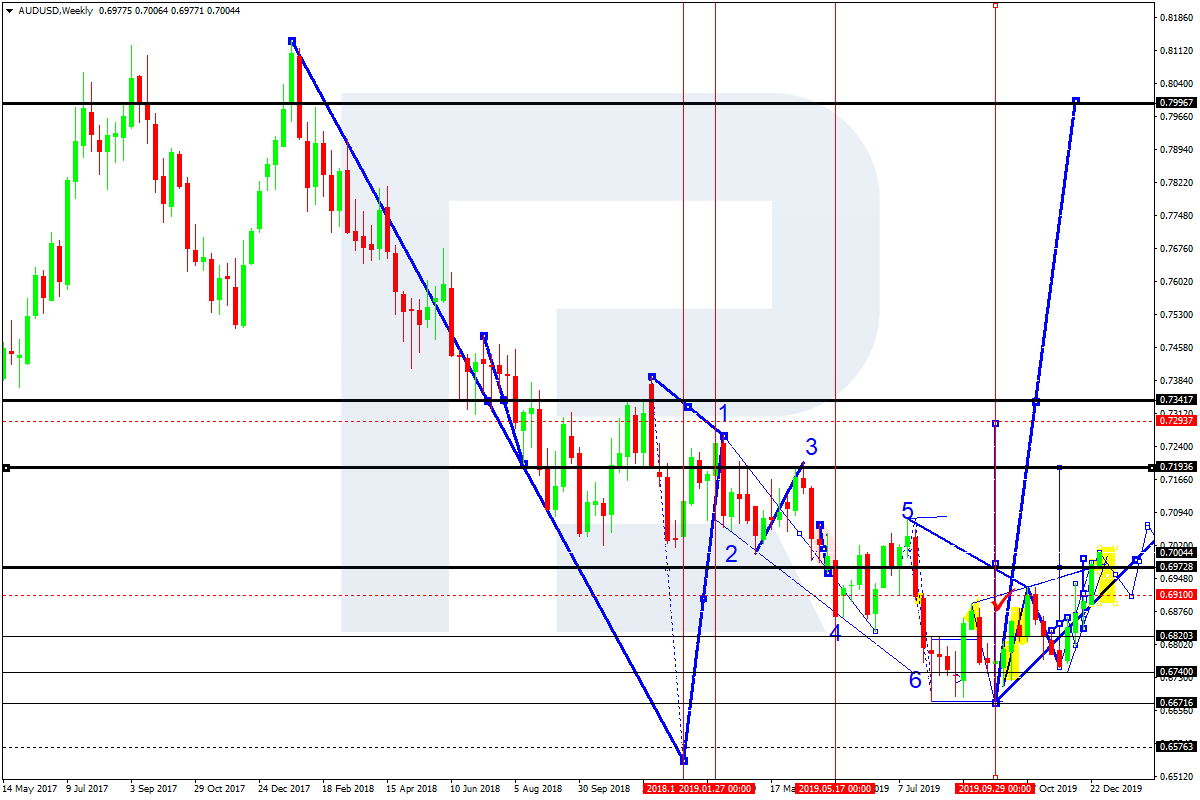
AUDUSD, “Australian Dollar vs US Dollar”
AUDUSD is trading to break 0.6970 upwards. Possibly, the pair may consolidate around this level and even start a new correction towards 0.6900. If later the price breaks this range to the upside, the market may form the third ascending wave to reach 0.7200 and then start another correction towards 0.7000. After that, the instrument may form one more ascending structure with the target at 0.7300. This level is considered as the key target for the entire year of 2020.
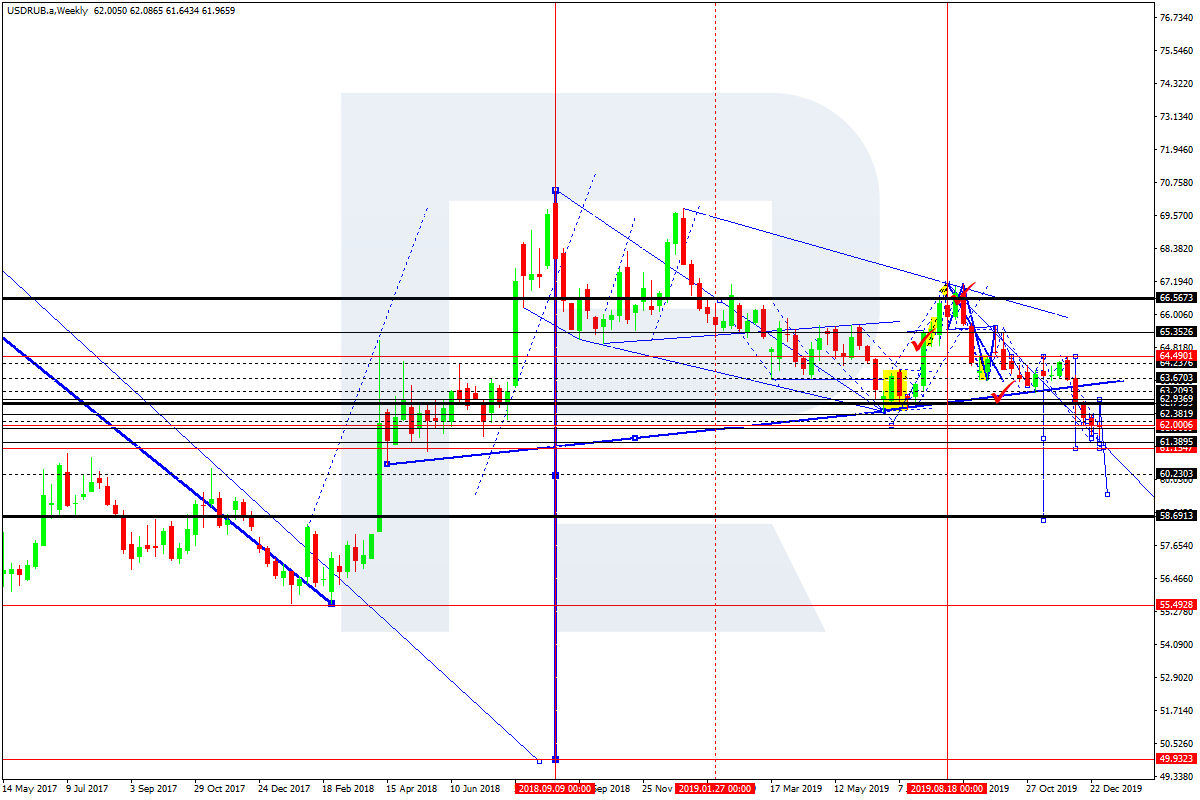
USDRUB, “US Dollar vs Russian Ruble”
USDRUB has broken 63.00 and may continue trading inside the downtrend towards 55.00. This level is considered as the key target for the entire year of 2020.
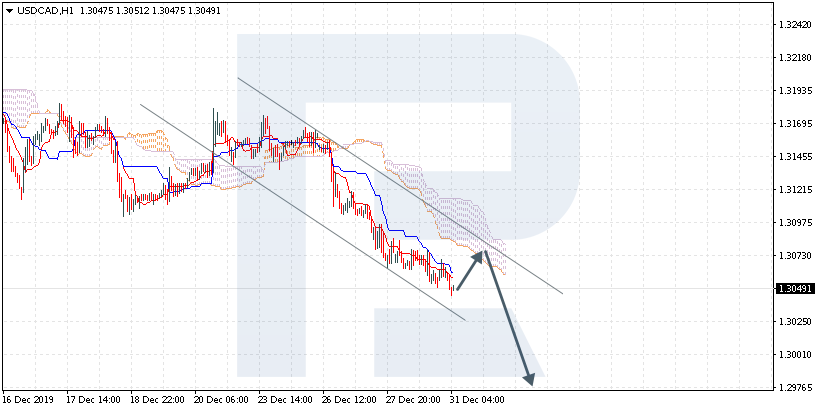
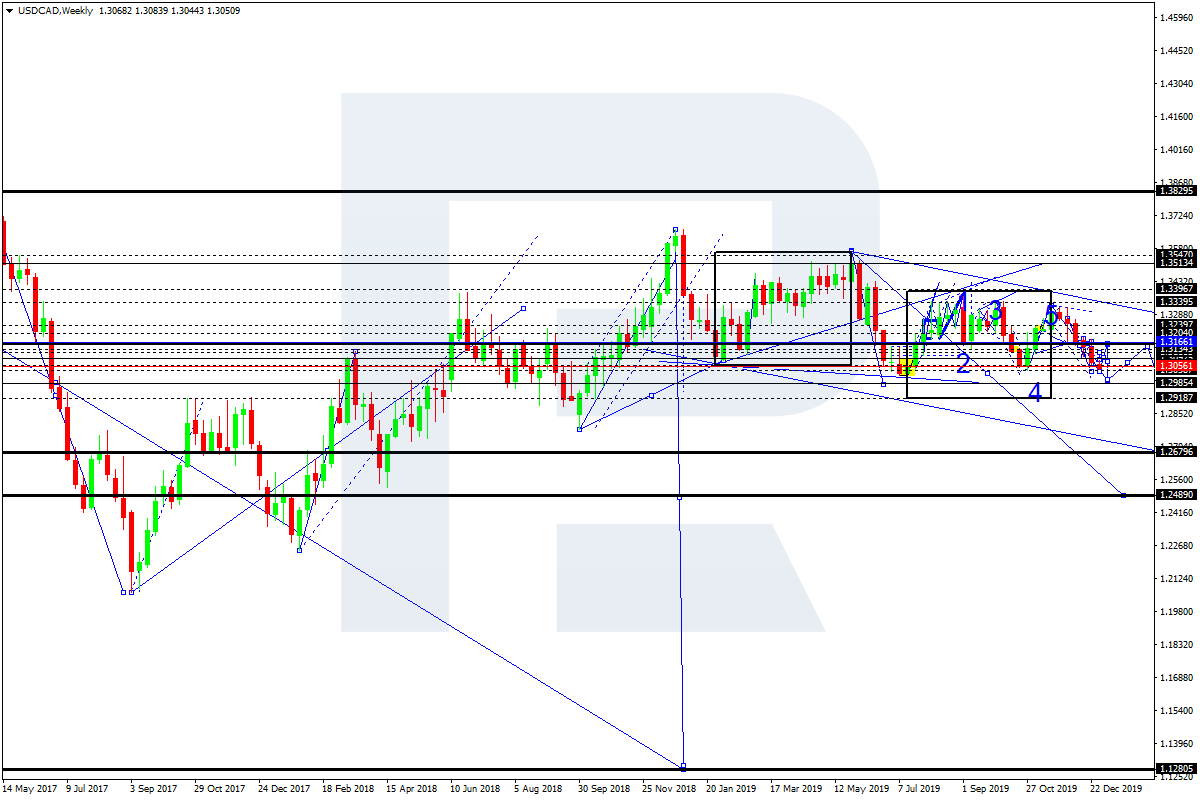
USDCAD, “US Dollar vs Canadian Dollar”
USDCAD is still moving downwards to reach 1.2960. Later, the market may start another correction towards 1.3200 and then form a new descending structure to reach 1.2680. This level is considered as the key target for the entire year of 2020.
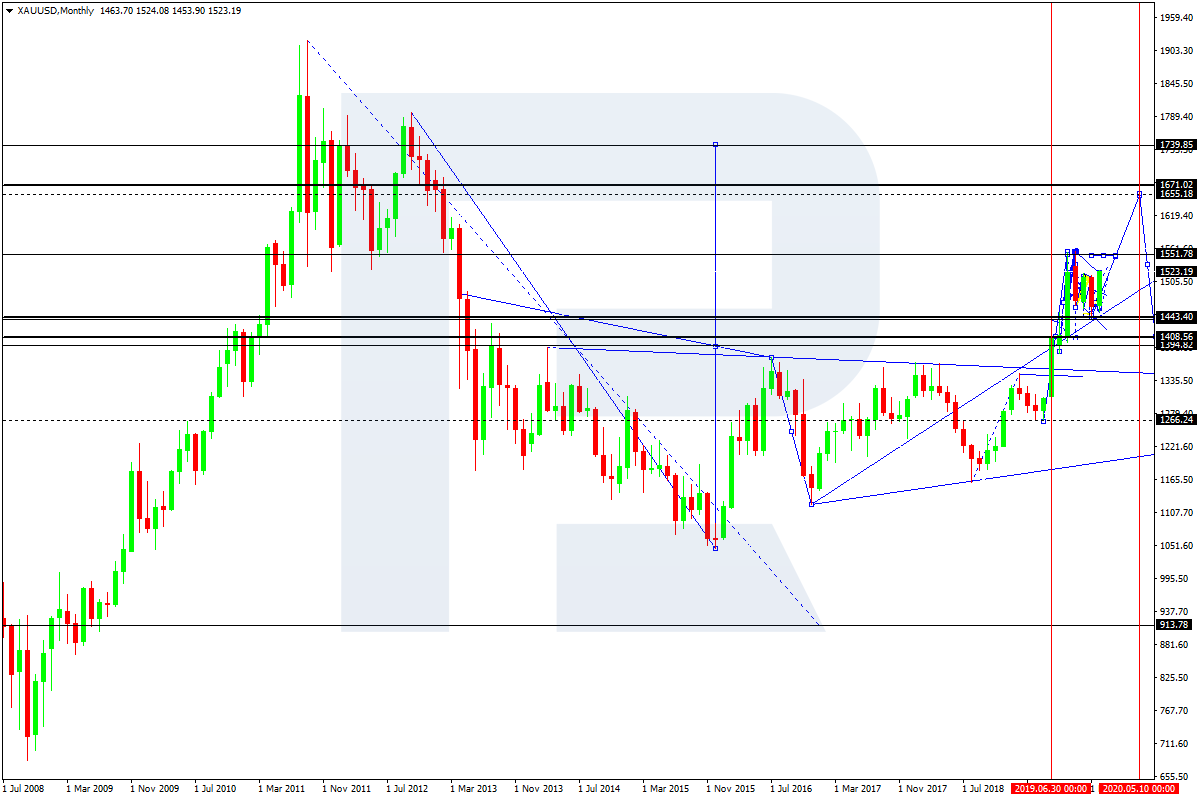
XAUUSD, “Gold vs US Dollar”
Gold continues moving upwards; it has almost rebounded from 1447.00 to the upside. Possibly, the pair may continue trading inside the uptrend with the short-term target of the third ascending wave at 1660.00. After that, the instrument may start a new correction to reach 1550.00 or even 1400.00. Later, the market may resume moving upwards with the target at 1685.00. This level is considered as the key target for the entire year of 2020.
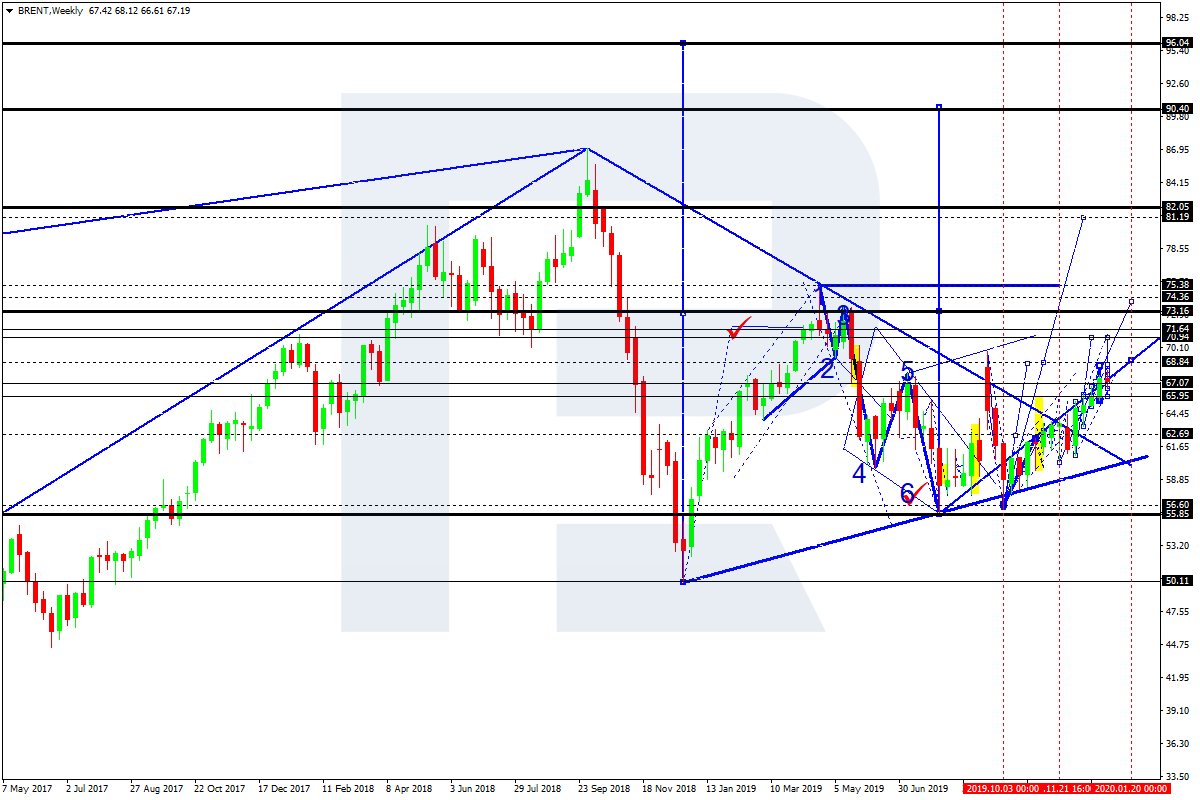
BRENT
Brent continues forming the third ascending wave. Possibly, the pair may break 68.80 and form an upside continuation pattern. The short-term upside target is at 82.00. This level is considered as the key target for the entire year of 2020.
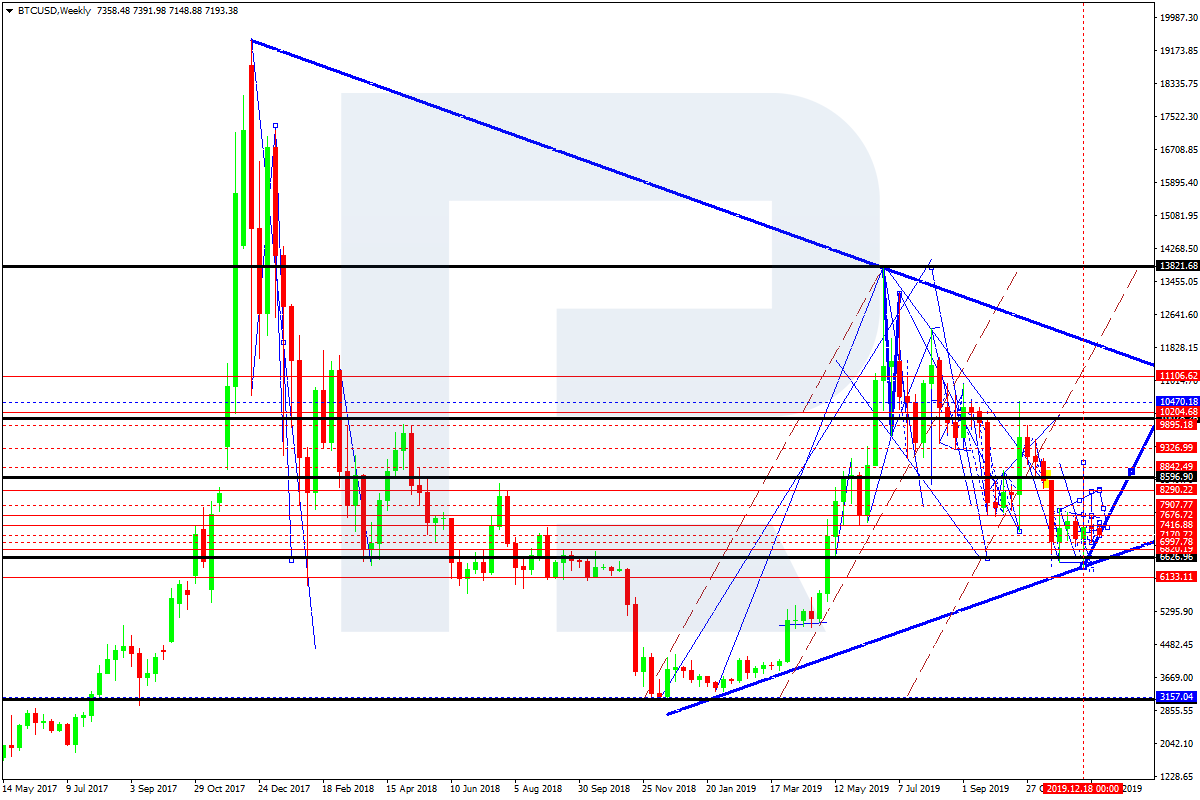
BTCUSD, “Bitcoin vs US Dollar”
After finishing the ascending pulse at 7600.00, BTCUSD has completed the correction at 7000.00, thus forming a new consolidation range. If later the price breaks this range to the downside at 7000.00, the market may continue trading inside the downtrend towards 4200.00; if to the upside at 7600.00 – start a new growth with the target at 8600.00 and then 11100.00.