Fibonacci Retracements Analysis 20.12.2019 (BITCOIN, ETHEREUM)

Fibonacci Retracements Analysis 20.12.2019 (BITCOIN, ETHEREUM)

20.12.2019

BTCUSD, “Bitcoin vs US Dollar”

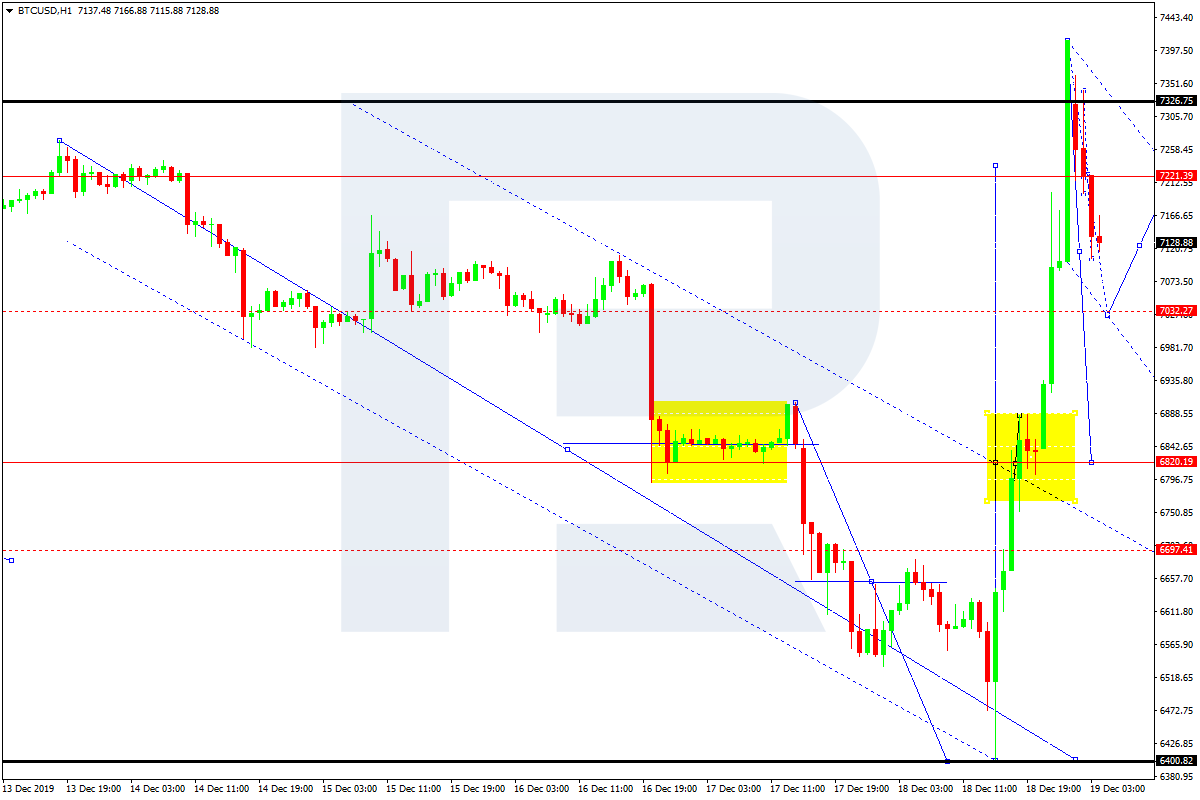
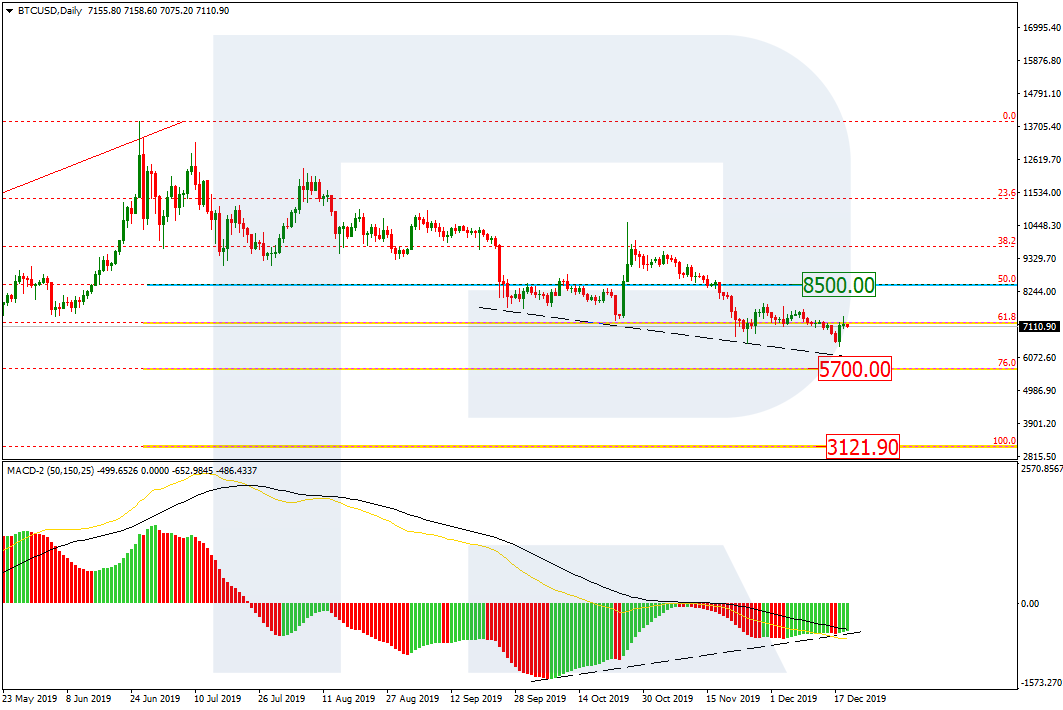
As we can see in the daily chart, the descending tendency continues. After updating the local low, BTCUSD has returned to 61.8% fibo. Considering the convergence on MACD, this movement may be described as a short-term correction. The resistance is 50.0% fibo at 8490.00. After completing the correction, the pair may resume falling towards the target at 76.0% (5700.00). The key mid-term downside target is the low at 3121.90.

BTCUSD
Risk Warning: the result of previous trading operations do not guarantee the same results in the future

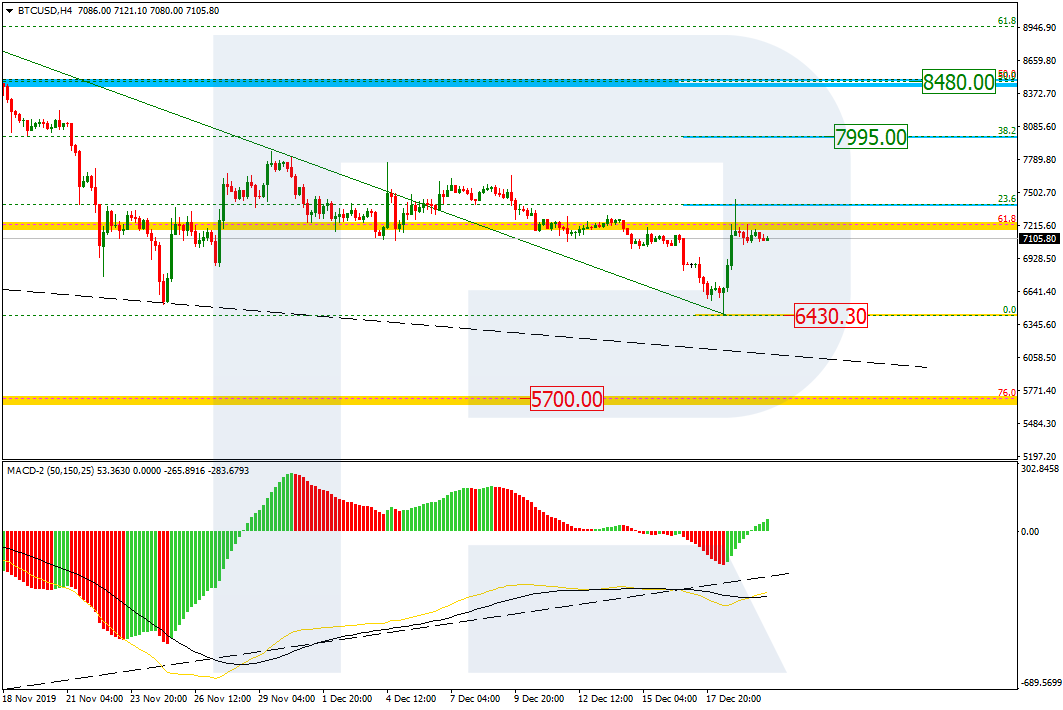
The H4 chart shows more detailed structure of the current local correction. By now, the pair has managed to reach 23.6% fibo; at the moment, the price is trading close to this level. The next rising impulse may later continue towards 38.2% and 50.0% fibo at 7995.00 and 8480.00 respectively. If the price breaks the local support at 6430.30, the correction will be over.

BITCOIN
Risk Warning: the result of previous trading operations do not guarantee the same results in the future

ETHUSD, “Ethereum vs. US Dollar”

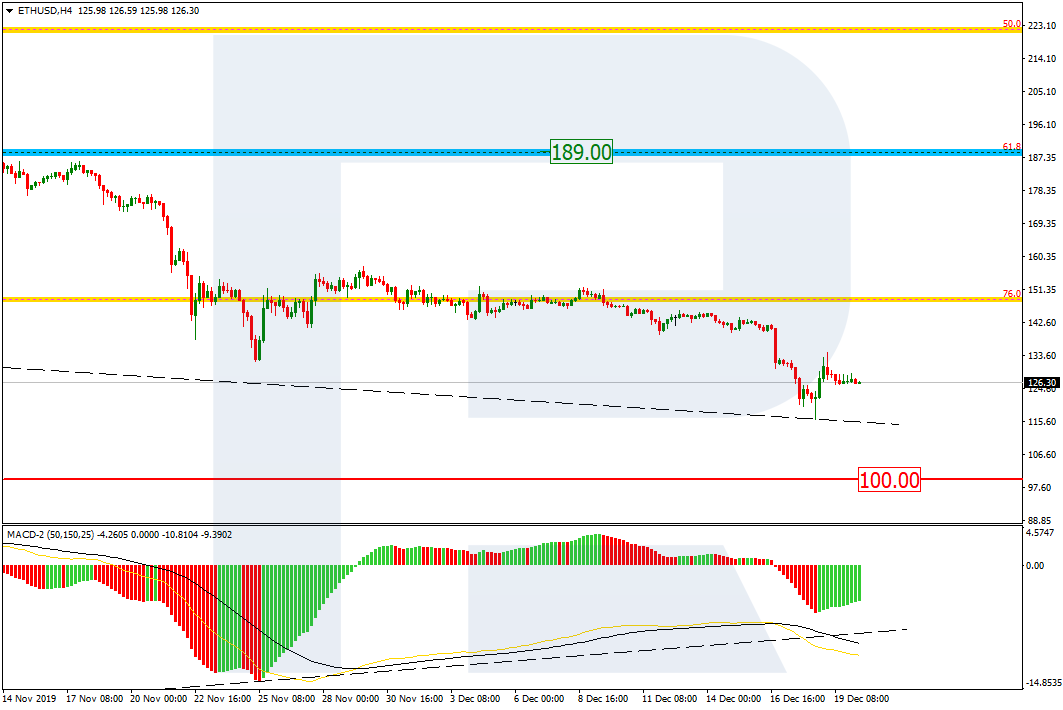
As we can see in the daily chart, the downtrend has broken 76.0% fibo; right now, ETHUSD is heading towards this year’s low at 80.86 and must break a psychologically-crucial of 100.00 on its way. The resistance is 61.8% fibo at 189.00.

ETHUSD_D1
Risk Warning: the result of previous trading operations do not guarantee the same results in the future

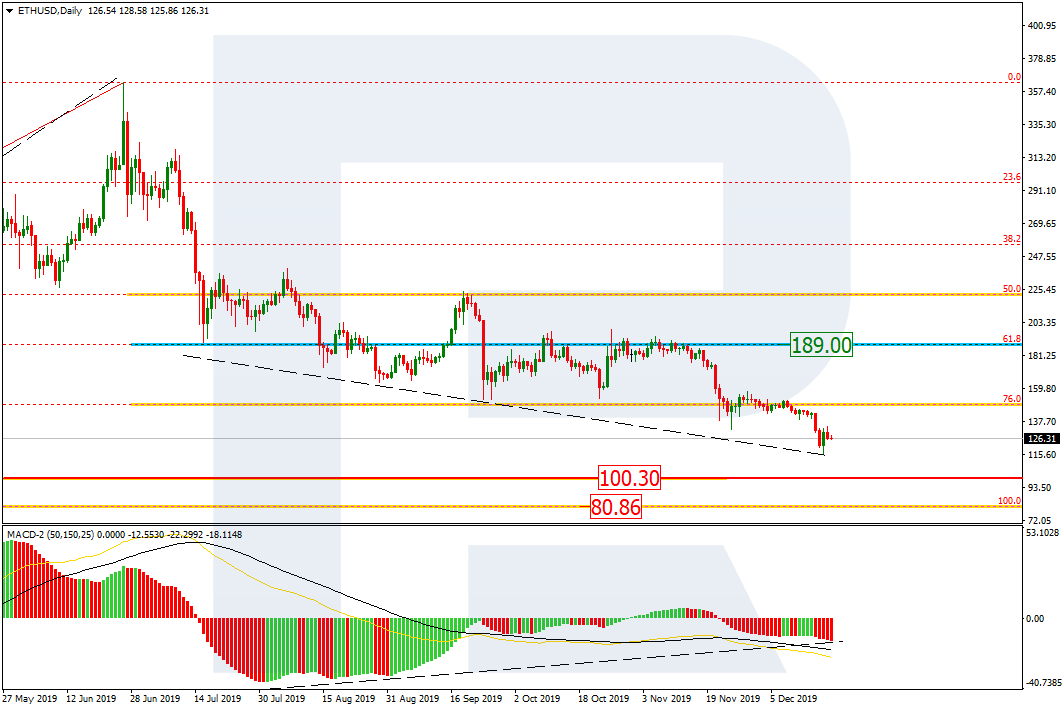
The H4 chart shows more detailed structure of the current correction, which is getting close to 100.00. At the same time, there is a convergence on MACD, which may indicate a new pullback soon.

ETHEREUM_H4

The Pound plunged to its three-weeks lows. Overview for 20.12.2019

The Pound plunged to its three-weeks lows. Overview for 20.12.2019

20.12.2019

GBPUSD remains weak despite the BoE’s stable monetary policy.

On Friday morning, the British Pound is still under pressure against the USD. The current quote for the instrument is 1.3020.

Yesterday, the December meeting of the Bank of England was over. The entire monetary policy of the British regulator remained unchanged, including the interest rate and Quantitative Easing.

In the comments, the BoE made it pretty clear that it was intending to watch the Brexit talks very closely because this topic was the key issue. In case the Brexit situation remains uncertain, the regulator’s monetary policy may require stimulus measures. That’s when the BoE is going to start interfering.

One should pay attention to the fact that the regulator revised its economic outlook for the fourth quarter of 2019 from 0.2% to 0.1%. As for inflation, it is also expected to slow down and be 1.25%, while the target is 2.0%.

Taken together, all these factors are pushing the British currency. By the way, market players are in anticipation: today the regulator may announce the name of its next governor.

Ichimoku Cloud Analysis 19.12.2019 (AUDUSD, NZDUSD, USDCAD)

Ichimoku Cloud Analysis 19.12.2019 (AUDUSD, NZDUSD, USDCAD)

19.12.2019

AUDUSD, “Australian Dollar vs US Dollar”

AUDUSD is trading at 0.6877; the instrument is moving above Ichimoku Cloud, thus indicating an ascending tendency. The markets could indicate that the price may test the cloud’s downside border at 0.6855 and then resume moving upwards to reach 0.6975. Another signal to confirm further ascending movement is the price’s rebounding from the support level. However, the scenario that implies further growth may be canceled if the price breaks the cloud’s downside border and fixes below 0.6835. In this case, the pair may continue falling towards 0.6725.

AUDUSD
Risk Warning: the result of previous trading operations do not guarantee the same results in the future

NZDUSD, “New Zealand Dollar vs US Dollar”

NZDUSD is trading at 0.6590; the instrument is moving above Ichimoku Cloud, thus indicating an ascending tendency. The markets could indicate that the price may test the cloud’s downside border at 0.6575 and then resume moving upwards to reach 0.6710. Another signal to confirm further ascending movement is the price’s rebounding from the rising channel’s downside border. However, the scenario that implies further growth may be canceled if the price breaks the cloud’s downside border and fixes below 0.6525. In this case, the pair may continue falling towards 0.6415.

NZDUSD
Risk Warning: the result of previous trading operations do not guarantee the same results in the future

USDCAD, “US Dollar vs Canadian Dollar”

USDCAD is trading at 1.3116; the instrument is moving below Ichimoku Cloud, thus indicating a descending tendency. The markets could indicate that the price may test the cloud’s downside border at 1.3145 and then resume moving downwards to reach 1.3005. Another signal to confirm further descending movement is the price’s rebounding from the descending channel’s upside border. However, the scenario that implies further decline may be canceled if the price breaks the cloud’s upside border and fixes above 1.3245. In this case, the pair may continue growing towards 1.3305.

USDCAD
Risk Warning: the result of previous trading operations do not guarantee the same results in the future

Fibonacci Retracements Analysis 19.12.2019 (AUDUSD, USDCAD)

Fibonacci Retracements Analysis 19.12.2019 (AUDUSD, USDCAD)

19.12.2019

AUDUSD, “Australian Dollar vs US Dollar”

As we can see in the H4 chart, after updating the high, AUDUSD has started a new descending correction. The support is 23.6% fibo at 0.6818. After finishing the pullback, the instrument may start one more rising wave to break the high and then reach 50.0% and 61.8% fibo at 0.6982 and 0.7057 respectively.

AUDUSD_H4
Risk Warning: the result of previous trading operations do not guarantee the same results in the future

In the H1 chart, the price is finishing the descending wave to start a new rising one. The short-term upside targets may be the high at 0.6938 and the post-correctional extension area between 138.2 and 161.8% fibo at 0.6976 and 0.7000 respectively. The local support is at 0.6838.

AUDUSD_H1
Risk Warning: the result of previous trading operations do not guarantee the same results in the future

USDCAD, “US Dollar vs Canadian Dollar”

As we can see in the H4 chart, the bearish tendency has reached 76.9% fibo. The key target is still the low at 1.3042. At the same time, there is a convergence on MACD, which indicates a possible pullback soon. The resistance is 50.0% fibo at 1.3185.

USDCAD_H4
Risk Warning: the result of previous trading operations do not guarantee the same results in the future

The H1 chart shows more detailed structure of the current descending tendency. As we can see, the pair is trading close 76.0% fibo.

USDCAD_H1

Murrey Math Lines 19.12.2019 (USDCHF, GOLD) 19.12.2019 USDCHF, “US Dollar vs Swiss Franc”

Murrey Math Lines 19.12.2019 (USDCHF, GOLD)
19.12.2019
USDCHF, “US Dollar vs Swiss Franc”

In the H4 chart, USDCHF is moving below 3/8. In this case, the price is expected to break 1/8 and continue falling to reach the support at 0/8. However, this scenario may no longer be valid if the price breaks 2/8 to the upside. After that, the instrument may continue growing towards the resistance at 5/8.

USDCHF_H4
Risk Warning: the result of previous trading operations do not guarantee the same results in the future
As we can see in the M15 chart, the pair has broken the downside line of the VoltyChannel indicator and, as a result, may continue trading downwards.

USDCHF_M15
Risk Warning: the result of previous trading operations do not guarantee the same results in the future
XAUUSD, “Gold vs US Dollar”

As we can see in the H4 chart, XAUUSD is moving above 5/8. In this case, the price may break 7/8 and continue trading upwards to reach the resistance at 8/8. However, this scenario may no longer be valid if the price breaks 6/8 to the downside. After that, the instrument may continue falling towards the support at 5/8.

GOLD_H4
Risk Warning: the result of previous trading operations do not guarantee the same results in the future
In the M15 chart, the pair may break the upside line of the VoltyChannel indicator and, as a result, continue the ascending tendency.

GOLD_M15

Forex Technical Analysis & Forecast 19.12.2019 (EURUSD, GBPUSD, USDCHF, USDJPY, AUDUSD, USDRUB, USDCAD, GOLD, BRENT, BTCUSD)

Forex Technical Analysis & Forecast 19.12.2019 (EURUSD, GBPUSD, USDCHF, USDJPY, AUDUSD, USDRUB, USDCAD, GOLD, BRENT, BTCUSD)

19.12.2019

EURUSD, “Euro vs US Dollar”

After completing the descending structure towards 1.1109 and returning to 1.1133, EURUSD is moving to test the latter level from below. According to the main scenario, the price is expected to form a new descending structure to reach 1.1100 and then resume trading upwards with the target at 1.1148.

EURUSD
Risk Warning: the result of previous trading operations do not guarantee the same results in the future

GBPUSD, “Great Britain Pound vs US Dollar”

GBPUSD is consolidating around 1.3083. Today, the pair may fall towards 1.3041 and then start a new correction with the target at 1.3300.

GBPUSD
Risk Warning: the result of previous trading operations do not guarantee the same results in the future

USDCHF, “US Dollar vs Swiss Franc”

USDCHF has rebounded from 0.9819 downwards; right now, it is falling to reach 0.9785. After that, the instrument may resume the uptrend with the first target at 0.9833.

USDCHF
Risk Warning: the result of previous trading operations do not guarantee the same results in the future

USDJPY, “US Dollar vs Japanese Yen”

USDJPY is still consolidating around 109.45 without any particular direction. Today, the pair may expand the range towards 109.70 and then start another decline to reach 109.13. Later, the market may form one more ascending structure with the target at 109.45.

USDJPY
Risk Warning: the result of previous trading operations do not guarantee the same results in the future

AUDUSD, “Australian Dollar vs US Dollar”

After forming the consolidation range below 0.6857, AUDUSD has broken it downwards. Possibly, today the pair may test this level from above and then resume moving upwards with the first target at 0.6895.

AUDUSD
Risk Warning: the result of previous trading operations do not guarantee the same results in the future

USDRUB, “US Dollar vs Russian Ruble”

USDRUB is consolidating around 62.60 without any particular direction. Possibly, today the pair may fall towards 62.25 and then start another growth to return to 62.45. Later, the market may continue trading inside the downtrend with the target at 62.02.

USDRUB
Risk Warning: the result of previous trading operations do not guarantee the same results in the future

USDCAD, “US Dollar vs Canadian Dollar”

USDCAD has failed to fix above 1.3160; right n ow, it is moving downwards. Possibly, the pair may reach 1.3087 and then form one more ascending structure with the target at 1.3130. After that, the instrument may resume falling towards 1.3073.

USDCAD
Risk Warning: the result of previous trading operations do not guarantee the same results in the future

XAUUSD, “Gold vs US Dollar”

Gold is still consolidating around 1476.16 without any particular direction. The main scenario implies that the price may expand the range towards 1481.26 and then form a new descending structure with the target at 1469.15.

GOLD
Risk Warning: the result of previous trading operations do not guarantee the same results in the future

BRENT

Brent is consolidating around 66.12. Possibly, today the pair may form a new ascending wave towards 67.07. After that, the instrument may start another decline to return to 66.12 and then continue the uptrend with the target at 68.50.

BRENT
Risk Warning: the result of previous trading operations do not guarantee the same results in the future

BTCUSD, “Bitcoin vs US Dollar”

After finishing the descending wave at 6404.00, BTCUSD has completed the ascending impulse towards 7400.00; right now, it is correcting. Possibly, the pair may form Flat pattern to reach 6800.00, at least. The first downside target is at 7033.00.

BITCOIN

The Pound continues falling. Overview for 19.12.2019

The Pound continues falling. Overview for 19.12.2019

19.12.2019

On Thursday morning, GBPUSD is moving downwards; the correction is getting deeper.

The British Pound continues falling against the USD on Thursday morning. The current quote for the instrument is 1.3081.

Investors continue following the Brexit and have concerns that the United Kingdom may leave the alliance with the “hardcore” scenario, which implies no trading conditions because it might be impossible to discuss all nuances of trade relations between the parties in 11 months of the transition period. Probably, policymakers will be able to define some key points, but not much else. That’s what is keeping market players on the edge, because it may cut the United Kingdom off the European trade routes.

Today, the Bank of England is scheduled to have its last meeting this year. The interest rate is expected to remain unchanged at 0.75%. As a rule, the British regulator is pretty conservative when it comes to making monetary decisions and prefers to take its time when applying fiscal tools. Most likely, the BoE will decide to wait and see how the Brexit procedure unravels and make decisions only after that.

In addition to that, the United Kingdom is going to report on the Retail Sales which is expected to recover by 0.3% m/m in November after losing 0.1% m/m the month before. Also, investors are expecting the CBI Realized Sales in December. It looks like the Pound is going to have a quite volatile day.

rfxsignals December 19, 2019 No Comments

DAILY FREE FOREX SIGNALS – 19-12-2019 | Форекс – Сообщество Трейдеров |إشارات الفوركس|외환 신호

GBPUSD SELL-1.30836
SL-1.31404
TP1-1.30643
TP2-1.30449

EURJPY BUY -122.023
SL-121.608
TP1-122.214
TP2-122.422

EURCHF BUY -1.09212
SL-1.08743
TP1-1.09459
TP2-1.09744

EURCAD BUY -1.46071
SL-1.45498
TP1-1.46260
TP2-1.46505

EURUSD BUY -1.11389
SL-1.11012
TP1-1.11573
TP2-1.11717

GBPCAD BUY -1.71969
SL-1.71353
TP1-1.72235
TP2-1.72463

GBPJPY BUY -143.691
SL-143.240
TP1-143.881
TP2-144.034

CADJPY SELL-83.498
SL-83.932
TP1-83.331
TP2-83.106

EURNZD BUY -1.69110
SL-1.68354
TP1-1.69326
TP2-1.69569

Ichimoku Cloud Analysis 18.12.2019 (AUDUSD, NZDUSD, USDCAD)

Ichimoku Cloud Analysis 18.12.2019 (AUDUSD, NZDUSD, USDCAD)

18.12.2019

AUDUSD, “Australian Dollar vs US Dollar”

AUDUSD is trading at 0.6849; the instrument is moving above Ichimoku Cloud, thus indicating an ascending tendency. The markets could indicate that the price may test the cloud’s downside border at 0.6840 and then resume moving upwards to reach 0.6920. Another signal to confirm further ascending movement is the price’s rebounding from the support level. However, the scenario that implies further growth may be canceled if the price breaks the cloud’s downside border and fixes below 0.6795. In this case, the pair may continue falling towards 0.6695.

AUDUSD
Risk Warning: the result of previous trading operations do not guarantee the same results in the future

NZDUSD, “New Zealand Dollar vs US Dollar”

NZDUSD is trading at 0.6563; the instrument is moving above Ichimoku Cloud, thus indicating an ascending tendency. The markets could indicate that the price may test the cloud’s upside border at 0.6555 and then resume moving upwards to reach 0.6705. Another signal to confirm further ascending movement is the price’s rebounding from the support level. However, the scenario that implies further growth may be canceled if the price breaks the cloud’s downside border and fixes below 0.6490. In this case, the pair may continue falling towards 0.6395.

NZDUSD
Risk Warning: the result of previous trading operations do not guarantee the same results in the future

USDCAD, “US Dollar vs Canadian Dollar”

USDCAD is trading at 1.3163; the instrument is moving below Ichimoku Cloud, thus indicating a descending tendency. The markets could indicate that the price may test the cloud’s downside border at 1.3185 and then resume moving downwards to reach 1.3035. Another signal to confirm further descending movement is the price’s rebounding from the descending channel’s upside border. However, the scenario that implies further decline may be canceled if the price breaks the cloud’s upside border and fixes above 1.3245. In this case, the pair may continue growing towards 1.3335.

USDCAD

Murrey Math Lines 18.12.2019 (USDJPY, USDCAD)

Murrey Math Lines 18.12.2019 (USDJPY, USDCAD)

18.12.2019

USDJPY, “US Dollar vs. Japanese Yen”

As we can see in the H4 chart, USDJPY is moving inside the “overbought area”. In this case, the price is expected to break 8/8 and then continue falling to reach the support at 6/8. However, this scenario may no longer be valid if the price breaks +1/8 to the upside. After that, the instrument may start a new growth towards the resistance at +2/8.

USDJPY_H4
Risk Warning: the result of previous trading operations do not guarantee the same results in the future

In the M15 chart, the pair may break the downside line of the VoltyChannel indicator and, as a result, continue trading downwards.

USDJPY_M15
Risk Warning: the result of previous trading operations do not guarantee the same results in the future

USDCAD, “US Dollar vs Canadian Dollar”

As we can see in the H4 chart, USDCAD is consolidating. In this case, the pair may break 4/8 and resume growing to reach the resistance at 5/8. However, this scenario may no longer be valid if the price breaks 3/8. After that, the instrument may continue falling towards the support at 2/8.

USDCAD_H4
Risk Warning: the result of previous trading operations do not guarantee the same results in the future

In the M15 chart, the pair may break the upside line of the VoltyChannel indicator and, as a result, continue moving upwards.

USDCAD_M15