Ichimoku Cloud Analysis 24.12.2019 (AUDUSD, NZDUSD, USDCAD)

Ichimoku Cloud Analysis 24.12.2019 (AUDUSD, NZDUSD, USDCAD)

24.12.2019

AUDUSD, “Australian Dollar vs US Dollar”

AUDUSD is trading at 0.6915; the instrument is moving above Ichimoku Cloud, thus indicating an ascending tendency. The markets could indicate that the price may test the cloud’s upside border at 0.6885 and then resume moving upwards to reach 0.6995. Another signal to confirm further ascending movement is the price’s rebounding from the support level. However, the scenario that implies further growth may be canceled if the price breaks the cloud’s downside border and fixes below 0.6845. In this case, the pair may continue falling towards 0.6755.
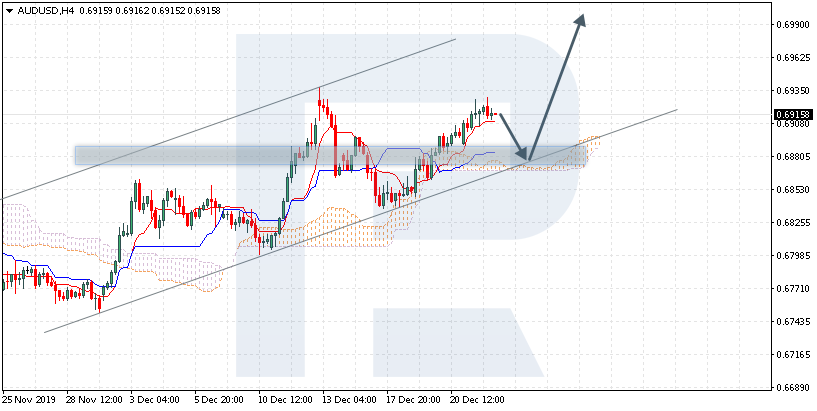
AUDUSD
Risk Warning: the result of previous trading operations do not guarantee the same results in the future

NZDUSD, “New Zealand Dollar vs US Dollar”

NZDUSD is trading at 0.6623; the instrument is moving above Ichimoku Cloud, thus indicating an ascending tendency. The markets could indicate that the price may test Tenkan-Sen and Kijun-Sen at 0.6600 and then resume moving upwards to reach 0.6710. Another signal to confirm further ascending movement is the price’s rebounding from the rising channel’s downside border. However, the scenario that implies further growth may be canceled if the price breaks the cloud’s downside border and fixes below 0.6550. In this case, the pair may continue falling towards 0.6465.
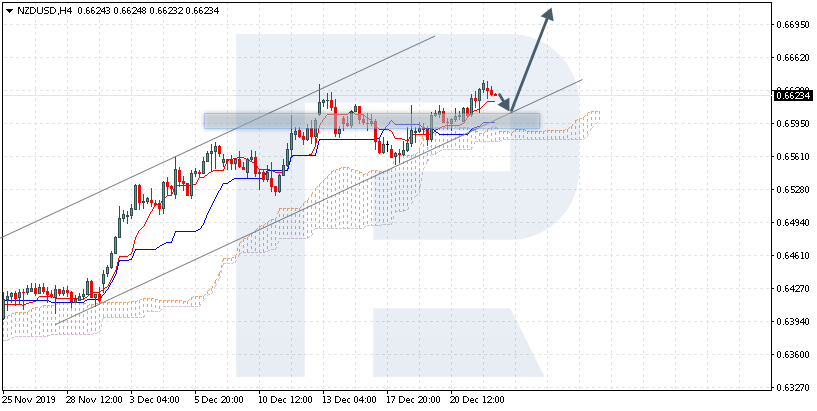
NZDUSD
Risk Warning: the result of previous trading operations do not guarantee the same results in the future

USDCAD, “US Dollar vs Canadian Dollar”

USDCAD is trading at 1.3155; the instrument is moving below Ichimoku Cloud, thus indicating a descending tendency. The markets could indicate that the price may test the cloud’s upside border at 1.3165 and then resume moving downwards to reach 1.3025. Another signal to confirm further descending movement is the price’s rebounding from the descending channel’s upside border. However, the scenario that implies further decline may be canceled if the price breaks the cloud’s upside border and fixes above 1.3220. In this case, the pair may continue growing towards 1.3305. After breaking Triangle’s downside border and fixing below 1.3110, the price may continue moving downwards.

USDCAD
Risk Warning: the result of previous trading operations do not guarantee the same results in the future

Japanese Candlesticks Analysis 24.12.2019 (GOLD, NZDUSD)

Japanese Candlesticks Analysis 24.12.2019 (GOLD, NZDUSD)

24.12.2019

XAUUSD, “Gold vs US Dollar”

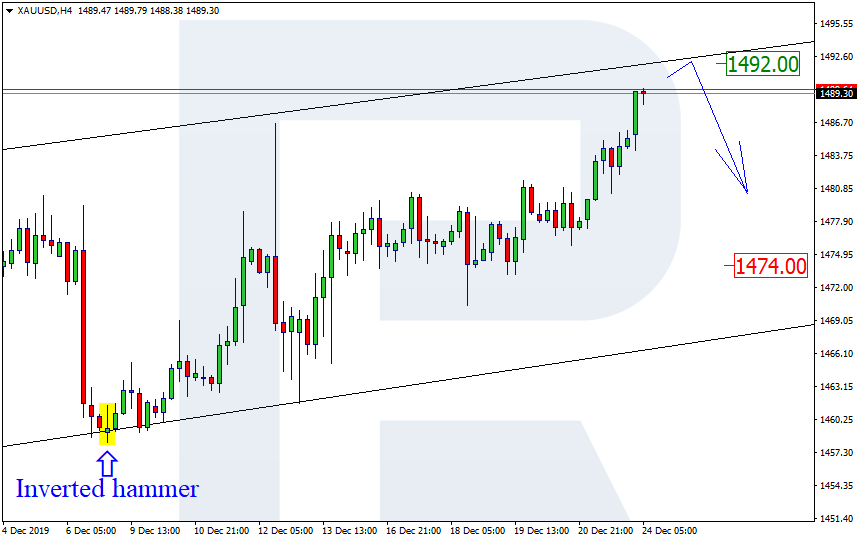
As we can see in the H4 chart, the ascending tendency continues. Right now, XAUUSD is moving to reach the rising channel’s upside border. In this case, the target is at 1492.00 where the price may form a reversal pattern. Later, the pair may start a new correction and resume falling with the target at 1474.00. At the same time, we shouldn’t exclude an opposite scenario, which implies that the instrument may continue trading upwards without any corrections.

GOLD
Risk Warning: the result of previous trading operations do not guarantee the same results in the future

NZDUSD, “New Zealand vs. US Dollar”

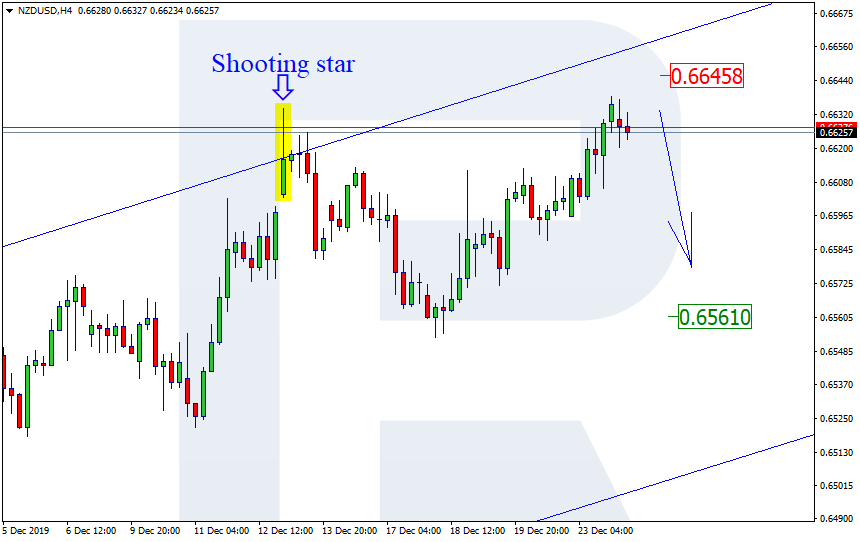
As we can see in the H4 chart, the ascending tendency continues. After forming several reversal patterns, including Shooting Star, near the channel’s upside border, NZDUSD is still trading inside the range; the downside target may be the closest support level at 0.6561. At the same time, one shouldn’t exclude an opposite scenario, according to which the instrument may update its highs and grow towards 0.6645.

NZDUSD

Forex Technical Analysis & Forecast 24.12.2019 (EURUSD, GBPUSD, USDCHF, USDJPY, AUDUSD, USDRUB, USDCAD, GOLD, BRENT, BTCUSD)

Forex Technical Analysis & Forecast 24.12.2019 (EURUSD, GBPUSD, USDCHF, USDJPY, AUDUSD, USDRUB, USDCAD, GOLD, BRENT, BTCUSD)

24.12.2019

EURUSD, “Euro vs US Dollar”

After finishing the first ascending impulse along with the correction at 1.1070, EURUSD is forming the second one. Possibly, the pair may consolidate around 1.1091. If later the price breaks this range to the upside, the market may resume moving upwards to break 1.1099 and then continue growing with the short-term target at 1.1126.

EURUSD
Risk Warning: the result of previous trading operations do not guarantee the same results in the future

GBPUSD, “Great Britain Pound vs US Dollar”

After completing the first ascending impulse along with the correction at 1.2919, GBPUSD is forming the second one. Today, the pair may reach 1.2983 and then start a new correction towards 1.2930. Later, the market may resume moving upwards with the target at 1.3030.

GBPUSD
Risk Warning: the result of previous trading operations do not guarantee the same results in the future

USDCHF, “US Dollar vs Swiss Franc”

USDCHF continues growing towards 0.9838. After that, the instrument may start another correction with the target at 0.9803.

USDCHF
Risk Warning: the result of previous trading operations do not guarantee the same results in the future

USDJPY, “US Dollar vs Japanese Yen”

USDJPY is still consolidating around 109.42 without any particular direction; right now, it is correcting inside Flag pattern with the target at 109.14. After that, the instrument may form one more ascending structure to reach to 109.84.

USDJPY
Risk Warning: the result of previous trading operations do not guarantee the same results in the future

AUDUSD, “Australian Dollar vs US Dollar”

AUDUSD is still growing with the target at 0.6944, at least. Later, the market may form a new descending structure to break 0.6892 and then resume moving downwards with the first target at 0.6857.

AUDUSD
Risk Warning: the result of previous trading operations do not guarantee the same results in the future

USDRUB, “US Dollar vs Russian Ruble”

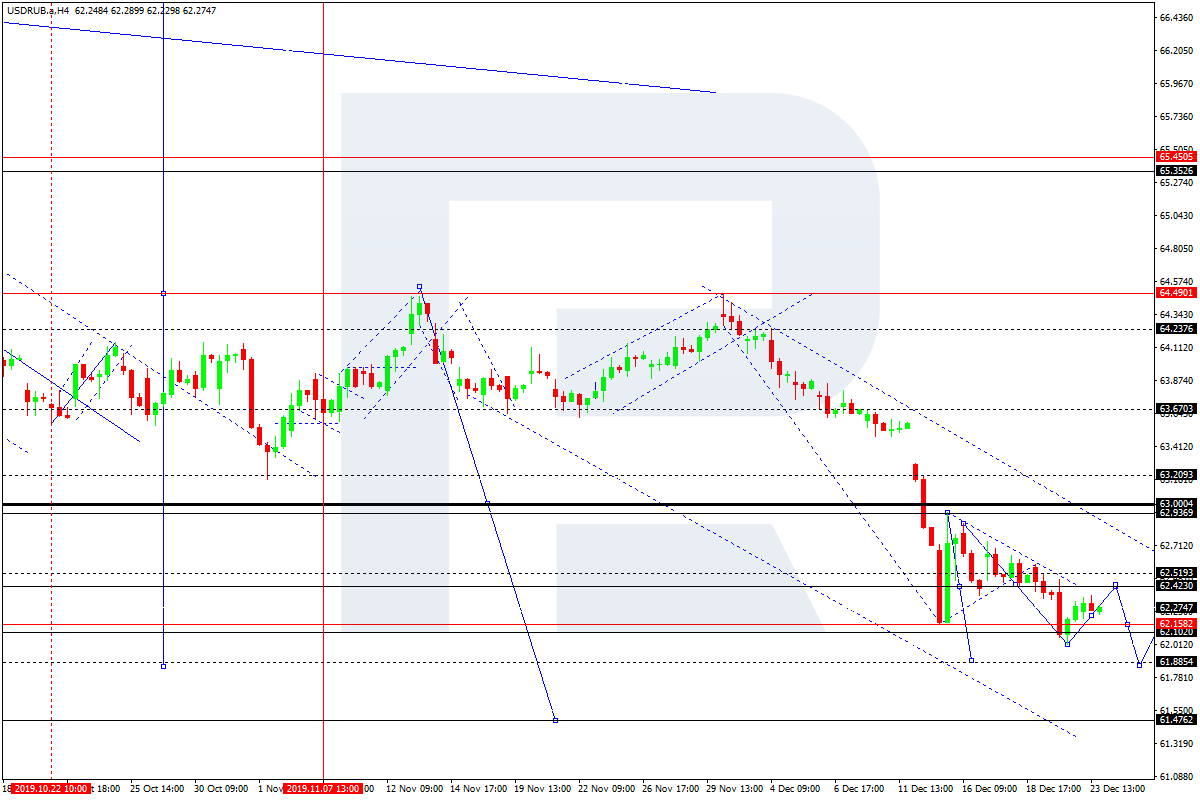
USDRUB is correcting towards 62.42. Later, the market may resume trading inside the downtrend with the target at 61.88.

USDRUB
Risk Warning: the result of previous trading operations do not guarantee the same results in the future

USDCAD, “US Dollar vs Canadian Dollar”

USDCAD has finished the descending impulse towards 1.3136 along with the correction at 1.3157, thus forming a new consolidation range. If later, the price breaks this range to the upside at 1.3160, the market may start another growth with the target at 1.3185; if to the downside at 1.3135 – resume falling to reach 1.3104.

USDCAD
Risk Warning: the result of previous trading operations do not guarantee the same results in the future

XAUUSD, “Gold vs US Dollar”

Gold continues trading upwards; it has reached 1488.68 to return to the downside continuation pattern. The main scenario implies that the price may form a new descending structure with the first target at 1477.33.

GOLD
Risk Warning: the result of previous trading operations do not guarantee the same results in the future

BRENT

Brent has returned to 66.20; right now, it is consolidating around it. According to the main scenario, the price is expected to continue forming the third ascending wave towards 67.07.

BRENT
Risk Warning: the result of previous trading operations do not guarantee the same results in the future

BTCUSD, “Bitcoin vs US Dollar”

After finishing the ascending wave at 7600.00, BTCUSD has completed the descending impulse towards 7350.00; right now, it is forming a downside continuation pattern with the target at 6999.00. After that, the instrument may grow to break 7350.00 and then continue moving upwards with the first target at 8200.00.

BITCOIN
Risk Warning: the result of previous trading operations do not guarantee the same results in the future

The Pound updated its three weeks lows. Overview for 24.12.2019

The Pound updated its three weeks lows. Overview for 24.12.2019

24.12.2019

GBPUSD stopped falling, but remains week.

The British Pound slowed down its decline against the USD on Tuesday. The current quote for the instrument is 1.2944.

This week, there will be no important statistics for the British Pound: today it’s Christmas eve, tomorrow – Christmas itself, that’s why British markets will be closed until Thursday.

However, market players are really concerned about the Brexit. At the moment, when the Conservative Party and the country’s Prime Minister Boris Johnson are “set loose” in making the Brexit decisions, chances of the “hardcore” exiting scenario are rising. It means that the United Kingdom may exit the European Union until January 31st, 2020 without caring whether it has a trade agreement with the alliance or not. Euphoria was quickly replaced by routine, because Tory may really ignore common sense in favor of completing the Brexit as soon as possible. In the meantime, investors are pretty clear-eyed about the risks and see all possible problems that may follow the exiting procedure.

What exactly alerted them? The fact that the British policymakers insist on a special article in the Brexit agreement that makes the English judicial law dominating over the European one. The alliance may not agree to it and Johnson may jeopardize the talks and threaten to exit the Union without the agreement.

Under such conditions, the Pound may remain under pressure for a long time, which prevents it from getting back to 1.30.

rfxsignals December 24, 2019 No Comments

DAILY FREE FOREX SIGNALS – 24-12-2019 | Форекс – Сообщество Трейдеров |إشارات الفوركس|외환 신호

USDCHF BUY -0.98256
SL-0.97895
TP1-0.98411
TP2-0.98564

EURAUD BUY -1.60371
SL-1.59978
TP1-1.60571
TP2-1.60816

AUDJPY SELL-75.621
SL-76.032
TP1-75.428
TP2-75.248

USDCAD BUY -1.31591
SL-1.31172
TP1-1.31771
TP2-1.31983

CADJPY SELL-83.121
SL-83.432
TP1-82.943
TP2-82.795

EURCAD BUY -1.45908
SL-1.45534
TP1-1.46126
TP2-1.46379

AUDUSD SELL-0.69130
SL-0.69579
TP1-0.68962
TP2-0.68734

NZDUSD SELL-0.66245
SL-0.66553
TP1-0.66088
TP2-0.65900

Ichimoku Cloud Analysis 23.12.2019 (AUDUSD, NZDUSD, USDCAD)

Ichimoku Cloud Analysis 23.12.2019 (AUDUSD, NZDUSD, USDCAD)

23.12.2019

AUDUSD, “Australian Dollar vs US Dollar”

AUDUSD is trading at 0.6903; the instrument is moving above Ichimoku Cloud, thus indicating an ascending tendency. The markets could indicate that the price may test the cloud’s upside border at 0.6875 and then resume moving upwards to reach 0.6975. Another signal to confirm further ascending movement is the price’s rebounding from the support level. However, the scenario that implies further growth may be canceled if the price breaks the cloud’s downside border and fixes below 0.6845. In this case, the pair may continue falling towards 0.6755.

AUDUSD
Risk Warning: the result of previous trading operations do not guarantee the same results in the future

NZDUSD, “New Zealand Dollar vs US Dollar”

NZDUSD is trading at 0.6602; the instrument is moving above Ichimoku Cloud, thus indicating an ascending tendency. The markets could indicate that the price may test the cloud’s upside border at 0.6590 and then resume moving upwards to reach 0.6695. Another signal to confirm further ascending movement is the price’s rebounding from Triangle’s downside border. However, the scenario that implies further growth may be canceled if the price breaks the cloud’s downside border and fixes below 0.6550. In this case, the pair may continue falling towards 0.6465. After breaking Triangle’s upside border and fixing above 0.6625, the price may continue moving upwards.

NZDUSD
Risk Warning: the result of previous trading operations do not guarantee the same results in the future

USDCAD, “US Dollar vs Canadian Dollar”

USDCAD is trading at 1.3158; the instrument is moving below Ichimoku Cloud, thus indicating a descending tendency. The markets could indicate that the price may test the cloud’s upside border at 1.3185 and then resume moving downwards to reach 1.3030. Another signal to confirm further descending movement is the price’s rebounding from the descending channel’s upside border. However, the scenario that implies further decline may be canceled if the price breaks the cloud’s upside border and fixes above 1.3225. In this case, the pair may continue growing towards 1.3305.

USDCAD

Japanese Candlesticks Analysis 23.12.2019 (EURUSD, USDJPY)

Japanese Candlesticks Analysis 23.12.2019 (EURUSD, USDJPY)

23.12.2019

EURUSD, “Euro vs. US Dollar”

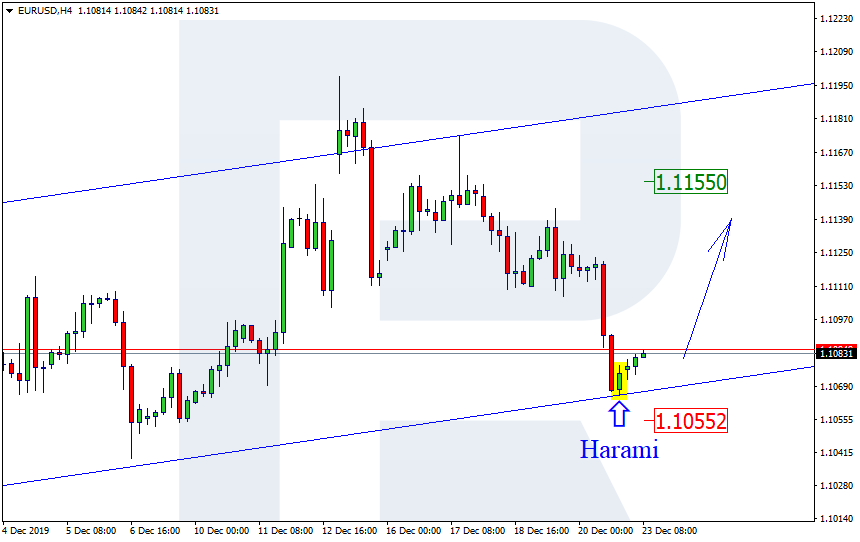
As we can see in the H4 chart, the ascending channel continues. Aby now, EURUSD has formed Harami reversal pattern close to the channel’s downside border. We may assume that later the price may test the support level and get back to 1.1155 to continue the ascending tendency. However, one shouldn’t exclude a possibility that the price may continue falling towards 1.1055.

EURUSD
Risk Warning: the result of previous trading operations do not guarantee the same results in the future

USDJPY, “US Dollar vs. Japanese Yen”

As we can see in the H4 chart, the pair continues trading in the middle of the rising channel. It has completed Hanging Man pattern and right now is reversing. Later USDJPY may resume falling towards 108.88 to test the downside border. At the same time, the pair may choose another scenario and start a new growth to reach 109.06.

USDJPY

Fibonacci Retracements Analysis 23.12.2019 (GOLD, USDCHF)

Fibonacci Retracements Analysis 23.12.2019 (GOLD, USDCHF)

23.12.2019

XAUUSD, “Gold vs US Dollar”

As we can see in the H4 chart, XAUUSD continues the correctional uptrend towards 38.2% fibo at 1488.16. After breaking this level, the pair may continue growing to reach 50.0% and 61.8% fibo at 1501.30 and 1514.30 respectively. After completing the correction, the instrument may break the local low at 1445.60 and continue falling towards its mid-term target, which is 50.0% fibo at 1413.85.

GOLD_H4
Risk Warning: the result of previous trading operations do not guarantee the same results in the future

In the H1 chart, after falling towards 61.8% fibo at 1461.34, the pair is forming a pullback towards the local high at 1486.69. If the instrument fails to break the high, the next descending wave will be heading towards 76.0% fibo at 1455.50.

GOLD_H1
Risk Warning: the result of previous trading operations do not guarantee the same results in the future

USDCHF, “US Dollar vs Swiss Franc”

In the H4 chart, the convergence made the pair complete the descending correctional wave at 61.8% fibo. To confirm a new rising impulse, USDCHF must break the resistance at 50.0% fibo (0.9844). After breaking this level and fixing above it, the price may grow towards the high at 1.0028. However, if the pair choose to continue falling towards 76.0% at 0.9748, it may reach the low at 0.9660 very quickly.

USDCHF_H4
Risk Warning: the result of previous trading operations do not guarantee the same results in the future

As we can see in the H1 chart, the convergence made USDCHF start a new growth, which has already reached 23.6% fibo. The next upside targets are 38.2 and 50.0% % fibo at 0.9867 and 0.9897 respectively. The support is the low at 0.9770.

USDCHF_H1

Forex Technical Analysis & Forecast 23.12.2019 (EURUSD, GBPUSD, USDCHF, USDJPY, AUDUSD, USDRUB, USDCAD, GOLD, BRENT, BTCUSD)

Forex Technical Analysis & Forecast 23.12.2019 (EURUSD, GBPUSD, USDCHF, USDJPY, AUDUSD, USDRUB, USDCAD, GOLD, BRENT, BTCUSD)

23.12.2019

EURUSD, “Euro vs US Dollar”

After reaching the key correctional target at 1.1066, EURUSD is forming a new ascending wave towards 1.1099. After that, the instrument may resume falling to reach 1.1083 and then start another growth with the target at 1.1132.

EURUSD
Risk Warning: the result of previous trading operations do not guarantee the same results in the future

GBPUSD, “Great Britain Pound vs US Dollar”

GBPUSD has reached another downside target at 1.2980; right now, it is moving upwards to reach 1.3028. Later, the market may form a new descending structure with the target at 1.2920.

GBPUSD
Risk Warning: the result of previous trading operations do not guarantee the same results in the future

USDCHF, “US Dollar vs Swiss Franc”

After completing the ascending impulse at 0.9832, USDCHF is correcting towards 0.9802. After that, the instrument may start a new growth with the target at 0.9836.

USDCHF
Risk Warning: the result of previous trading operations do not guarantee the same results in the future

USDJPY, “US Dollar vs Japanese Yen”

USDJPY is consolidating around 109.42; right now, it is forming Triangle pattern with the target at 109.14. Later, the market may form one more ascending structure towards 109.84.

USDJPY
Risk Warning: the result of previous trading operations do not guarantee the same results in the future

AUDUSD, “Australian Dollar vs US Dollar”

AUDUSD is growing towards 0.6945. After that, the market may start a new correction to reach 0.6899 and then resume moving upwards with the target at 0.6959.

AUDUSD
Risk Warning: the result of previous trading operations do not guarantee the same results in the future

USDRUB, “US Dollar vs Russian Ruble”

After reaching 62.02, USDRUB is growing to reach 62.42. Possibly, the pair may test this from below and rebound from it. Later, the market may resume trading inside the downtrend with the target at 61.88.

USDRUB
Risk Warning: the result of previous trading operations do not guarantee the same results in the future

USDCAD, “US Dollar vs Canadian Dollar”

USDCAD has finished the ascending impulse towards 1.3171; right now, it is correcting to reach 1.3134. Possibly, the pair may reach this level and then form one more ascending structure towards 1.3157, thus forming a new consolidation range. If later, the price breaks this range to the upside, the market may start another growth with the target at 1.3200; if to the downside – resume falling to reach 1.3111.

USDCAD
Risk Warning: the result of previous trading operations do not guarantee the same results in the future

XAUUSD, “Gold vs US Dollar”

Gold is moving upwards. Possibly, the pair may expand the range up to 1484.33 and then form a new descending structure with the target at 1477.33.

GOLD
Risk Warning: the result of previous trading operations do not guarantee the same results in the future

BRENT

Brent is correcting towards 65.44. Today, the pair may reach it and then form one more ascending structure to break 66.60. After that, the instrument may continue the uptrend with the target at 67.75.

BRENT
Risk Warning: the result of previous trading operations do not guarantee the same results in the future

BTCUSD, “Bitcoin vs US Dollar”

BTCUSD is moving upwards; it has formed an upside continuation pattern at 7355.00. Possibly, today the pair may test this level from above and then resume growing with the short-term target at 7688.00. Later, the market may start a new correction to return to 7355.00 and then resume the uptrend with the key target is at 8280.00.

BITCOIN

The USD was supported by strong numbers. Overview for 23.12.2019

The USD was supported by strong numbers. Overview for 23.12.2019

23.12.2019

On Monday morning, the major currency pair is trying to correct after last Friday’s decline, but market players are very cautious.

EURUSD is growing a little bit on Monday morning. The current quote for the instrument is 1.1084.

Reports published last Friday turned out to be very positive for the American currency. First of all, it’s the final GDP reading in the third quarter of 2019, which showed the same 2.1% q/q as expected without any surprise.

The Personal Income showed +0.5% m/m in November after adding 0.1% m/m in the previous month and against the expected reading of +0.3% m/m. The Personal Spending, in its turn, was +0.4% m/m after being +0.3% m/m the month before. Improvement of both these indicators is very positive for the country’s economy in general and the Retail Sales index, which may be affected by them and skyrocket.

The Revised University of Michigan Consumer Sentiment increased up to 99.3 points in December, which is the highest reading since this May. By the way, in November the indicator was 96.8 points, while the expected reading was 99.2 points. The components of the report show that the Current Conditions went from 111.6 points in November to 115.5 points this month, while the Consumer Expectations increased from 87.3 points to 88.9 points over the same period of time.

The Inflation Expectations reduced to 2.3%, the lowest reading over three years.