rfxsignals October 7, 2025 No Comments

Tamil Guide: What Is a Pip in Forex?

Tamil Guide: What Is a Pip in Forex?

பிப் (Pip) என்றால் என்ன? — தமிழ் வழிகாட்டி

படித்துக்கொள்ள நேரம்: ~8–10 நிமிடம் • Updated:

ஃபோரெக்ஸ் வர்த்தகத்தில் "பிப்" என்பது சிறந்த அடிப்படை அளவுகோல். இது ஒரு நாணய ஜோடியின் விலை மாற்றத்தின் மிகச் சிறிய அலகாக செயல்படுகிறது. இந்த கட்டுரையில் நாம் பிப் என்ன, அதன் மதிப்பு எப்படி கணக்கிடுவது, பல உதாரணங்கள், மற்றும் வர்த்தகத்தில் இதைப் பயன்படுத்துவதற்கான நடைமுறை டிப்ஸ் அனைத்தையும் தமிழ் Language-ல் தெளிவாக பார்க்கப் போகிறோம்.

WhatsApp-ல் மாற்று Telegram சேரவும்
மேலும் முழுமையான கையேடு வேண்டும்?
தொடர்பு கொள்ளுங்கள்

பிப் என்ற சொல்லின் அடிப்படை விளக்கம்

"Pip" என்பதன் முழுப் பெயர் "Percentage in Point" அல்லது "Price Interest Point" என்று சிலர் வர்ணிக்கிறார்கள் — ஆகையால் அது விலையில் ஏற்படும் மிகச் சிறிய மாறுதலை குறிக்கிறது. பெரும்பாலான நாணய ஜோடிகளில் பிப் என்பது நான்காம் தசம இடம் (0.0001) ஆகும். உதாரணமாக EUR/USD 1.1050 → 1.1051 ஆக உயரின் போது அது 1 பிப் உயர்வு ஆகும்.

எதிர்பாராத விதங்களில் வேறுபாடுகள் (JPY போன்ற ஜோடிகள்)

சில ஜோடிகள், குறிப்பாக ஜப்பான் யென் (JPY) அடிப்படையிலான ஜோடிகள், இரண்டு தசம இடங்களில் (0.01) பிப் அளவாகக் குறிப்பிடப்படுகின்றன. உதாரணம்: USD/JPY 110.25 → 110.26 => இது 1 பிப் ஆகும்.

பிப் மதிப்பு (Pip Value) எப்படி கணக்கிடுவர்?

பிப் மதிப்பு என்பது ஒரு பிப் மாற்றம் உங்கள் கணக்குக்கான நாணய மதிப்பில் எவ்வளவு பணம் என்று குறிப்பிடும். இது உங்கள் லாட் சைஸ் மற்றும் ஜோடிக்கு ஏற்ப மாறும். அடிப்படை சூத்திரம் — சராசரி எண்ணிக்கையாக:

Pip Value = (0.0001 / Current Exchange Rate) × Lot Size × Contract Size

பொதுவாக стандарт lot = 100,000 base units. மிக எளிதான உதாரணம் கீழே:

உதாரணம் 1 — EUR/USD

நீங்கள் 1 standard lot (100,000 EUR) வெளியாக EUR/USD 1.1000 இல் கொண்டிருந்தீர்கள். 1 பிப் (0.0001) மாற்றம் = 0.0001 × 100,000 = 10 USD. அதாவது ஒவ்வொரு பிப் மாற்றத்திற்கும் $10 ஆகும்.

உதாரணம் 2 — USD/INR (INR கணக்கில்)

இந்திய டிரேடருக்கு உதவியாக, USD/INR போல ஒரு ஜோடியில் பிப் மதிப்பு ரூபாயில் எப்படி இருக்கும் என்பதை தெரிந்து கொள்வோம். فرضித்தல்: USD/INR = 83.5000. ஒரு இலவச standard lot = 100,000 USD என்று எடுத்தால், 1 பிப் (0.01 அல்லது 0.0001? ) — INR ஜோடிகளின் decimals broker ஒவ்வொரு முறையும் வேறுபடலாம்; பொதுவாக USD/INR இல் 0.0001 என்பது 0.0001 × 100,000 = 10 USD ≈ 835 INR (உதாரணம் மட்டும்). ஆனால் நீங்கள் சிறிது கவனமாக, broker தரவின் அடிப்படையில் pip definition-ஐ சரிபார்க்கவேண்டும்.

லைவ் கணக்கீட்டு டிப்ஸ் — உங்கள் கணக்கிற்காக மதிப்பு (Practical)

  • உங்கள் broker-ன் contract specifications (pip definition & contract size) ஐ சரிபார்க்கவும்.
  • நீங்கள் micro lot (0.01) அல்லது mini lot (0.1) பயன்படுத்தினால் பிப் மதிப்பு இவை proportionally குறையும்.
  • உங்கள் கணணியில் பிப் மதிப்பை தானாகக் கணக்கிடும் சிறிய calculator (spreadsheet அல்லது ஆப்லைன் tool) வைத்துக்கொள்ளுங்கள்.

பிப்-அனைத்து பயன்படுத்துவதன் பயன் — நிதி நிர்வாகம், லைவ் ஆப்டர்

பிப் அமைப்பை புரிந்துகொள்வது position sizing, stop-loss மற்றும் take-profit அமைப்பிற்கு அவசியம். நீங்கள் எவ்வளவு ரிஸ்க் (உதாரணம்: 1% account) எடுத்தால், அந்த ரிஸ்கை பிப்-ஆக எப்படி மாற்றுவது என்பது முக்கியம் — அதை வைத்து lot size தீர்மானிக்கலாம்.

வணிக உதாரணம் — SL மற்றும் TP அமைப்பு

நீங்கள் EUR/USD இல் 50 பிப் Stop Loss யுடன் position எடுத்தீர்கள் என்று வைத்துக்கொள்ளலாம். ஒவ்வொரு பிப் மதிப்பும் $1 ஆக இருந்தால் (micro lot பொதுவாக), மொத்த ரிஸ்க் = $50. இதை உங்கள் risk-percentage விதியுடன் ஒப்பிட்டு lot தேர்வு செய்யவும்.

பிப்ஸ், பிப்ஸ்கள் மற்றும் பிபெட்டுகள் (Pips, Pips & Pipettes)

சில பிளாட்ஃபாரங்கள் pip இன் fractional பகுதியாக pipette (1/10 of a pip) ஐ காட்டுகின்றன. உதாரணம்: EUR/USD 1.10503 — இங்கு 3 означает pipettes. இது சிறு ஸ்கால்பிங் போன்ற போது நுணுக்கமான execution க்கு பயனுள்ளதாக இருக்கும்.

FAQ — சாதாரண கேள்விகள்

1. எல்லா ஜோடிக்கும்தான் பிப் மாற்றமா ஒரே மாதிரி இருக்கும்?

இல்லை. JPY என்றோ சில exotics என்றோ decimals வேறுபடும் — broker documentation-ஐப் பார்க்க வேண்டும்.

2. இண்டியா based trader-க்கு பிப் முக்கியமா?

மிகவும். குறிப்பாக USD/INR, EUR/INR போன்ற ஜோடிகளில் pip மாற்றம் நேரடி ரூபாய் மதிப்பை பாதிக்கிறது — அதனால் position sizing மற்றும் risk control இங்கே முக்கியம்.

SEO-friendly internal & external linking strategy

இந்த பதிவை உங்கள் வலைத்தளத்திலுள்ள தொடர்புடைய கட்டுரைகளுடன் இணைக்கவும் மற்றும் அதிகாரப்பூர்வ வெளியீடுகளுக்கு வெளிச்சம் விடவும்:

சுருக்கம் — முக்கிய takeaways

  • பிப் என்பது Forex-இல் விலையில் மிகச் சிறிய மாற்றம் — பெரும்பாலும் 0.0001 (அல்லது JPY க்கு 0.01).
  • பிப் மதிப்பு lot size, pair, மற்றும் account currency அடிப்படையில் மாறும்.
  • பிப்-ஐ புரிந்துகொள்வது risk management மற்றும் சரியான lot-sizing-க்கு முக்கியம்.
#Forex#Pip#USDINR#TradingTamil
rfxsignals October 7, 2025 No Comments

How to Set Stop Loss and Take Profit in MT4

How to Set Stop Loss and Take Profit in MT4

How to Set Stop Loss and Take Profit in MT4 — A Practical & Repeatable Method

Reading time: ~9–11 mins • Updated:

Correct stop loss (SL) and take profit (TP) placement turns a guess into a plan. In this guide you’ll learn how to calculate SL and TP using volatility, ATR, support & resistance, and risk-percentage rules — then how to place them in MetaTrader 4 (MT4) and use trailing stops, OCO logic and platform features to manage trades professionally.

Quick summary — what you’ll learn

  • Step-by-step MT4 placement of Stop Loss and Take Profit
  • How to calculate SL/TP with ATR, S/R, and % risk
  • Trailing stop methods, OCO setups, and broker considerations

Why SL and TP are not optional

Discipline is defined by rules. A stop loss limits downside and defines trade risk; a take profit defines reward and stops emotional greed. Without SL/TP you trade with an undefined loss potential and are more likely to make impulsive decisions.

How to decide SL — 4 practical methods

Choose a method that fits your strategy and time frame. Below are four widely used, tested approaches.

1) Risk-percentage (money management) method

Decide the % of your equity you will risk per trade (e.g., 0.5–1%). Convert that money risk into pips using position size calculator to get the SL distance. This method ensures consistency across trades.

2) ATR (Average True Range) volatility method

ATR measures recent volatility. A common rule: set SL at 1.0–1.5 × ATR(14) for your timeframe. ATR adapts to changing market conditions and prevents stops that are too tight in choppy markets.

3) Structure-based (Support/Resistance) method

Place SL beyond a clear structure (swing low/high or order block). For example, for a long trade place SL a few pips below the last swing low or the lower wick of a bullish rejection candle.

4) Time-based / session-aware method

During high-volatility events consider wider stops (using ATR) or avoid trades. For session-specific trading (e.g., London open), place stops based on recent session highs/lows.

How to calculate TP — common approaches

Take profit should be aligned with your SL so you maintain a favorable risk-to-reward (R:R). Common approaches:

  • Fixed R:R: 1:2 or 1:3 depending on your win-rate.
  • Structure targets: next S/R level, fibonacci extension, or pivot points.
  • Volatility target: set TP at a multiple of ATR (e.g., 2×ATR) when trading momentum.
  • Partial take & trail: take partial profits at first target and trail the rest with an ATR-based trailing stop.

Putting it together: example calculation (step-by-step)

Example: Account ₹100,000, risk 0.5% = ₹500. Trading EUR/USD, account currency in INR — calculate value per pip for chosen lot, then determine SL pips allowed by risk. Suppose 1 mini lot equals ₹70/pip; max SL = ₹500 / 70 ≈ 7 pips. Use ATR or structure to validate — if ATR(15min) = 12 pips, 7 pips is too tight → reduce size (smaller lot) or avoid the trade.

How to place SL & TP in MT4 (step-by-step)

Placing SL/TP when opening a new order

  1. Open MT4 → New Order (F9) or click the market watch pair then "New Order".
  2. In the order window set "Volume" (lot size).
  3. For Market Execution set Stop Loss and Take Profit fields before clicking "Buy" or "Sell". You can type absolute prices or pip offsets (on some brokers).
  4. Click "Buy" or "Sell" — SL & TP will be registered with the order on the server (check "Trade" tab for confirmation).

Adding or modifying SL/TP on an open position

  1. Open "Terminal" (Ctrl+T) → "Trade" tab → right-click on the trade → click "Modify or Delete Order".
  2. Enter new Stop Loss and/or Take Profit price levels (you can drag the order line on the chart if your broker supports chart editing).
  3. Click "Modify" to send the update to the broker. Verify the change on the "Trade" tab.

Using chart drag (quick method)

On many MT4 installs you can drag the SL/TP lines on the chart: left-click the order line, drag the stop or target to the desired price and release. Confirm by checking the Trade tab.

Trailing stops in MT4

MT4 has a built-in "Trailing Stop" function that runs on your terminal (not server-side) — it requires your MT4 to be running. To enable: right-click the trade in the "Terminal → Trade" tab → Trailing Stop → choose a distance. For server-side trailing stops or advanced rules use an Expert Advisor (EA).

OCO logic and advanced order management

MT4 does not natively support server-side OCO (One Cancels Other) for all brokers. Many traders use EAs or VPS-based scripts that place paired orders (stop-entry and limit-entry) and automatically cancel the other when one activates. If your strategy relies on OCO, test the EA thoroughly in a demo account.

Broker & platform considerations

  • Confirm minimum SL distance required by broker (some brokers enforce minimum pip distance from market price).
  • Check whether your broker stores SL/TP server-side — this protects you if your MT4 terminal disconnects.
  • Account currency matters for pip-value and position sizing calculations — use MT4 calculators or spreadsheet templates.

Practical tips & best practices

  • Always calculate position size after deciding SL — risk then size, never size then risk.
  • Avoid arbitrary round-number stops; base them on structure or volatility.
  • Use partial profits to lock gains and reduce psychological stress on large swings.
  • Journal every trade: entry, SL, TP, size, R:R, and outcome — iterate on rules.

Backtesting & demo testing

Before applying rules live, backtest SL/TP rules on historical data and forward-test in a demo account. Timeframes and pairs behave differently; what works for EUR/USD 15m may not suit USD/INR or exotics.

SEO-friendly internal & external linking strategy

To help SEO and user navigation, link this article to related pages on your site and cite authoritative external sources:

Final checklist — before you click BUY or SELL

  1. Have a clear SL based on ATR or structure and a TP that maintains desirable R:R.
  2. Calculate lot size from risk, not the other way around.
  3. Verify broker minimum SL distance and whether SL is server-side.
  4. Use partials or trailing stops to manage winners and protect profits.
#MT4#StopLoss#TakeProfit#Forex
rfxsignals October 7, 2025 No Comments

What Is Slippage and How to Avoid It

What Is Slippage and How to Avoid It

What Is Slippage and How to Avoid It — Practical Guide for Forex Traders

Reading time: ~8–10 mins • Updated:

Slippage is the difference between the expected price of a trade and the price at which it is actually executed. It is a hidden cost that eats into your returns if unchecked. This guide explains why slippage happens, how to measure it, real forex examples, and 12 practical ways to reduce or avoid slippage — especially useful for Indian traders and those trading INR pairs.

Chat on WhatsApp Join our Telegram
Want execution rules for your account?
View services

What is slippage? — the simple definition

Slippage occurs when the execution price differs from the price you saw or requested. If you place a buy order at 1.2000 and it fills at 1.2005, you experienced 0.5 pip (or 0.0005) of slippage. Slippage can be negative (you receive a worse price) or positive (you get a better price).

Why slippage happens — core causes

  • Market volatility: fast moves during news events or open/close sessions create large price swings and rapid quote changes.
  • Low liquidity: thin order books (e.g., exotic pairs or off-hours) mean large market orders move the price materially.
  • Order type: market orders execute immediately at available prices and are more prone to slippage than limit or stop-entry orders.
  • Broker execution model: some brokers aggregate liquidity poorly, have slow routing, or re-quote during high volatility.
  • Latency: delays between you clicking trade and the broker receiving it can cause the market to move.

Types of slippage — practical perspective

Consider two common scenarios:

1. Execution slippage (market fills)

Market orders fill at the best available price. If liquidity is thin beyond the best quote, the order "walks the book" and fills at worse successive prices.

2. Re-quote/failed fill slippage

Some brokers detect price movement and either re-quote for your approval or reject the trade, effectively causing opportunity cost or forcing a worse price.

How to measure slippage (simple metrics)

Two useful numbers to track:

  • Average slippage per trade: sum(all executed price - requested price) / number of trades.
  • Slippage as % of average spread: helps you see whether slippage is small relative to transaction cost.

Keep a spreadsheet tracking time, pair, order type, requested price, executed price, spread at execution, and remarks.

Real forex examples (illustrative)

- You place a market buy on EUR/USD at 1.0800; during a news spike the best available prices become 1.0802 and 1.0807, your order partially fills at those prices — slippage = up to 0.7 pip.
- You place a large market sell on USD/INR during thin India session and the order eats multiple liquidity layers — slippage can be several paisa per unit.

12 practical ways to avoid or reduce slippage

  1. Prefer limit orders for entry when possible. Limiting execution price prevents negative slippage (but may miss the trade).
  2. Use stop-entry orders rather than market orders for breakout trades. They convert to market only once price reaches your trigger but can still slip — combine with reasonable buffer.
  3. Avoid trading during major news unless you have a tested plan. Spikes widen spreads and increase slippage risk.
  4. Trade liquid pairs during main session overlaps. EUR/USD, GBP/USD and USD/JPY have deepest liquidity and lowest slippage.
  5. Reduce order size in thin markets. Break big trades into smaller child orders to avoid walking the book.
  6. Choose brokers with good execution and transparent slippage stats. Ask for execution reports and ECN/STP routing options.
  7. Use brokers with negative slippage policies or guaranteed stop loss if required. Note this may cost in commissions/premiums.
  8. Use proper position sizing and limit risk per trade. If a trade can gap, small size limits absolute loss from slippage.
  9. Pre-check average spread and liquidity at your intended trade time. If spread is wide, skip or reduce size.
  10. Automate execution where possible and reduce human latency. Algos or VPS near broker servers reduce delay.
  11. Test and measure slippage in a demo/live environment. Log fills and compare expected vs executed prices.
  12. Avoid exotic or illiquid crosses unless you understand their cost profile. INR exotics may carry bigger hidden execution costs.

Broker selection checklist (execution focused)

  • Ask for historical execution reports or slippage statistics.
  • Prefer regulated brokers with ECN/STP pools and competitive pricing.
  • Confirm order types supported (guaranteed SL, limit, stop-entry, OCO).
  • Check server/VPS proximity and average round-trip time if you scalp.

Technology & platform tips

For high-frequency or scalping strategies minimize latency: use a VPS, lower-latency internet, and a broker with fast routing. Avoid platforms that freeze or re-quote during high volatility.

Post-trade review — how to get better

Each week review your slippage log: which pairs, session times, order types and brokers produced worse fills? Use that data to adjust rules — maybe stop trading certain pairs in certain hours or switch to limit-only entries.

SEO-friendly internal & external linking strategy

Link this post to related site content and trustworthy external sources:

Final takeaway & quick execution checklist

  1. Prefer limit orders & trade liquid pairs during main sessions.
  2. Reduce size in thin markets and avoid headline spikes unless planned.
  3. Choose brokers with transparent execution and log fills to measure slippage.
#forex#slippage#execution#tradingtips
rfxsignals October 7, 2025 No Comments

How to Trade News Events in Forex

How to Trade News Events in Forex

How to Trade News Events in Forex — A Practical Step-by-Step Guide

Updated: • Reading time: ~8–10 mins

Trading forex around scheduled news events (FOMC, NFP, CPI, RBI policy, GDP releases) offers high opportunity but also high risk. This guide gives a repeatable plan — preparation, entry rules, position sizing, and exit management — so you trade news events with discipline instead of betting on headlines.

Quick summary — what you’ll learn

  • How to prepare for news: calendar, liquidity windows, and pair selection
  • Two practical news-trade methods: volatility fade & breakout capture
  • Risk rules: position sizing, stop placement, and trade management
  • Checklist for execution and post-news review to improve performance

Why news trading is different from routine setups

News events compress information. Prices can move violently in seconds, creating big winners and losers. Unlike routine technical trades, you face larger slippage, spread widening, and occasional spikes/gaps — so standard indicators must be augmented with a news-specific playbook.

Step 1 — Preparation (the part most traders skip)

Preparation beats luck. Use a reliable economic calendar (e.g., your broker calendar or institutional calendars) and mark high-impact events: FOMC decisions, US Nonfarm Payrolls (NFP), CPI, GDP, RBI rate decisions and any surprise local headlines. Know the scheduled time in your time zone and watch for pre-event commentary.

  • Choose pairs: trade pairs that react predictably to the release (e.g., USD pairs on US data). For INR-sensitive moves, watch USD/INR and EUR/INR.
  • Session overlap: news often moves most when the respective session is active. NFP during New York session; RBI during India session.
  • Check liquidity: thin liquidity increases spreads — avoid exotics unless you can absorb costs.

Step 2 — Two reliable news-trade strategies

1) The Volatility Fade (mean-reversion)

Many news moves overshoot. The volatility fade attempts to enter after the initial spike once the immediate panic subsides and liquidity returns. Key rules:

  • Wait 30–120 seconds after the print to allow the first spike and quote noise to settle.
  • Use a limit order near the opposite side of the spike (e.g., if price jumps up, place a sell limit a few pips below the spike top).
  • Set a tight stop (e.g., a multiple of the printed volatility) and a modest target (1:1 to 1:2 initial R). Expect whipsaws — place small size.

2) Breakout Capture (ride the momentum)

Sometimes the market confirms a directional breakout after news. The breakout capture trades momentum rather than fading it.

  • Define the pre-news range (1–15 minutes). Place entry orders beyond that range (stop-entry) after the release.
  • Use wider stops to allow for initial volatility and trail stops as the move confirms.
  • Prefer breakout capture on truly directional surprises (e.g., much hotter CPI or a surprise rate cut/hike).

Step 3 — Risk management (non-negotiable)

News trades are riskier — treat them accordingly. Limit risk per trade to a small percentage of equity (0.25–1% typical for news), reduce position size, and predefine maximum daily exposure.

  • Use fixed risk per trade, not fixed lot size.
  • Account for spread widening — your stop must include the widened spread amount.
  • Consider using limit entries after the first move to control slippage for fade trades.

Order types & tech tips

Market orders during releases can suffer severe slippage. Use stop-entry orders for breakout strategies and limit orders for fades. Make sure your broker accepts quick cancels and supports conditional orders — otherwise use a platform with guaranteed SL if available.

Practical checklist — 10 minutes before, 1 minute before, and at release

10 minutes prior

  • Confirm event time and expected impact on your chosen pair.
  • Reduce leverage and set max exposure for the session.
  • Place or prepare orders and note stop/target levels.

1 minute prior

  • Freeze new trade entries not related to the event.
  • Ensure charts and DOM (depth) are ready; close unrelated positions if needed.

At release

  • Do not chase initial spikes. Let quotes settle if fading.
  • If breakout activates your stop-entry, manage risk and trail stops as the trend confirms.

Common psychological traps

Fear-of-missing-out (FOMO) and revenge trading after a stop are the biggest killers. Plan every trade, accept the small losing streaks, and review trades objectively. Post-news journaling will accelerate improvement.

Post-news review — how to learn fast

Keep a trade journal for each news event: timestamp, entry/exit, spread experienced, slippage, and rationale. Over time you’ll learn which events and pairs suit your style and which setups produce consistent edges.

SEO-friendly internal & external links to include

To boost SEO and topical authority, link this article to relevant internal pages and 2–3 high-authority external sources:

Final checklist — ready-to-print before the next release

  1. Pick the event and pair → verify session overlap
  2. Decide: fade or breakout → set order type
  3. Calculate risk & adjust size → include spread/slippage
  4. Execute with discipline → journal outcome
#forex#newstrading#USDINR#trading
rfxsignals October 7, 2025 No Comments

Best Currency Pairs for Indian Traders

Best Currency Pairs for Indian Traders

Best Currency Pairs for Indian Traders — Which Pairs to Trade & Why

Beginner → Advanced Reading time: ~8–10 mins

Choosing the right currency pair matters more than you think. For Indian traders, considerations like liquidity, RBI interventions, spreads, trading hours, and availability from Indian brokers make some pairs far better choices than others. This guide explains the best pairs, their pros & cons, and practical rules for scalpers, swing traders and position traders.

Chat on WhatsApp Join our Telegram
Want tailored pair recommendations?
Contact us

Quick summary — best picks for Indian traders

  • USD/INR — best for hedging INR exposure, widely traded in India.
  • EUR/INR, GBP/INR — good for volatility and directional trades; watch spreads.
  • EUR/USD, GBP/USD, USD/JPY — global majors with low spreads and deep liquidity.
  • Crosses (EUR/GBP, AUD/JPY) — useful for diversification but can have wider spreads.

Why pair choice matters for Indian traders

Pair selection affects spreads, slippage, available leverage, and exposure to India-specific events (RBI policy, rupee volatility, import/export flows). Indian brokers often offer competitive pricing on INR pairs but margin rules differ so always check your broker’s contract specifications.

Top pairs explained (practical, by trader style)

1. USD/INR — The most obvious starting point

USD/INR is central for Indian traders who want to hedge rupee risk or trade macro moves (like RBI intervention, crude oil shocks, or large capital flows). Advantages: strong liquidity during Indian hours, many local brokers provide direct quotes, and news events in India directly affect it.

  • Who it's for: hedgers, intraday traders active during India session, macro traders.
  • Watch out: on days with RBI intervention, volatility can spike and spreads may widen.

2. EUR/INR & GBP/INR — higher volatility, higher opportunity

These INR crosses can offer larger trending moves than USD/INR but often come with wider spreads. They react to both domestic and European/UK news, so check session overlap and news calendars.

3. EUR/USD, GBP/USD, USD/JPY — global majors every Indian trader should know

Even if you primarily care about INR, majors are essential: low spreads, deep liquidity, and predictable behavior around US/European/Japanese sessions. They are excellent for technical traders and scalpers.

4. Cross pairs & exotics — use selectively

Crosses (EUR/GBP, AUD/JPY) and exotics (TRY/INR, ZAR/INR) can produce big moves but typically have bigger spreads and lower liquidity. Reserve these for experienced traders who account for overnight risks and slippage.

Key selection factors — checklist before you trade any pair

  • Liquidity & spreads: tighter spreads reduce cost. Majors are cheapest.
  • Trading hours: which session has the biggest move for the pair?
  • News sensitivity: RBI, FOMC, ECB, BoE—know the calendar.
  • Broker availability: check margin, min lot, and execution quality on INR pairs.
  • Correlation: many INR pairs correlate strongly with USD/INR—manage cross exposure.

Practical rules & strategies for each trader type

Scalpers

Favor highly liquid majors (EUR/USD, USD/JPY) and USD/INR during India session. Keep timeframes < 15min, use tight stops, low-latency brokers and small size to manage slippage.

Swing traders

EUR/INR and GBP/INR are attractive because swings are larger. Use daily/4H charts with ATR-based stops and be careful around central bank meetings.

Position traders / investors

Consider USD/INR for hedging or long-term directional trades. Build positions slowly and use macro fundamental analysis (trade balance, forex reserves, inflation).

SEO-friendly internal & external linking strategy (how to wire this post)

Internal linking helps search engines and keeps readers on-site. Example internal links you should add from your site:

Use descriptive anchor text (e.g., “RBI policy impact on USD/INR”) and add at least 2–3 internal links to related posts on your site. When linking out, pick high-authority pages to strengthen topical relevance.

Risk control & money management (non-negotiable)

Always define risk per trade (e.g., 0.5–2% of trading capital), set stop-loss levels based on volatility (use ATR), and avoid overleveraging—especially with INR pairs that may gap on local news.

Broker & execution checklist for INR traders

  • Does the broker provide direct USD/INR quotes or synthetic?
  • Are margin rules and overnight financing transparent?
  • How are spreads during Indian market hours vs. London/New York?
  • Is the broker regulated by a reputable authority?

Final takeaway & action plan

For most Indian traders: start with USD/INR and at least one global major like EUR/USD. Use EUR/INR or GBP/INR for larger directional trades if your broker offers reasonable spreads. Keep strict risk controls, wire internal links to help SEO, and update this post after major RBI or global central bank events.

#forex#USDINR#trading#indiatraders
rfxsignals October 6, 2025 No Comments

GOLD SELL NOW ENTRY – 3900.230 | Targets, Stoploss & Live Market Analysis

Gold Sell Entry 3900.230 – XAUUSD Live Signal, Targets, Stoploss & Technical Analysis | RFXSignals

GOLD SELL NOW ENTRY – 3900.230 | Targets, Stoploss & Live Market Analysis

Published: October 6, 2025 • Source: RFXSignals.com

Trade Overview

  • Sell Entry: 3900.230
  • Target 1: 3865.258
  • Target 2: 3844.340
  • Stoploss: 3939.857

This high-accuracy gold sell signal identifies an ideal shorting opportunity at 3900.230 with a disciplined stoploss and dual profit targets. Derived from RFXSignals’ precision strategy, it provides clarity for both scalpers and swing traders in XAUUSD.

Technical Breakdown

1. Resistance Confirmation

The 3900 level corresponds with major resistance across H1 and H4 charts. The area shows repeated rejection wicks, confirming institutional selling pressure.

2. RSI & Divergence

RSI divergence near 70 signals exhaustion in bullish momentum. Historically, gold tends to retrace 35–50 points when such conditions appear near round numbers.

3. Fibonacci Retracement

Based on the previous high-low cycle, the 3900 zone coincides with a 78.6% retracement, making it a strong reversal region. This technical alignment adds further conviction.

4. Volume Imbalance

Volume Profile indicates a major supply imbalance between 3895–3905. A clean rejection in this zone often triggers a momentum drop toward 3860 and 3840 levels.

Trade Plan & Risk Management

Execute the short position at 3900.230. Place your stoploss at 3939.857 and target 3865.258 (TP1) and 3844.340 (TP2). The trade offers a solid risk-to-reward ratio exceeding 1:1.5, fitting well into modern gold trading systems.

Keep position size within 2% risk per trade. For traders using smaller accounts, micro lot scaling ensures sustainability.

Why RFXSignals Gold Setups Work

Our signals combine price action, institutional zones, Fibonacci confluence, and volatility analysis for maximum accuracy. Each setup is backtested to deliver both reliability and clarity under live market conditions.

More about our strategy: Gold Trading Strategy Guide.

Market Drivers to Watch

  • US Dollar Index (DXY) – inverse relationship with gold.
  • FOMC Rate Decision – volatility trigger for XAUUSD.
  • Global Risk Sentiment – geopolitical tensions fuel gold demand.

Stay updated with RFXSignals Market News for intraday catalysts.

Educational Insight

Understanding stoploss placement is vital. A good stop prevents small mistakes from becoming big losses. Explore this guide to effective stoploss management and advanced gold signal techniques.

Related Resources

Join Live Signal Channels

Receive instant gold, forex, and crypto signals directly on your favorite platform.

Call to Action

🚀 Get verified, premium signals directly from professionals. Join RFXSignals.com today and access real-time updates and exclusive trading tools.

🔔 Subscribe Now for Premium Signals

Disclaimer: Trading involves substantial risk and is not suitable for all investors. This content is for educational purposes only and does not constitute financial advice.

rfxsignals October 3, 2025 No Comments

How to Create a Forex Signal Funnel That Converts Visitors into Subscribers

How to Create a Forex Signal Funnel That Converts Visitors into Subscribers
How to Create a Forex Signal Funnel That Converts Visitors into Subscribers | {{SITE_NAME}}

How to Create a Forex Signal Funnel That Converts Visitors into Subscribers

By • Estimated read: 8–10 minutes

Quick summary: A high-converting Forex signal funnel combines targeted landing pages, effective lead magnets, friction-free CTAs (WhatsApp, Telegram, email), automated nurture sequences, and data-driven testing. Below is a practical, step-by-step blueprint you can implement in Elementor and scale for organic traffic or paid campaigns.

Building a funnel isn’t just about capturing emails — it’s about capturing the right leads and moving them through a predictable path from visitor → trial subscriber → paid member. For Forex sites, trust and perceived value are paramount. Your funnel must reduce friction, prove signal performance quickly, and provide social proof that converts skeptics into subscribers.

1. Define the funnel stages

A simple, effective funnel has four stages:

  1. Attract: organic blog posts, SEO pages, PPC ads, and social content driving traffic to a landing page.
  2. Capture: landing page with lead magnet and clear CTA (WhatsApp, email, or Telegram opt-in).
  3. Nurture: automated email/WhatsApp sequences delivering value and proving signal credibility.
  4. Convert & Retain: onboarding, trial offers, member-only content, and upsell pathways for paid signals.

2. High-converting landing page elements

Your Elementor landing page should be lightweight and focused. Include:

  • Clear headline: promise a specific benefit (e.g., “Daily Forex Signals — Backtested & Real-Time”).
  • Concise subheadline: one-line reason to trust you (track record, transparency).
  • Lead magnet: free PDF, 3-day trial, or a live signal sample to demonstrate real value.
  • Social proof: time-stamped screenshots, case studies, or brief testimonials.
  • Primary CTA: WhatsApp/Email opt-in (use `wa.me` for mobile-friendly WhatsApp links).
  • Secondary CTA: “Learn More” to internal pages that support SEO and inbound links.

3. Choosing the best lead magnet for Forex signals

Lead magnet examples that convert well in trading niches:

  • “Top 5 High-Probability Setups” PDF with screenshots and historical results.
  • 3-day trial of live signals with reduced risk sizing.
  • Mini-course: “How We Build a Signal” — short videos + checklist.
  • Trade journal template (spreadsheet) pre-filled with example signals.

Pick one high-value magnet and A/B test the offer language and format.

4. Friction-free signup: forms, WhatsApp & Telegram

Minimal friction gets more subscribers. Options to consider:

  • One-field forms: ask only for email or phone number.
  • WhatsApp quick opt-in: `https://wa.me/{{WHATSAPP_NUMBER}}?text=...` prefilled message makes mobile conversions instant.
  • Telegram opt-in: for users who prefer channel-based delivery — `t.me/{{TELEGRAM_USERNAME}}`.

Provide alternative contact methods (email + WhatsApp) so users choose what’s easiest.

5. Nurture sequences that prove value

After capture, a carefully timed automation builds credibility and nudges conversion:

  1. Welcome message (immediate): deliver lead magnet and set expectations.
  2. Proof email (24 hours): show time-stamped past signals and outcomes.
  3. Education (day 3–7): short lessons on reading signals and risk management.
  4. Trial highlight (day 7–10): limited-time trial or discounted first month.
  5. Retarget & re-engage: if no conversion, use targeted content or WhatsApp reply prompts.

6. Segmentation and personalization

Not all visitors are the same. Segment by:

  • Experience level (beginner, intermediate, pro)
  • Preferred instrument (Forex pairs, crypto, indices)
  • Preferred delivery channel (WhatsApp, Telegram, Email)

Personalized messages increase conversion rates — e.g., “Here’s how EURUSD signals work” vs “Here’s our crypto signal process”.

7. Proof, transparency & trust signals

Forex audiences are skeptical. Use:

  • Public performance dashboards (daily P&L snapshots).
  • Third-party verification where possible (Myfxbook, FX Blue links — add outbound links for credibility).
  • Time-stamped screenshots and short video walk-throughs of live trades.

8. Pricing strategy & trial mechanics

Good strategies:

  • Free trial with limits: give sample signals but cap size or access duration.
  • Low entry pricing: a small monthly fee to qualify serious subscribers.
  • Tiered plans: Basic (daily signals), Pro (scaling entries + chat), VIP (1:1 support).

9. Measure, test & optimize

Key metrics to track:

  • Landing page conversion rate (visitors → leads)
  • Lead-to-subscriber conversion (trial → paid)
  • Churn rate and lifetime value (LTV)
  • Cost per acquisition (CPA) if using paid ads

Run A/B tests on headlines, lead magnets, CTA colors, and WhatsApp vs email opt-ins. Change only one element per test and run for a statistically significant period.

10. Automation stack & recommended tools

Lightweight stack suggestions:

  • Elementor (landing pages + forms)
  • Email automation: MailerLite, ConvertKit, or ActiveCampaign
  • WhatsApp business + `wa.me` links for direct chat
  • Telegram channel + bot for broadcast automation
  • Analytics: Google Analytics + Google Tag Manager + Funnel tracking
SEO & Link Strategy: Use internal links to related posts (signals, backtests, performance) and add outbound links to authoritative resources (regulatory guidance, industry tools). This improves topical relevance and link-building potential.

11. Retention: turning subscribers into long-term members

Retention beats acquisition. Tactics that work:

  • Weekly performance summaries and transparent P&L.
  • Monthly Q&A calls or webinars with trade rationale.
  • Member-only content and progressively valuable upgrades.
  • Referral incentives to turn members into evangelists.

12. Example funnel blueprint (practical)

Traffic source (SEO blog) → Landing page with PDF lead magnet → WhatsApp quick opt-in → Automated welcome + proof email → 3-day trial signals → Day 7 trial review & upsell → Paid onboarding with VIP channel access. Monitor conversion at each step and iterate monthly.

Conclusion

Building a high-converting Forex signal funnel requires clarity, proof, and low friction. Use Elementor to build fast landing pages, a WhatsApp/Telegram-first approach for instant conversions, and automation to scale nurture flows. Measure everything and iterate — small lifts across the funnel compound into large growth.

Disclaimer: Trading carries risk. This article is educational and not financial advice. Test funnel changes in small steps and measure impact before scaling.
rfxsignals October 3, 2025 No Comments

The Future of Forex Signals: Blockchain, AI & Decentralized Trading

The Future of Forex Signals: Blockchain, AI & Decentralized Trading

The Future of Forex Signals: Blockchain, AI & Decentralized Trading

The Forex trading world is evolving at a rapid pace. With the integration of Blockchain, Artificial Intelligence (AI), and Decentralized Trading platforms, the future of Forex signals looks more transparent, efficient, and profitable. In this guide, we will explore how these technologies are reshaping Forex trading and what traders can expect in the coming years.

1. Introduction to Forex Signals and Their Evolution

Forex signals have traditionally been generated by expert traders or trading software to guide others on when to buy or sell a currency pair. However, as markets become more complex and volatile, the demand for reliable, real-time, and transparent signals has grown significantly. This is where Blockchain, AI, and decentralized ecosystems come in to transform the industry.

2. The Role of Blockchain in Forex Signals

Blockchain technology ensures transparency and trust in Forex signals. By storing trade recommendations and results on an immutable ledger, traders can verify performance without manipulation.

  • Transparency: Every signal is recorded permanently.
  • Trustless environment: No middleman needed.
  • Fraud prevention: Impossible to alter past results.

3. Artificial Intelligence and Machine Learning in Forex

AI-powered algorithms analyze vast amounts of market data, detect hidden patterns, and predict potential outcomes. AI enhances the accuracy of signals by factoring in:

  • Market sentiment analysis
  • Historical price patterns
  • Volatility modeling
  • Risk-to-reward optimization

Machine learning allows systems to continuously learn and improve signal accuracy over time, making them far superior to traditional methods.

4. Decentralized Trading Platforms (DeFi in Forex)

Decentralized platforms eliminate intermediaries and give traders direct control of their funds and trades. These systems also allow peer-to-peer sharing of signals, ensuring:

  • Lower trading costs
  • Global accessibility
  • Greater security of funds
  • Democratization of trading signals

5. Benefits of Future Forex Signal Systems

The combination of Blockchain, AI, and decentralized platforms creates powerful advantages:

  • Transparency: No fake results.
  • Accuracy: AI-driven predictions.
  • Security: Decentralized data and funds.
  • Accessibility: Open to traders worldwide.

6. Challenges in Adopting These Technologies

Despite the potential, there are obstacles:

  • High cost of AI infrastructure
  • Regulatory uncertainties in decentralized systems
  • Technical knowledge required for adoption

7. The Road Ahead for Forex Traders

The future will likely see hybrid models where AI-driven signals are stored on blockchain ledgers and executed through decentralized platforms. This will give traders confidence, efficiency, and security.

🚀 Ready to Trade Smarter?

Join our community to access AI-powered, blockchain-backed Forex signals and trade with confidence.

Connect on WhatsApp Join on Telegram

© 2025 YourForexSite.com | All Rights Reserved.

rfxsignals October 3, 2025 No Comments

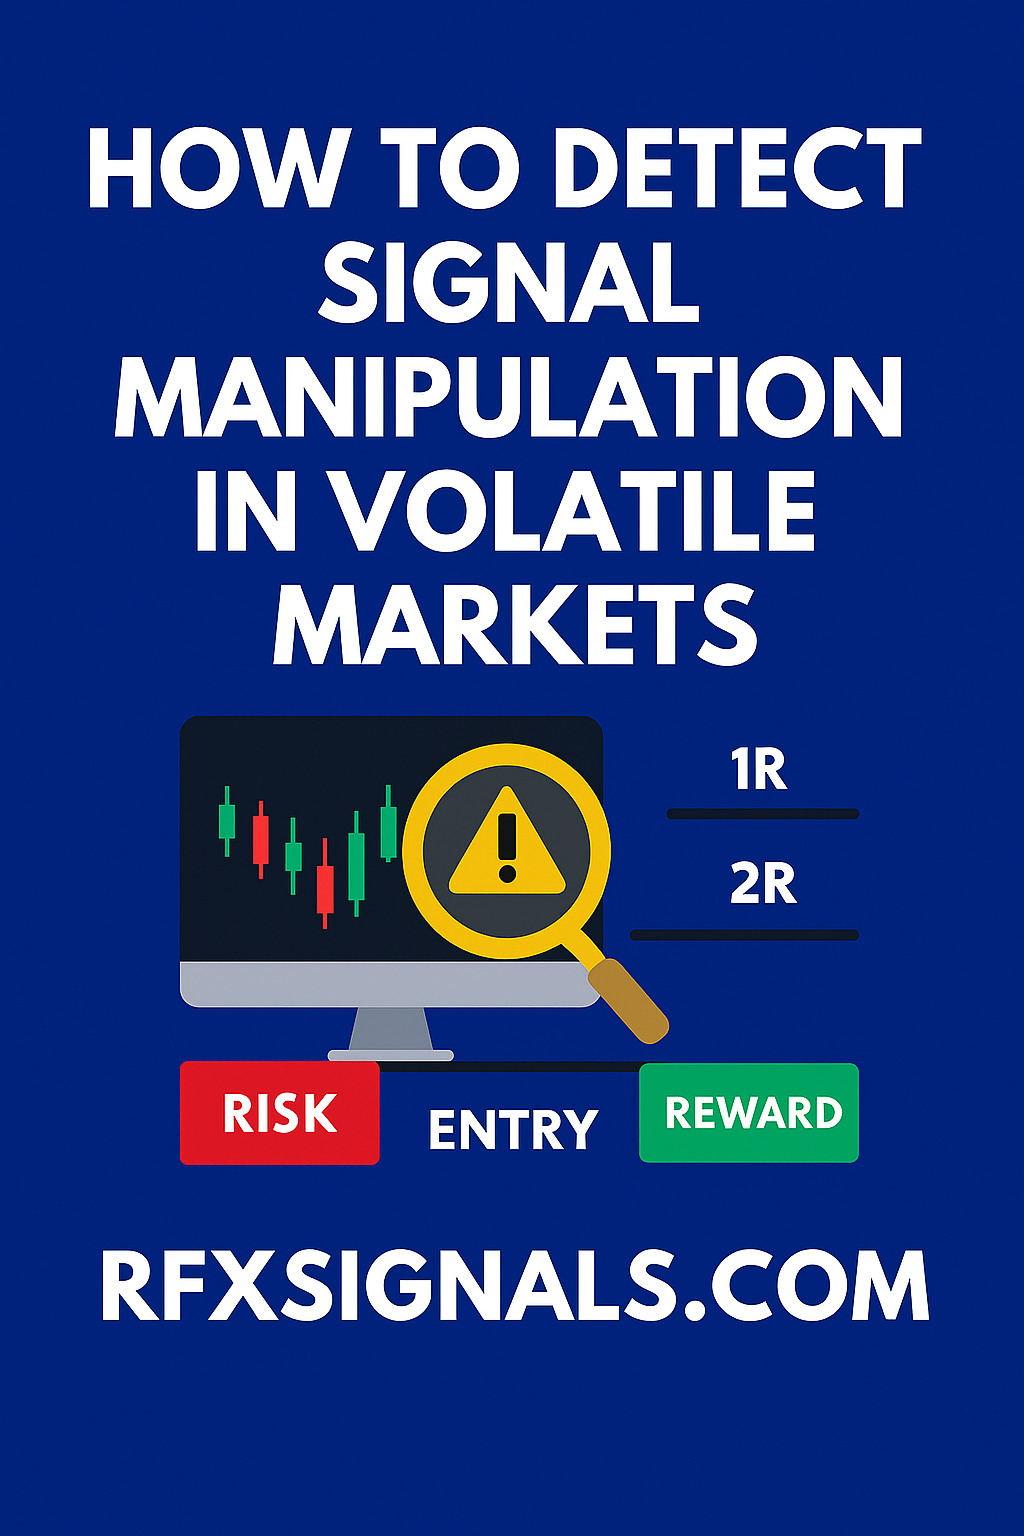
How to Detect Signal Manipulation in Volatile Markets

How to Detect Signal Manipulation in Volatile Markets
How to Detect Signal Manipulation in Volatile Markets | {{SITE_NAME}}

How to Detect Signal Manipulation in Volatile Markets

By Estimated read: 9–11 minutes

Overview: Volatile markets create fertile ground for legitimate signal noise and for deliberate signal manipulation. Knowing how to spot manipulation—fake fills, spoofing, coordinated alerts, and delayed data—helps you avoid poor trades and preserve capital. This guide lists red flags, diagnostic tests, and practical defensive rules you can implement immediately.

Volatile markets amplify every input — including the signals you follow. Distinguishing authentic signals from manipulated or low-quality alerts is essential for any trader relying on external feeds, community channels, or automated strategies. This article breaks detection into (A) red-flag behaviors, (B) data tests you can run, (C) cross-checks and forensic checks, and (D) defensive rules to keep your drawdown small when the market behaves badly.

1. Common types of signal manipulation

Understanding the methods helps detect them. Frequent manipulative behaviors include:

  • Spoofed fills: fake order information shown on some platforms but not actually executable on the exchange.
  • Delayed or stale data: feeds that lag market prices, making "real-time" signals inaccurate.
  • Coordinated pump-and-dump alerts: groups send bullish signals to create momentum, then exit.
  • Cherry-picked backtests: signals optimized for specific long-tailed periods that don’t hold live.
  • Wash alerts: test alerts sent to create perceived success before real trades are placed.

2. Red flags you should watch

If you see any of the following, treat the signal with suspicion:

  • Repeated "perfect" entries or exits with unrealistically tight stops.
  • Signals that arrive only after large market moves (late alerts).
  • High-volume claims without independent verification (no fill screenshots, no broker statements).
  • Channels that frequently change recommended targets/stops without transparent reasoning.
  • Pressure to act immediately or fear-of-missing-out (FOMO) prompts in messaging.

3. Quick data checks you can run (real-time)

When a signal arrives in a volatile market, run these rapid checks before risking capital:

  1. Timestamp check: Compare the signal timestamp to your price feed. If the signal refers to a price that happened >1–3 seconds earlier in a fast market, treat it as stale.
  2. Exchange verification: For crypto or ECN markets, verify the quoted level on the exchange's native order book or official API.
  3. Volume confirmation: Check whether volume on the move supports the claim. Low-volume moves during volatility often reverse quickly.
  4. Cross-feed confirmation: Look for the same move on a different data provider or broker.
  5. Order book depth: Observe whether large visible orders are genuine or vanish (a sign of spoofing).

4. Statistical and forensic tests (post-event)

For signals you already received, perform these retrospective checks to detect manipulation or poor signal hygiene:

  • Fill/Execution audit: Compare the claimed entry/exit to actual fills recorded by your broker; large discrepancies indicate misreporting.
  • Latency analysis: Measure the delay between alert and market price (log timestamps). A pattern of >X seconds delay in volatile periods is suspicious.
  • Correlation testing: Check if multiple symbols moved together artificially (e.g., many illiquid pairs spiking simultaneously).
  • Win/loss distribution review: Real strategies show varied outcomes; overly tidy drawdowns and smooth equity curves may be overfitted.

5. Cross-check sources and reputations

Signal quality depends on the sender. Maintain a source registry:

  • Grade sources by historical accuracy and transparency (A–F).
  • Prefer sources that publish post-trade evidence: time-stamped screenshots, broker reports, or public API calls.
  • Avoid exclusive-only groups that refuse to let you audit past signals.

6. Behavioral signs from chat/activity logs

Monitor the behavior of channel moderators or signal providers. Signs of manipulation include:

  • Deleting or altering messages after the fact to make a signal look better.
  • Amplifying FOMO with constant "now or never" messages.
  • Posting confusing mixed signals to create noise while insiders trade elsewhere.

7. Defensive trade rules to limit damage

You don’t need to root out every manipulative act; you need rules that protect capital. Implement these defensive rules:

  • Wait-for-confirmation: Require a price or volume confirmation before entering after a signal (e.g., close above/below the signal price on a 1-minute candle).
  • Reduced sizing in volatile windows: Scale position size down during scheduled news or extreme volatility.
  • Use limit entries with slippage caps: Only accept fills within acceptable slippage; reject fills beyond that to prevent chasing fake moves.
  • Predefine maximum exposure: Keep a portfolio-level cap; if multiple signals spike, reduce per-signal size.
  • Auto-stop audit: Keep logs of stop placement vs actual executed stop levels to detect mismatches quickly.

8. Automation & monitoring tools

Automation helps detect patterns faster than manual checks. Consider:

  • Recording all incoming alerts with timestamps and automatically matching them to price feed snapshots.
  • Setting automated alerts when fill slippage exceeds thresholds or when the order book shows disappearing liquidity.
  • Using simple statistical dashboards to flag sources whose reported results deviate significantly from actual fills.

9. Legal & ethical considerations

Some manipulative behaviors are illegal in regulated markets. If you suspect fraud (coordinated pump-and-dump, spoofing on regulated exchanges), document evidence and report to the relevant market regulator or exchange. Private chat disputes are common — preserve logs and timestamps before attempting to escalate.

Quick Checklist: 1) Always verify timestamps and price sources; 2) Check volume and order-book depth; 3) Reduce size in volatile windows; 4) Keep an audit trail for suspicious signals.

10. Example: a real-world detection workflow

Scenario: You receive a bullish breakout alert during a major economic release.

  1. Immediately snapshot the price from your primary feed and a secondary feed (exchange API or alternative broker).
  2. Check volume on the breakout candle; if volume is muted, treat the breakout as weak.
  3. If the order book shows large orders that vanish after you attempt to take them, abort the trade.
  4. If you still enter, reduce size by 50% and set a stricter slippage/stop rule.
  5. Log all timestamps and reconcile fills after the event — if your fills consistently differ, remove the source.

Conclusion

Signal manipulation is not always obvious, especially during high volatility. The best defense is a combination of skepticism, fast data checks, source auditing, and conservative trade rules that limit downside. Build these checks into your workflow and automate where possible — preserving capital during manipulated conditions is the fastest path to long-term profitability.

Disclaimer: This content is educational and not financial advice. Trading involves risk. Always test rules in a demo environment before scaling live.
rfxsignals October 3, 2025 No Comments

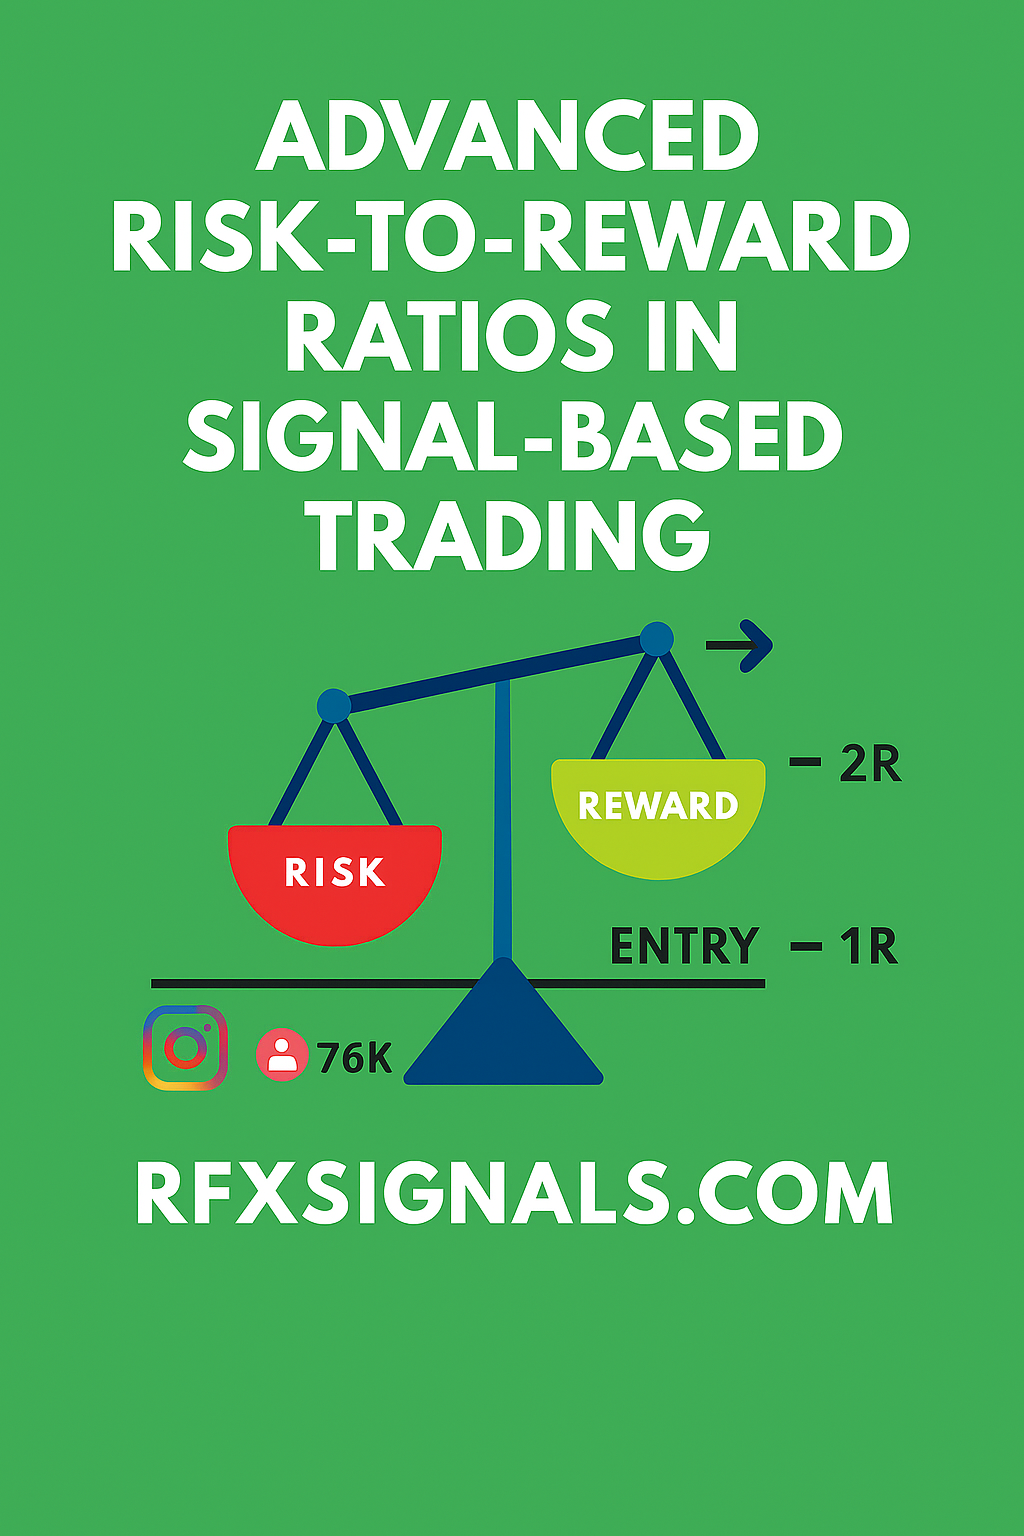
Advanced Risk-to-Reward Ratios in Signal-Based Trading

Advanced Risk-to-Reward Ratios in Signal-Based Trading
Advanced Risk-to-Reward Ratios in Signal-Based Trading | {{SITE_NAME}}

Advanced Risk-to-Reward Ratios in Signal-Based Trading

By Estimated read: 9 minutes

Summary: Signal-based trading requires more than following alerts — it needs a disciplined approach to risk-to-reward (R:R). This guide shows advanced methods to determine R:R in multi-signal setups, how to size positions for edge preservation, and practical rules to improve long-term expectancy.

Signal-based trading transforms subjective market views into repeatable processes. But without robust risk-to-reward rules, winning signals can be eroded by poor sizing and mismanaged stop placement. This article explores advanced R:R concepts tailored for traders who rely on signals — whether algorithmic, manual, or community-driven — and want to convert positive hit-rate signals into long-term profitability.

1. Why R:R matters more with signals

Signals often arrive clustered (several signals in a narrow time window) or as contradicting messages from different indicators. A naive, fixed R:R (like 1:2 always) ignores context: market volatility, signal quality, and overlapping exposure. Advanced traders adapt R:R dynamically to preserve edge while keeping drawdown under control.

2. Signal quality and expected value (EV)

Before assigning R:R, evaluate signal quality. Key metrics:

  • Historical hit rate (over similar conditions)
  • Average win and loss size
  • Signal correlation with price regime (trending vs range)

Use these to estimate EV. If a signal historically shows a 40% win rate with an average win 2× average loss, the expectancy per trade = 0.4×2 − 0.6×1 = 0.2 units; this positive EV lets you accept lower R:R (e.g., 1:1) while maintaining profitability.

3. Dynamic R:R: volatility and regime adjustment

Set stops and targets relative to volatility (ATR or realized volatility). Rules of thumb:

  • Low-volatility regime → tighter stops, smaller targets (preserve capital)
  • High-volatility regime → widen stops but increase target multiples to maintain R:R
  • Use ATR multiples to compute stop distance and derive target = stop_distance × desired_RR

Example: ATR(14) = 20 pips. If your signal is strong in trending markets, set stop = 1×ATR (20 pips) and target = 3×ATR (60 pips) for R:R 1:3.

4. Combining multiple signals: scaling and staggered R:R

When two or more signals (e.g., indicator + price action) align, you can scale position entries and use staggered R:R:

  1. Entry A (initial signal): 50% position, stop at conservative level, target at 1:1.5
  2. Entry B (confirming signal): add 30%, tighter stop trailing to breakeven, target at 1:3
  3. Final add (strong macro confirmation): 20%, wider target 1:4 if trend continuation confirmed

Staggering reduces risk when signal reliability is uncertain and magnifies profits on strong trends.

5. Position sizing rules for multi-signal exposure

Preserve account equity by sizing to total exposure, not per signal. Use these steps:

  1. Decide max account risk per trade (e.g., 1% of equity).
  2. If you expect multiple correlated signals, reduce per-signal risk (e.g., 1% total split into 0.5% and 0.5%).
  3. Calculate lot size = (account_risk_amount) ÷ (stop_distance in quote currency).

This prevents over-leveraging when several signals hit simultaneously.

6. Trade management: moving stops, partial exits, and expectancy preservation

After entry, follow a documented rule set:

  • At +1R, move stop to breakeven for initial portion to eliminate downside for the remainder.
  • Use partial exits at key levels (support/resistance or Fibonacci) instead of arbitrary fixed profits.
  • Trail stop after the trade achieves target multiples to lock in gains and let winners run.

Well-structured management can turn a moderate R:R into superior system expectancy.

7. Handling correlated alerts and portfolio-level R:R

Many signals are correlated (e.g., EURUSD and GBPUSD). Treat correlated trades as a single portfolio exposure. Compute portfolio R:R by aggregating potential P&L and risk across correlated positions and size accordingly to keep total risk within limits.

8. Backtesting R:R strategies on signal streams

Backtest using realistic assumptions: slippage, spread, and partial fills. Test several R:R bands (1:1, 1:2, 1:3) across different market regimes and measure drawdowns and Sharpe/Sortino ratios. Focus on metrics that matter to you — a higher R:R with rare wins may still underperform a lower R:R with higher hit rate.

9. Psychological & operational considerations

Higher R:R often means fewer wins and requires discipline. Use automation for signal execution where possible to remove execution hesitation. Document every trade and review monthly to refine R:R rules.

Quick Checklist: 1) Measure signal EV; 2) Adjust R:R by volatility; 3) Size per total exposure; 4) Use staggered entries for confirmation; 5) Backtest with realistic costs.

10. Practical example (step-by-step)

Signal: Breakout + momentum confirmation on 1H chart.

  1. ATR(14)=18 pips → stop = 1×ATR = 18 pips
  2. Target = 3×ATR = 54 pips → R:R = 1:3
  3. Account risk = 1% → risk per trade = $100 on $10,000 account
  4. Position size = $100 ÷ (18 pips × pip_value) → compute lots accordingly
  5. At +1R, move 50% of position to breakeven, trail remainder with 0.5×ATR

11. SEO & link strategy (for publishers)

When publishing signal-based content, link internally to relevant pages (e.g., /signals, /case-studies, /pricing) and externally to authoritative sources (e.g., educational resources). Use anchor text naturally: “signal performance report,” “ATR volatility guide,” etc. This article includes suggested internal links to improve thematic relevance and outbound links to trusted learning resources.

Conclusion

Advanced R:R in signal-based trading is a multi-dimensional problem: balance signal quality, volatility, and total portfolio exposure. Dynamic R:R, staggered entries, and disciplined sizing transform signals from noisy alerts into a sustainable advantage. Use consistent backtests and keep the rules simple enough to follow in real-time.

Disclaimer: Trading carries risk. Past performance is not indicative of future results. This content is educational and not financial advice.