The Pound is still being controlled by bears. Overview for 29.01.2020

The Pound is still being controlled by bears. Overview for 29.01.2020

29.01.2020

GBPUSD continues falling deeper and deeper on Wednesday afternoon.

The British Pound remains weak against the USD. The current quote for the instrument is 1.3011.

The statistics from the United Kingdom published yesterday showed that the CBI Realized Sales remained at 0 points in January against the expected reading of 5 points. The reading didn’t make investors happy: everything that is below zero indicates decline, but zero is a pretty negative thing as well because it means that the sector has problems.

“Guardian” has reported recently that early in the spring the United Kingdom and the European Union might start talks on further cooperation after the Brexit. According to the media, the date is March 3rd.

It’s very important for both parties to start discussing the trade agreement and other issues, such as a single European market and the customs union without wasting time. The existing regulations are effective throughout this year. Earlier, it was reported that these talks may last as long as until the end of 2022. One of the EU representatives said that there were risks of breach between two parties. If it does happen, it will be a major problem for both parties. However, it’s rather unclear who will suffer more, London or Brussels.

Fibonacci Retracements Analysis 29.01.2020 (GBPUSD, EURJPY)

Fibonacci Retracements Analysis 29.01.2020 (GBPUSD, EURJPY)

29.01.2020

GBPUSD, “Great Britain Pound vs US Dollar”

As we can see in the H4 chart, GBPUSD is still correcting and forming Triangle pattern. After attempting to break the resistance, the pair is returning to 38.2% fibo at 1.2883. The downside target is the low at 1.2904. If the price breaks this level, the instrument may continue falling towards 50.0% and 61.8% fibo at 1.2856 and 1.2700 respectively.

GBPUSD_H4
Risk Warning: the result of previous trading operations do not guarantee the same results in the future

The H1 chart shows a new descending wave after the divergence on MACD. The price is moving towards mid-term 50.0% fibo (1.2855), which is inside the post-correctional extension area between 138.2 and 161.8% fibo at 1.2882 and 1.2832 respectively.

GBPUSD_H1
Risk Warning: the result of previous trading operations do not guarantee the same results in the future

EURJPY, “Euro vs. Japanese Yen”

As we can see in the H4 chart, the correctional downtrend has stopped at 38.2% fibo. After testing and breaking this level, the decline may continue towards 50.0% and 61.8% fibo at 119.36 and 118.55 respectively. The resistance is at 121.21.

EURJPY_H4
Risk Warning: the result of previous trading operations do not guarantee the same results in the future

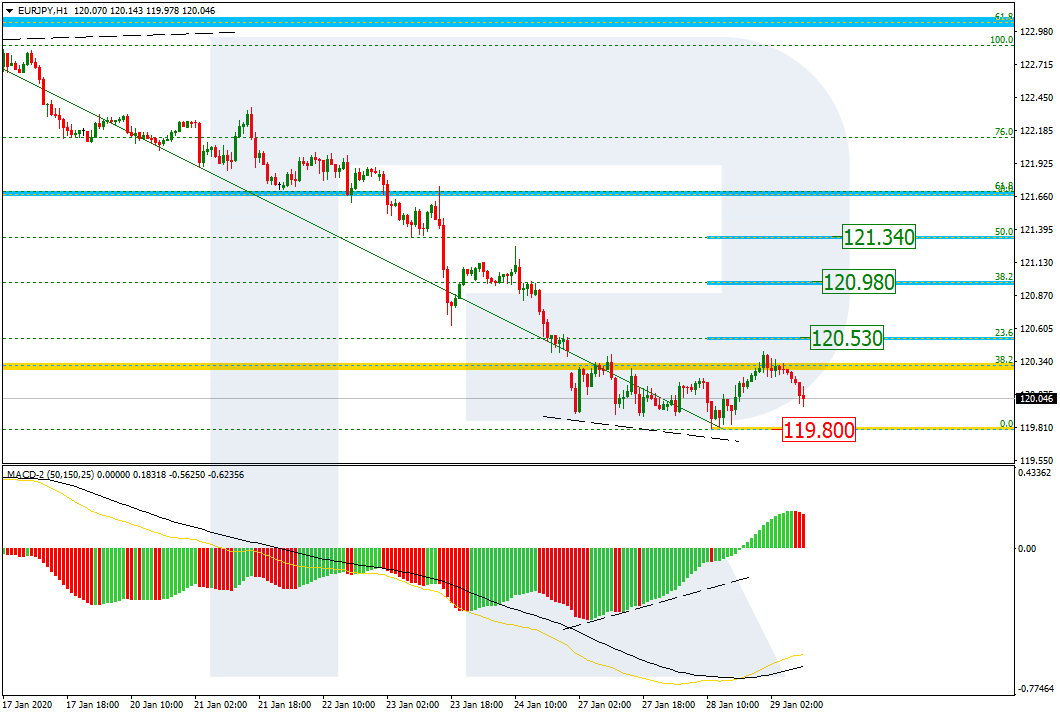
The H1 chart shows a new pullback after the convergence on MACD. The targets are 23.6%, 38.2%, and 50.0% fibo at 120.53, 120.98, and 121.34 respectively. The support is the low at 119.80.

EURJPY_H1

The Pound is trying to rise. Overview for 22.01.2020

The Pound is trying to rise. Overview for 22.01.2020

22.01.2020

GBPUSD moved upwards a bit thanks to the statistics on the employment, but it might be not enough to continue the momentum.

On Wednesday, the British Pound may try to keep yesterday’s momentum against the USD, but bulls might not be strong enough. The current quote for the instrument is 1.3047.

It became known yesterday that the Unemployment Rate in the United Kingdom remained unchanged at 3.8% in November, just as expected. As one can see from the report, the employment level added 0.6% and was 76.3%, which is the highest reading over the long haul.

The Average Earnings Index showed +3.2% 3m/y, the same as the period before. It appears that the incomes of the British people continue expanding in real terms, which is quite good. However, even with all things considered, the previous numbers made it perfectly clear that the country’s economy was rather weak.

The Claimant Count Change showed 14.9K in December, the same as in the previous month. Market expectations were 33.4K.

Employers are really worrying that the Brexit uncertainty may continue throughout 2020, thus preventing both enterprises and the employment sector from developing.

Murrey Math Lines 22.01.2020 (USDJPY, USDCAD)

Murrey Math Lines 22.01.2020 (USDJPY, USDCAD)

22.01.2020

USDJPY, “US Dollar vs. Japanese Yen”

As we can see in the H4 chart, USDJPY is moving above 5/8. In this case, the price is expected to break 6/8 and then continue growing to reach the resistance at 8/8. However, this scenario may no longer be valid if the price breaks 5/8 to the downside. After that, the instrument may start a new decline towards the support at 3/8.

USDJPY_H4
Risk Warning: the result of previous trading operations do not guarantee the same results in the future

In the M15 chart, the pair may break the upside line of the VoltyChannel indicator and, as a result, continue trading upwards.

USDJPY_M15
Risk Warning: the result of previous trading operations do not guarantee the same results in the future

USDCAD, “US Dollar vs Canadian Dollar”

As we can see in the H4 chart, USDCAD is still moving below 3/8. In this case, the pair may test this level, rebound from it, and then resume falling to reach the support at 1/8. However, this scenario may no longer be valid if the price breaks 3/8 to the upside. After that, the instrument may continue growing towards the resistance at 4/8.

USDCAD_H4
Risk Warning: the result of previous trading operations do not guarantee the same results in the future

In the M15 chart, the pair may break the downside line of the VoltyChannel indicator and, as a result, continue moving downwards to reach 1/8 from the H4 chart.

USDCAD_M15
Risk Warning: the result of previous trading operations do not guarantee the same results in the future

Forex Technical Analysis & Forecast 22.01.2020 (EURUSD, GBPUSD, USDCHF, USDJPY, AUDUSD, USDRUB, USDCAD, GOLD, BRENT, BTCUSD)

Forex Technical Analysis & Forecast 22.01.2020 (EURUSD, GBPUSD, USDCHF, USDJPY, AUDUSD, USDRUB, USDCAD, GOLD, BRENT, BTCUSD)

22.01.2020

EURUSD, “Euro vs US Dollar”

EURUSD is forming the fifth descending wave; after finishing the correctional wave towards 1.1117, the price has completed another descending structure with the first target at 1.1080. At the moment, the instrument is consolidating. Possibly, the pair may fall to reach 1.1075 and then grow towards 1.1087 at least. Later, the market may start a new decline with the target at 1.1062.

EURUSD
Risk Warning: the result of previous trading operations do not guarantee the same results in the future

GBPUSD, “Great Britain Pound vs US Dollar”

GBPUSD has finished the ascending correctional structure towards 1.3080. Today, the pair may fall to break 1.3000 and then continue trading inside the downtrend with the short-term target at 1.2927.

GBPUSD
Risk Warning: the result of previous trading operations do not guarantee the same results in the future

USDCHF, “US Dollar vs Swiss Franc”

USDCHF has broken 0.9688; right now, it is still forming the fifth ascending wave. Possibly, today the pair may test 0.9690 from above and then form one more ascending structure with the short-term target at 0.9703.

USDCHF
Risk Warning: the result of previous trading operations do not guarantee the same results in the future

USDJPY, “US Dollar vs Japanese Yen”

After completing the descending impulse at 109.80, USDJPY has finished the correction towards 110.03. Today, the pair may fall to break 109.80 and then continue moving downwards with the short-term target at 109.41.

USDJPY
Risk Warning: the result of previous trading operations do not guarantee the same results in the future

AUDUSD, “Australian Dollar vs US Dollar”

AUDUSD has finished the descending structure towards 0.6832. Possibly, today the pair may resume moving upwards to reach 0.6850 and then start another decline with the target at 0.6811.

AUDUSD
Risk Warning: the result of previous trading operations do not guarantee the same results in the future

USDRUB, “US Dollar vs Russian Ruble”

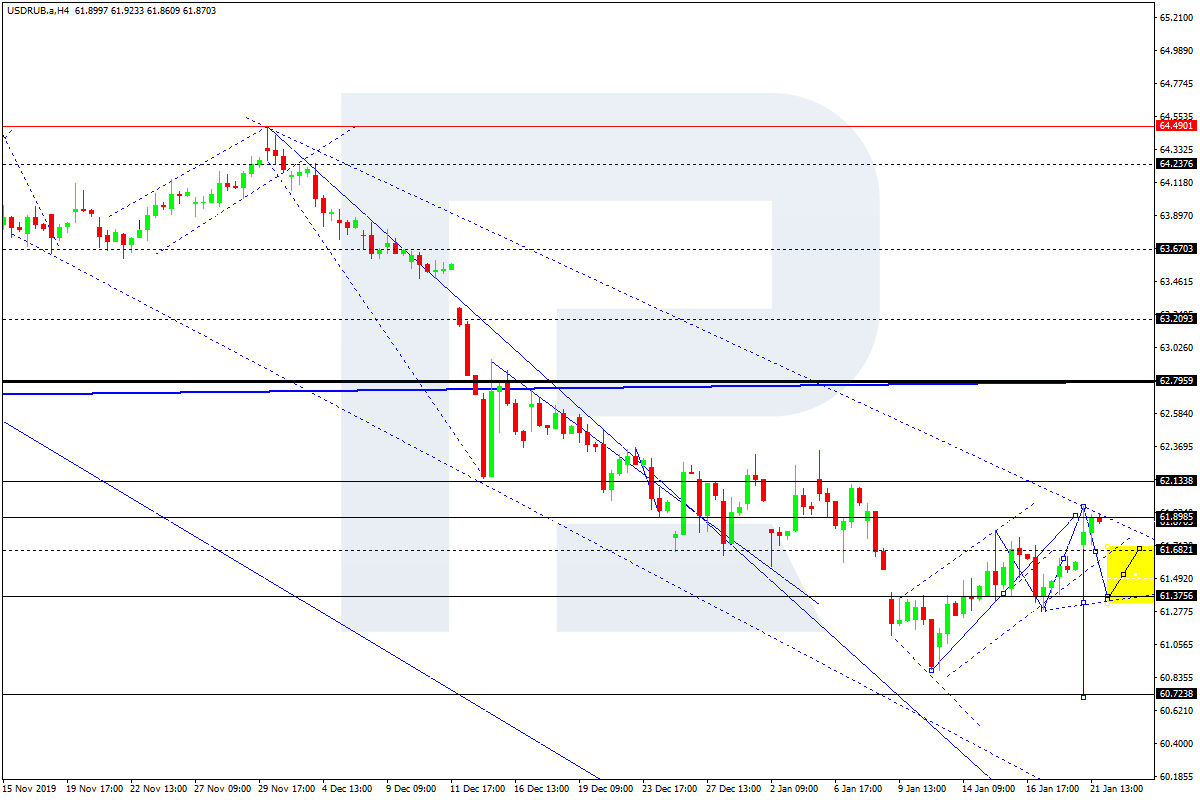
USDRUB has reached 61.90; right now, it is consolidating at the top. According to the main scenario, the price is expected to resume trading inside the downtrend with the target at 61.37.

USDRUB
Risk Warning: the result of previous trading operations do not guarantee the same results in the future

USDCAD, “US Dollar vs Canadian Dollar”

USDCAD is forming another ascending structure towards 1.3104. After that, the instrument may start a new correction to reach 1.3077 and then resume trading upwards growth with the target at 1.3118.

USDCAD
Risk Warning: the result of previous trading operations do not guarantee the same results in the future

XAUUSD, “Gold vs US Dollar”

Gold is forming one more descending structure towards 1545.80. Later, the market may start another correction with the target at 1556.96 and then resume trading downwards to reach 1534.34.

GOLD
Risk Warning: the result of previous trading operations do not guarantee the same results in the future

BRENT

Brent is moving downwards. Possibly, the pair may reach 63.97 and then start another growth with the target at 64.90.

BRENT
Risk Warning: the result of previous trading operations do not guarantee the same results in the future

BTCUSD, “Bitcoin vs US Dollar”

BTCUSD is still consolidating around 8600.00. The main scenario implies that the pair may grow to break 8850.00 and then continue trading upwards to reach 9240.00. After that, the instrument may start a new decline with the target at 7700.00.

BITCOIN
Risk Warning: the result of previous trading operations do not guarantee the same results in the future

Ichimoku Cloud Analysis 22.01.2020 (AUDUSD, NZDUSD, USDCAD)

Ichimoku Cloud Analysis 22.01.2020 (AUDUSD, NZDUSD, USDCAD)

22.01.2020

AUDUSD, “Australian Dollar vs US Dollar”

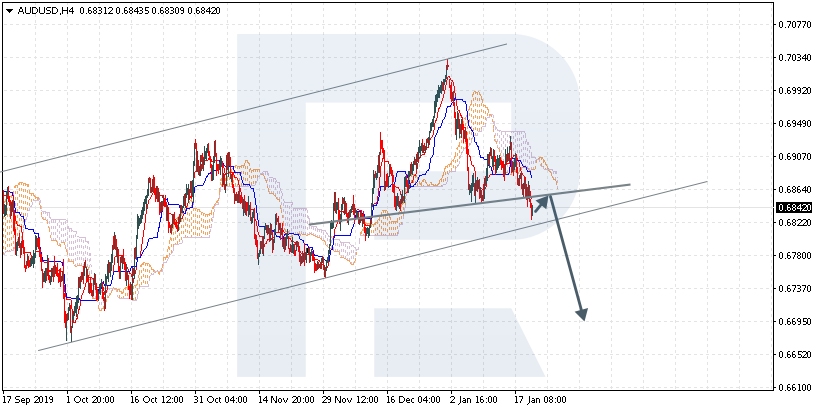
AUDUSD is trading at 0.6842; the instrument is moving below Ichimoku Cloud, thus indicating a descending tendency. The markets could indicate that the price may test Tenkan-Sen and Kijun-Sen at 0.6855 and then resume moving downwards to reach 0.6695. Another signal to confirm further descending movement is the price’s rebounding from the neckline of Head & Shoulders reversal pattern. However, the scenario that implies further decline may be canceled if the price breaks the cloud’s upside border and fixes above 0.6925. In this case, the pair may continue growing towards 0.7005. After breaking the rising channel’s downside border and fixing below 0.6805, the price may continue moving downwards.

AUDUSD
Risk Warning: the result of previous trading operations do not guarantee the same results in the future

NZDUSD, “New Zealand Dollar vs US Dollar”

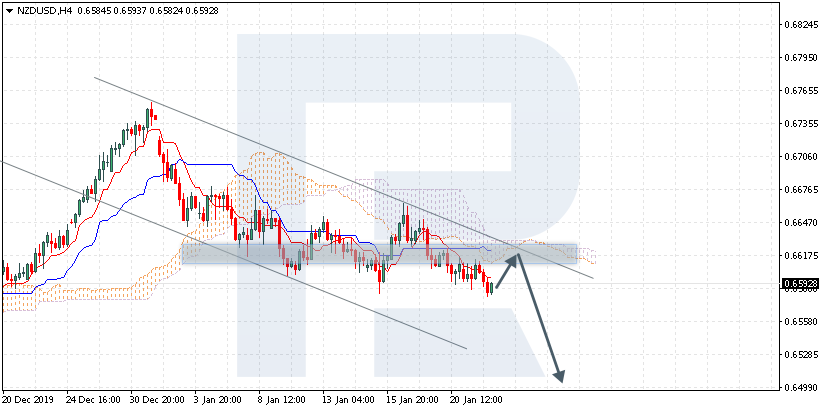
NZDUSD is trading at 0.6592; the instrument is moving below Ichimoku Cloud, thus indicating a descending tendency. The markets could indicate that the price may test the cloud’s downside border at 0.6620 and then resume moving downwards to reach 0.6500. Another signal to confirm further descending movement is the price’s rebounding from the resistance level. However, the scenario that implies further decline may be canceled if the price breaks the cloud’s upside border and fixes above 0.6645. In this case, the pair may continue growing towards 0.6735.

NZDUSD
Risk Warning: the result of previous trading operations do not guarantee the same results in the future

USDCAD, “US Dollar vs Canadian Dollar”

USDCAD is trading at 1.3080; the instrument is moving above Ichimoku Cloud, thus indicating an ascending tendency. The markets could indicate that the price may test the cloud’s upside border at 1.3055 and then resume moving upwards to reach 1.3175. Another signal to confirm further ascending movement is the price’s rebounding from Triangle’s upside border. However, the scenario that implies further growth may be canceled if the price breaks the cloud’s downside border and fixes below 1.3015. In this case, the pair may continue falling towards 1.2945.

USDCAD
Risk Warning: the result of previous trading operations do not guarantee the same results in the future

Japanese Candlesticks Analysis 22.01.2020 (USDCAD, AUDUSD)

Japanese Candlesticks Analysis 22.01.2020 (USDCAD, AUDUSD)

22.01.2020

USDCAD, “US Dollar vs Canadian Dollar”

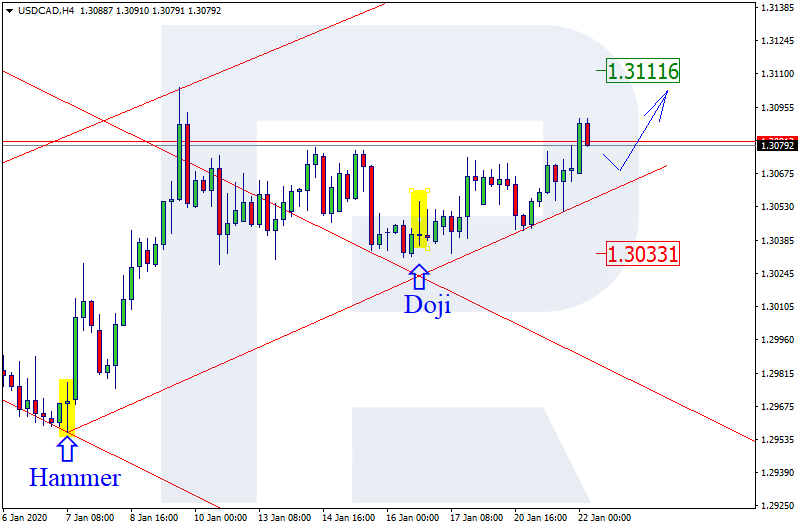
As we can see in the H4 chart, the sideways movement was followed by a slight growth. By now, the pair has finished several reversal patterns, including Doji. The current situation implies that USDCAD may continue reversing and then grow to reach 1.3111. However, we shouldn’t ignore an alternative scenario, according to which the instrument may fall towards 1.3033.

USDCAD
Risk Warning: the result of previous trading operations do not guarantee the same results in the future

AUDUSD, “Australian Dollar vs US Dollar”

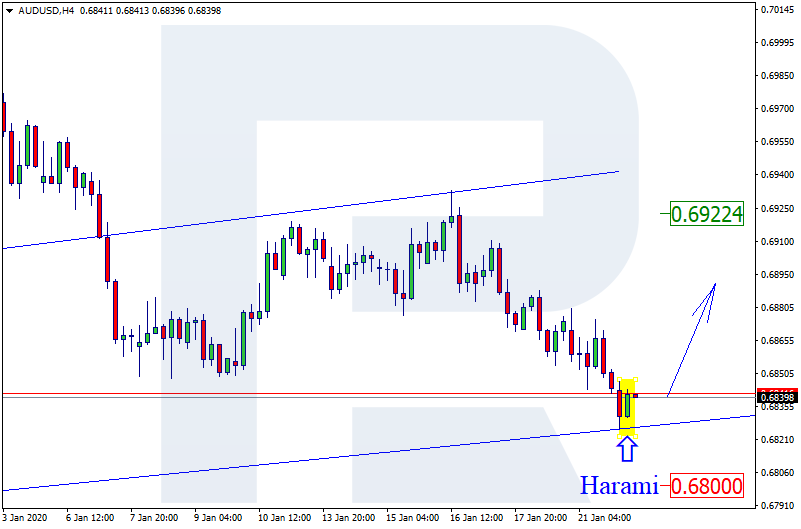
As we can see in the H4 chart, the pair has completed another decline: it has formed Harami reversal pattern not far from the support level. Right now, AUDUSD is starting to reverse; the upside target may be at 0.6922. However, we shouldn’t ignore an alternative scenario, which implies that the instrument may continue falling towards 0.6800.

AUDUSD
Risk Warning: the result of previous trading operations do not guarantee the same results in the future

Fibonacci Retracements Analysis 22.01.2020 (GBPUSD, EURJPY)

Fibonacci Retracements Analysis 22.01.2020 (GBPUSD, EURJPY)

22.01.2020

GBPUSD, “Great Britain Pound vs US Dollar”

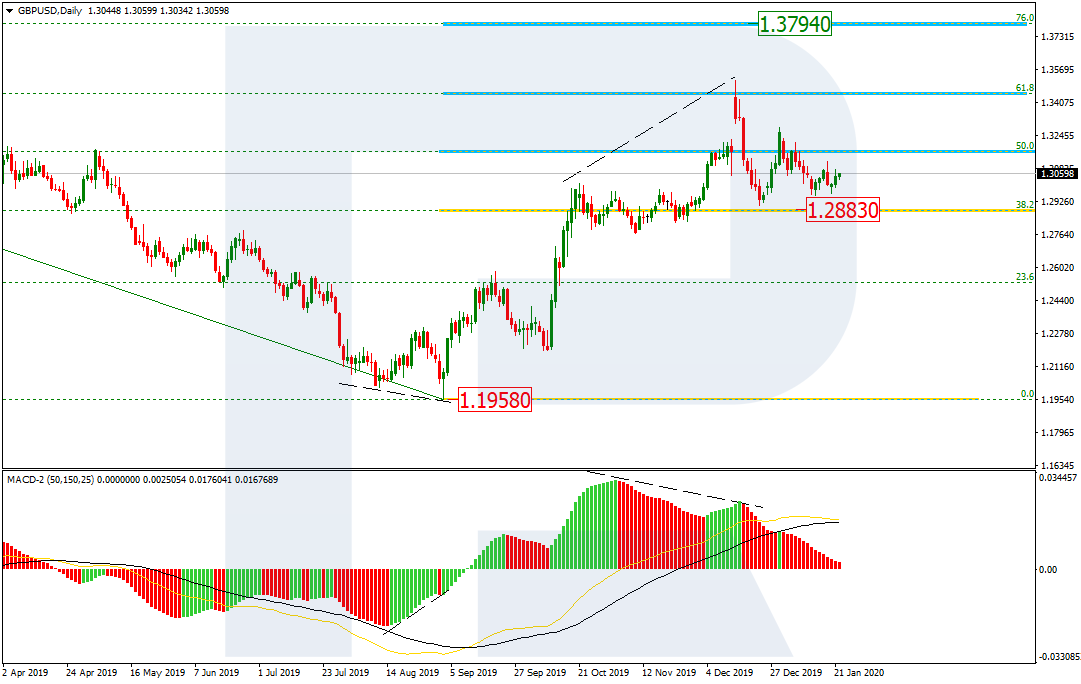
As we can see in the daily chart, GBPUSD is still correcting and forming Triangle pattern. The pair is stuck above the support at 38.2% (1.2883). If the price fails to break this level, it may start a new rising impulse to break the high at and reach mid-term 76.0% fibo at 1.3794.

GBPUSD_D1
Risk Warning: the result of previous trading operations do not guarantee the same results in the future

The H4 chart shows that the correction has stopped at 38.2% fibo. If the price breaks the local low at 1.2904, the pair may continue falling towards 50.0% and 61.8% fibo at 1.2856 and 1.2700 respectively.

GBPUSD_H4
Risk Warning: the result of previous trading operations do not guarantee the same results in the future

EURJPY, “Euro vs. Japanese Yen”

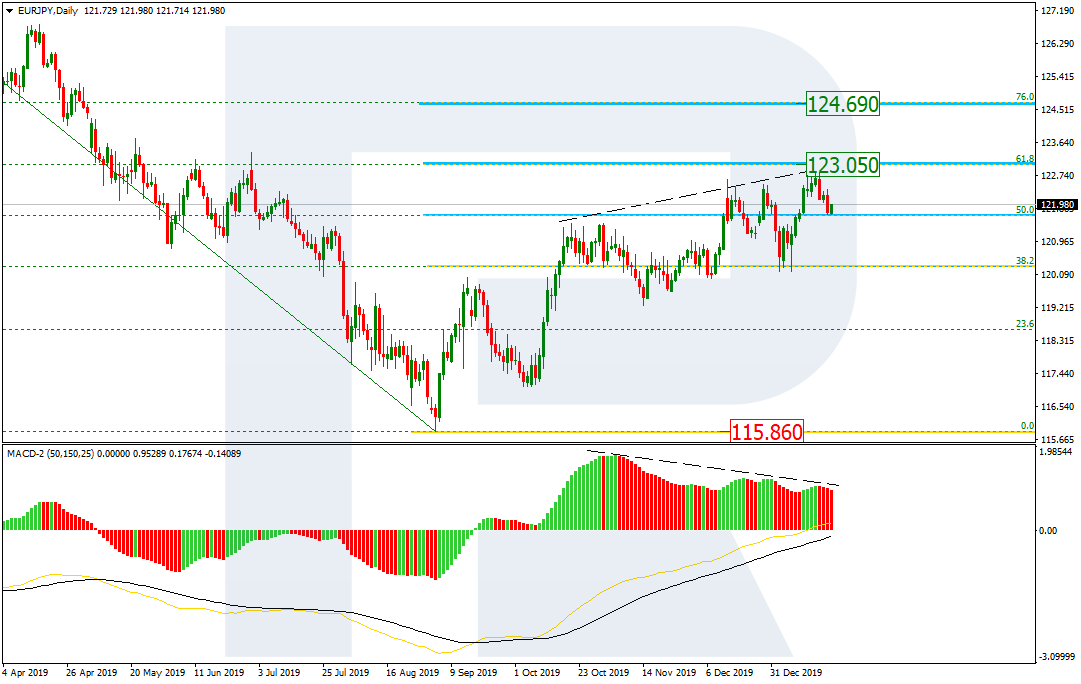
In the daily chart, after updating the previous high and failing to reach 61.8% fibo at 123.05, the pair has started a new pullback towards 50.0% fibo. Despite the divergence on MACD, it’s too early to think about the trend reverse, at least as long as EURJPY is trading above the support. It means that this decline should be considered as a new short-term correction, which may be followed by further growth towards 61.8% and 76.0% fibo at 123.05 and 124.69 respectively.

EURJPY_D1
Risk Warning: the result of previous trading operations do not guarantee the same results in the future

The H4 chart shows that the pair is moving downwards to reach 38.2%. However, if the price falls towards 23.6% fibo at 121.21, the decline may continue to reach 38.2% and 50.0% fibo at 120.19 and 119.36 respectively. If the price breaks the resistance at 122.87, the mid-term growth will continue.

EURJPY_H4

Murrey Math Lines 20.01.2020 (EURUSD, GBPUSD)

Murrey Math Lines 20.01.2020 (EURUSD, GBPUSD)

20.01.2020

EURUSD, “Euro vs. US Dollar”

In the H4 chart, EURUSD is still consolidating. In this case, the price is expected to break 3/8 and then continue trading downwards to reach the support at 1/8. However, this scenario may no longer be valid if the price breaks 4/8 to the upside After that, the instrument may continue growing towards the resistance at 5/8.

EURUSD_H4
Risk Warning: the result of previous trading operations do not guarantee the same results in the future

As we can see in the M15 chart, the pair has broken the downside line of the VoltyChannel indicator and, as a result, continue moving downwards to reach 1/8 from the H4 chart.

EURUSD_M15
Risk Warning: the result of previous trading operations do not guarantee the same results in the future

GBPUSD, “Great Britain Pound vs US Dollar”

In the H4 chart, GBPUSD is moving below 3/8. In this case, the price is expected to break 1/8 and then continue falling towards the support at -2/8. However, this scenario may no longer be valid if the price breaks the resistance at 2/8 to the upside. After that, the instrument is expected to continue growing to reach the 5/8.

GBPUSD_H4
Risk Warning: the result of previous trading operations do not guarantee the same results in the future

As we can see in the M15 chart, the pair has broken the downside line of the VoltyChannel indicator and, as a result, may continue trading downwards to reach -2/8 from the H4 chart.

GBPUSD_M15
Risk Warning: the result of previous trading operations do not guarantee the same results in the future

Ichimoku Cloud Analysis 20.01.2020 (AUDUSD, NZDUSD, USDCAD)

Ichimoku Cloud Analysis 20.01.2020 (AUDUSD, NZDUSD, USDCAD)

20.01.2020

AUDUSD, “Australian Dollar vs US Dollar”

AUDUSD is trading at 0.6884; the instrument is moving below Ichimoku Cloud, thus indicating a descending tendency. The markets could indicate that the price may test the cloud’s downside border at 0.6905 and then resume moving downwards to reach 0.6775. Another signal to confirm further descending movement is the price’s rebounding from the resistance level. However, the scenario that implies further decline may be canceled if the price breaks the cloud’s upside border and fixes above 0.6945. In this case, the pair may continue growing towards 0.7025.

AUDUSD
Risk Warning: the result of previous trading operations do not guarantee the same results in the future

NZDUSD, “New Zealand Dollar vs US Dollar”

NZDUSD is trading at 0.6620; the instrument is moving below Ichimoku Cloud, thus indicating a descending tendency. The markets could indicate that the price may test the cloud’s downside border at 0.6630 and then resume moving downwards to reach 0.6540. Another signal to confirm further descending movement is the price’s rebounding from the descending channel’s upside border. However, the scenario that implies further decline may be canceled if the price breaks the cloud’s upside border and fixes above 0.6690. In this case, the pair may continue growing towards 0.6775.

NZDUSD
Risk Warning: the result of previous trading operations do not guarantee the same results in the future

USDCAD, “US Dollar vs Canadian Dollar”

USDCAD is trading at 1.3063; the instrument is moving above Ichimoku Cloud, thus indicating an ascending tendency. The markets could indicate that the price may test the cloud’s upside border at 1.3045 and then resume moving upwards to reach 1.3175. Another signal to confirm further ascending movement is the price’s rebounding from the support level. However, the scenario that implies further growth may be canceled if the price breaks the cloud’s downside border and fixes below 1.3005. In this case, the pair may continue falling towards 1.2935. After breaking Triangle’s upside border and fixing above 1.3090, the price may continue moving upwards.

USDCAD