Fibonacci Retracements Analysis 26.12.2019 (AUDUSD, USDCAD)
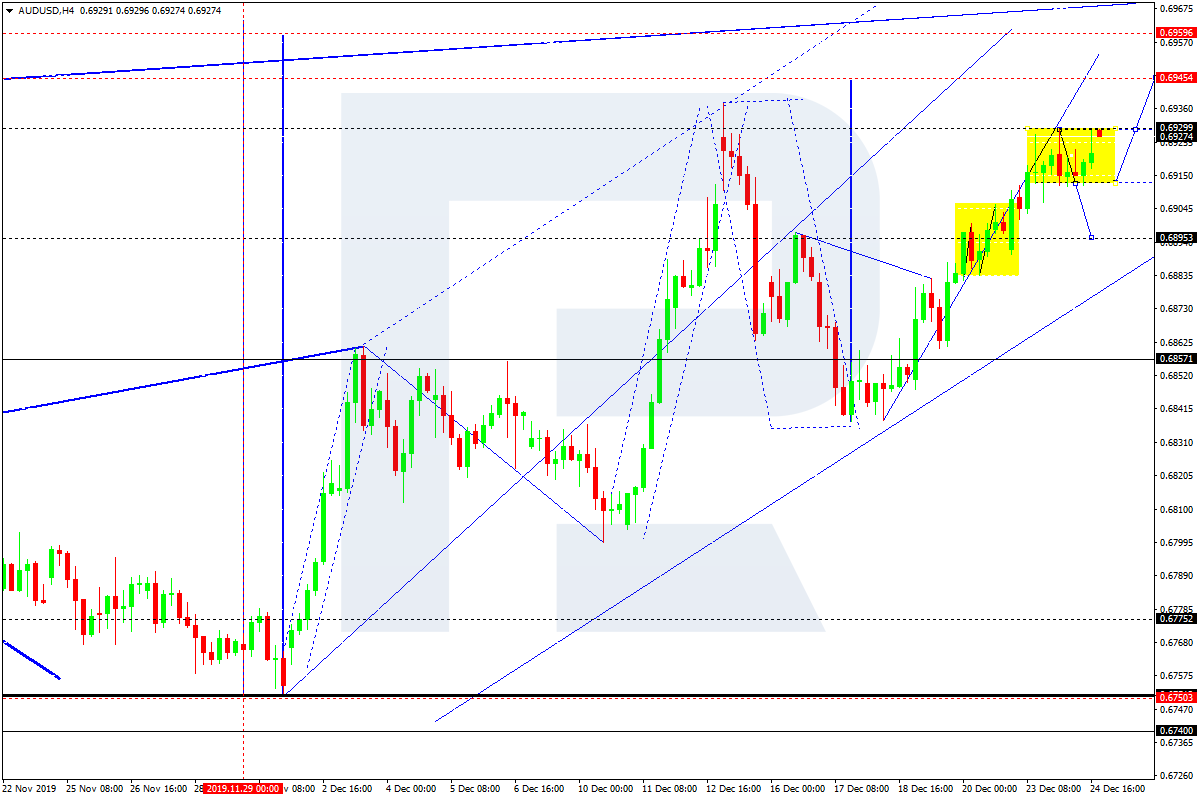
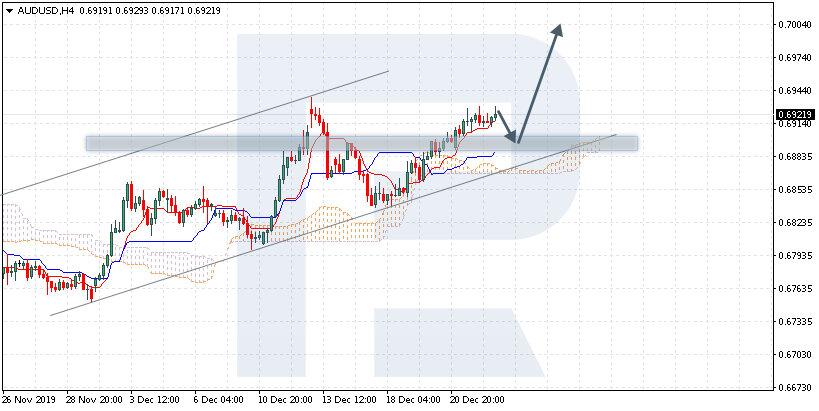
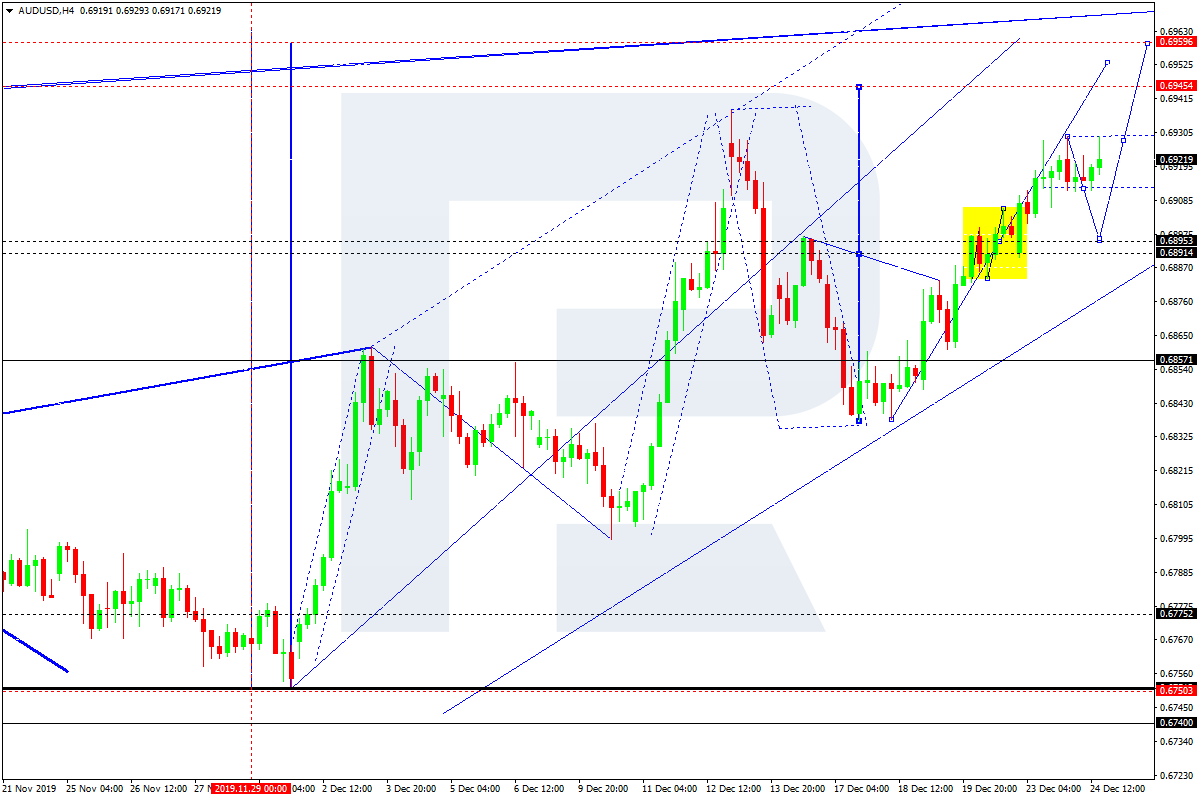
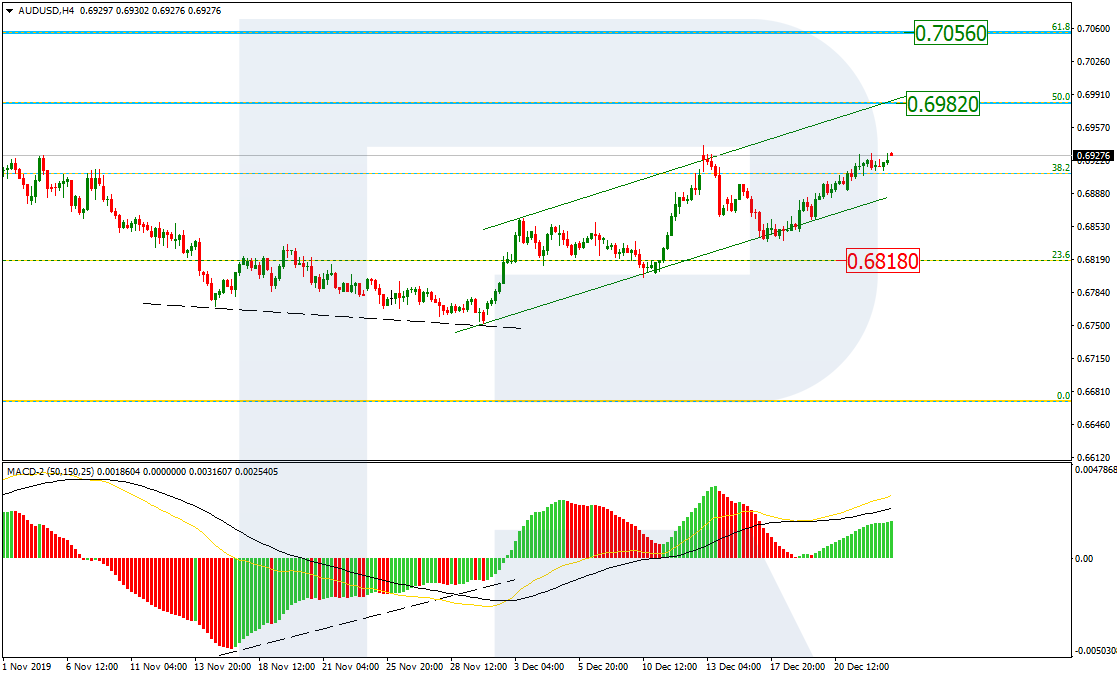
AUDUSD, “Australian Dollar vs US Dollar”
As we can see in the H4 chart, after completing the correction, AUDUSD is forming another ascending impulse. If the price breaks the high, the instrument may continue growing to reach 50.0% and 61.8% fibo at 0.6982 and 0.7057 respectively. The support is still 23.6% fibo at 0.6818.

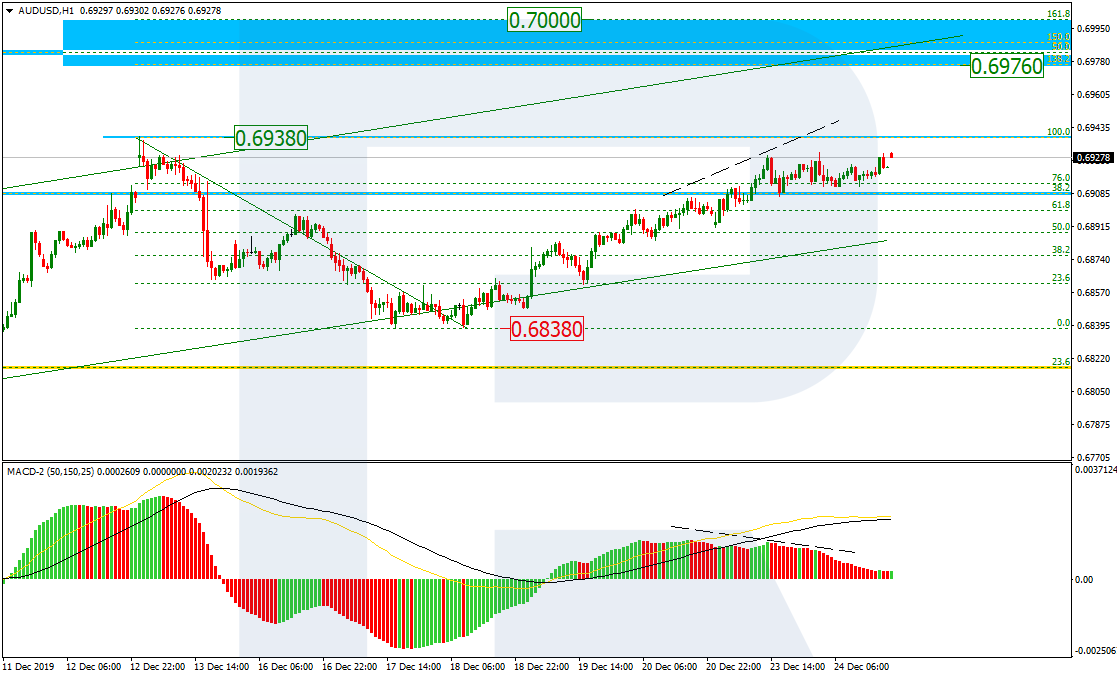
In the H1 chart, the price is approaching the high at 0.6938 for testing or maybe even breaking it. If it happens, the pair may continue moving towards the post-correctional extension area between 138.2 and 161.8% fibo at 0.6976 and 0.7000 respectively. At the same time, there is a divergence on MACD, which may indicate a new pullback after the instrument rebounds from the high. The local support is at 0.6838.
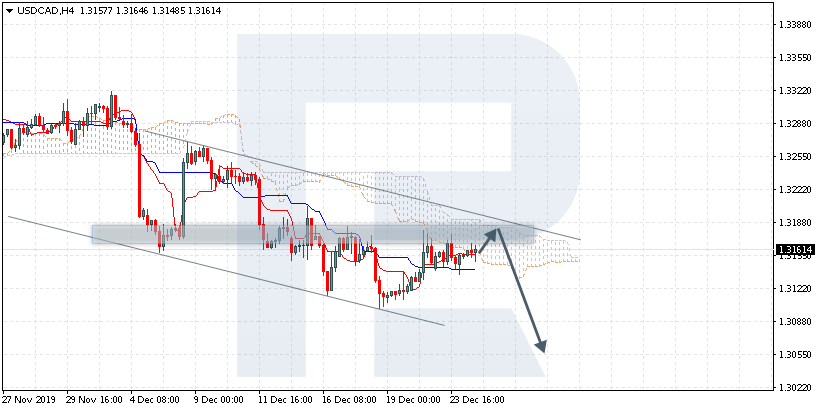
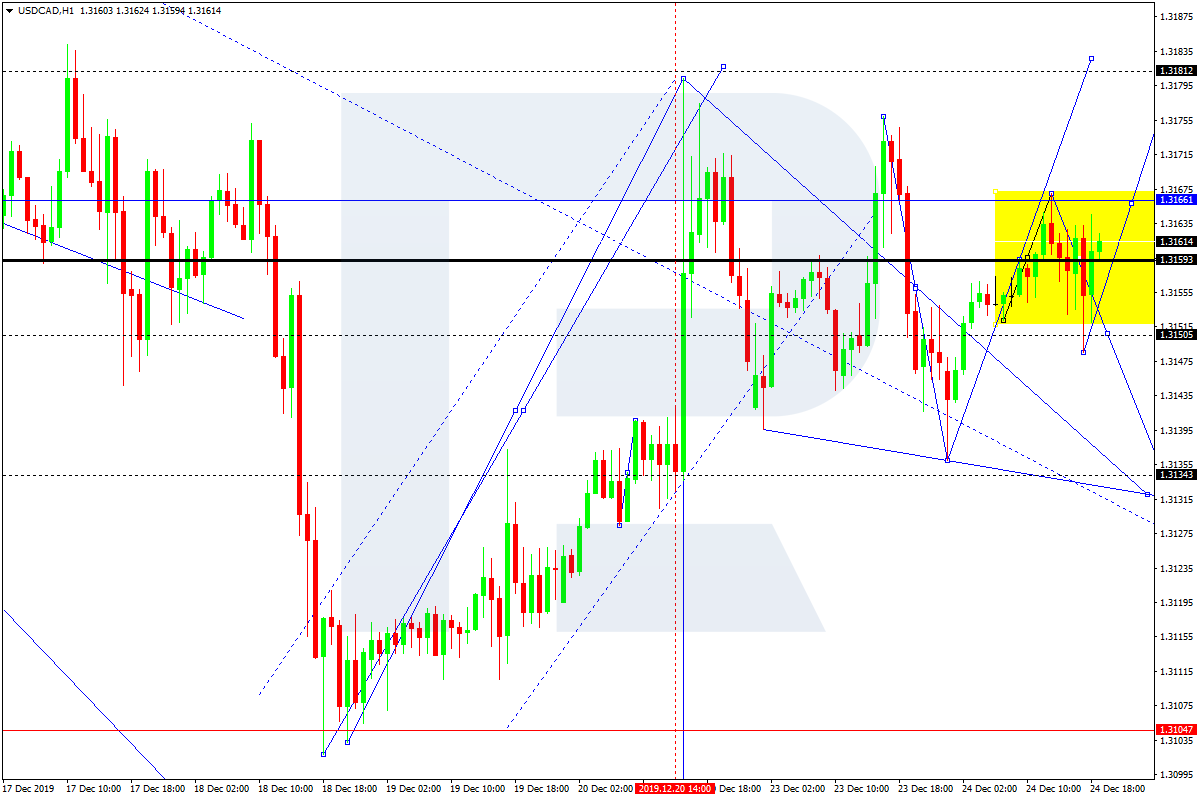
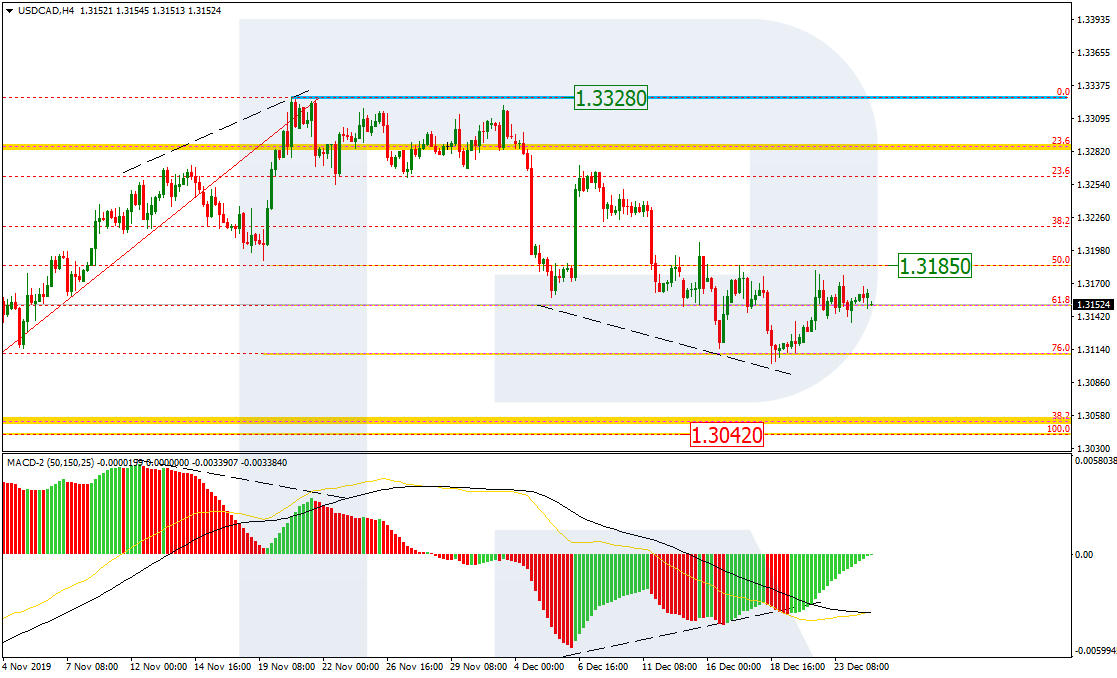
USDCAD, “US Dollar vs Canadian Dollar”
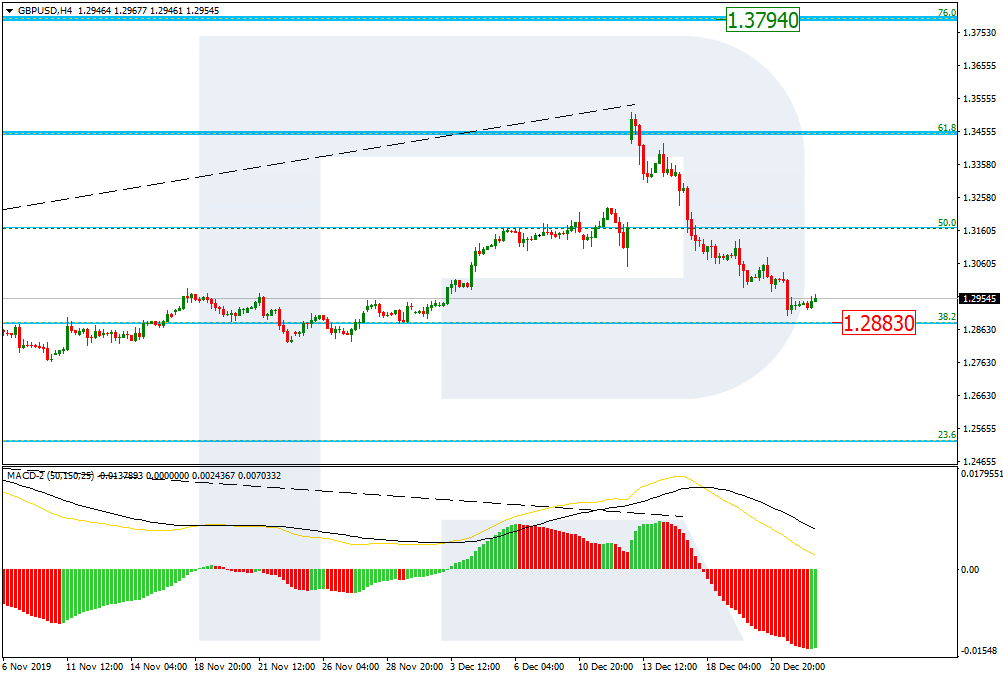
As we can see in the H4 chart, the bearish tendency reached 76.0% fibo. However, then there was a convergence on MACD, which made the pair start a new pullback towards 50.0% at 1.3185. The correction may yet continue for some time, but later the instrument is expected to resume its decline to reach the low at 1.3042 or fall even deeper.
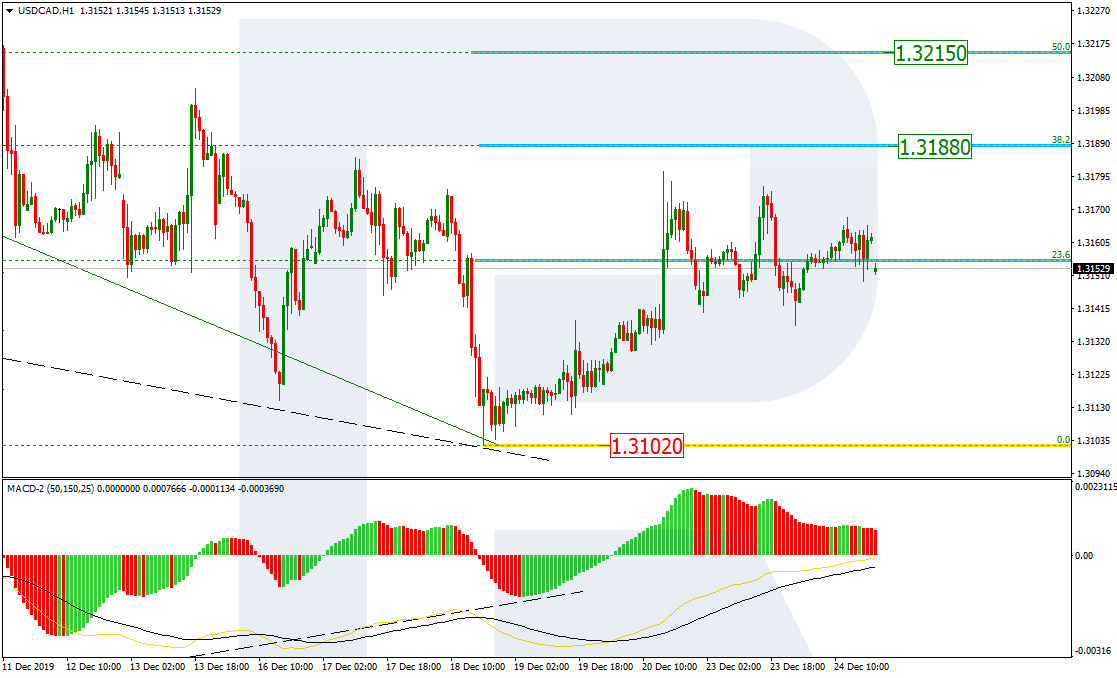
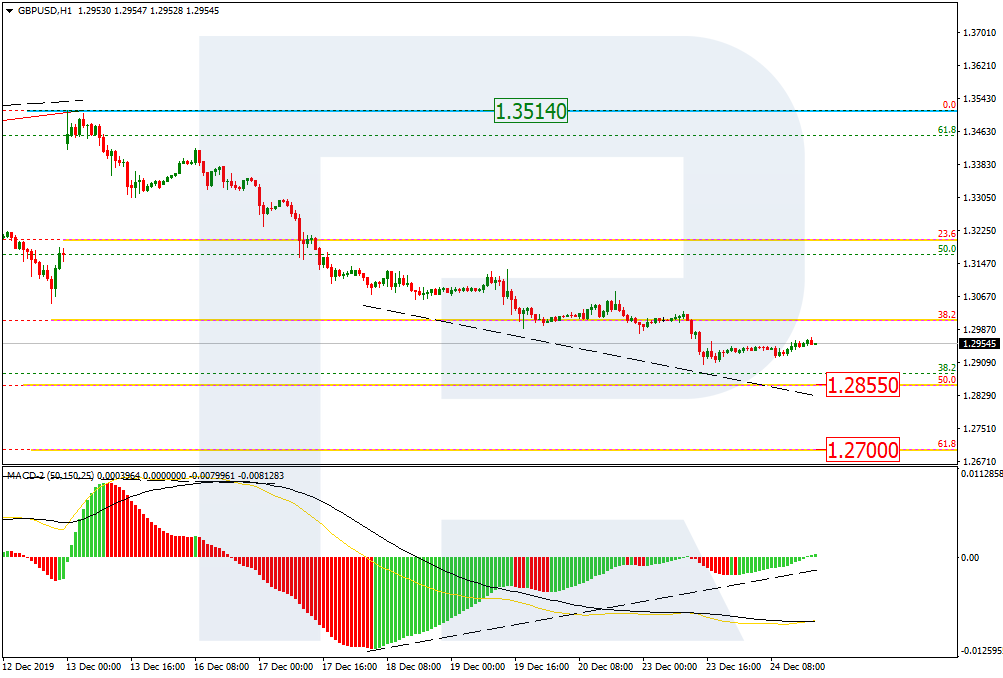
The H1 chart shows more detailed structure of the current correction after the convergence. After reaching 38.2% fibo at 1.3188, the first ascending wave reversed to return to 23.6% fibo. However, as long as the price doesn’t break the low at 1.3102, the correction may continue. That’s why, the next rising wave will be heading towards 50.0% fibo at 1.3215.