rfxsignals April 3, 2020 No Comments

Overbought/Oversold Forex Daily Trading Strategy

Overbought/Oversold Forex Daily Trading Strategy

The daily timeframe gives an opportunity for longer-term traders to profit from the Forex market. The following strategy is to be used on the daily chart only, on which it can generate great trading opportunities and profits.

Since it is based on a relatively large timeframe, patience will be needed when trading this strategy as not many trades will be generated compared to trading strategies based on smaller timeframes. The advantage is that the strategy is very simple and almost anyone can use it to take trades and profit with it.

It consists of several simple rules which when followed will provide good trades and offer the potential for profit. It’s recommended to use it on the major pairs only because chart patterns work better due to the good liquidity and volume on these currency pairs. The strategy can be enhanced by combining it with other tools and indicators as we shall see later in this article.

Four trades that were generated by this strategy are shown on the chart below.

Forex Daily Chart Trading Strategy

Overbought/Oversold Forex Daily Trading Strategy

The vertical lines indicate the generated trades with this strategy from entry to exit (marked as “LONG” and “SHORT” on the chart) – EURUSD Daily Timeframe

Indicators to be used:

  • Bollinger Bands with standard settings (Blue lines on the chart) –Period – 20, Standard Deviation – 2

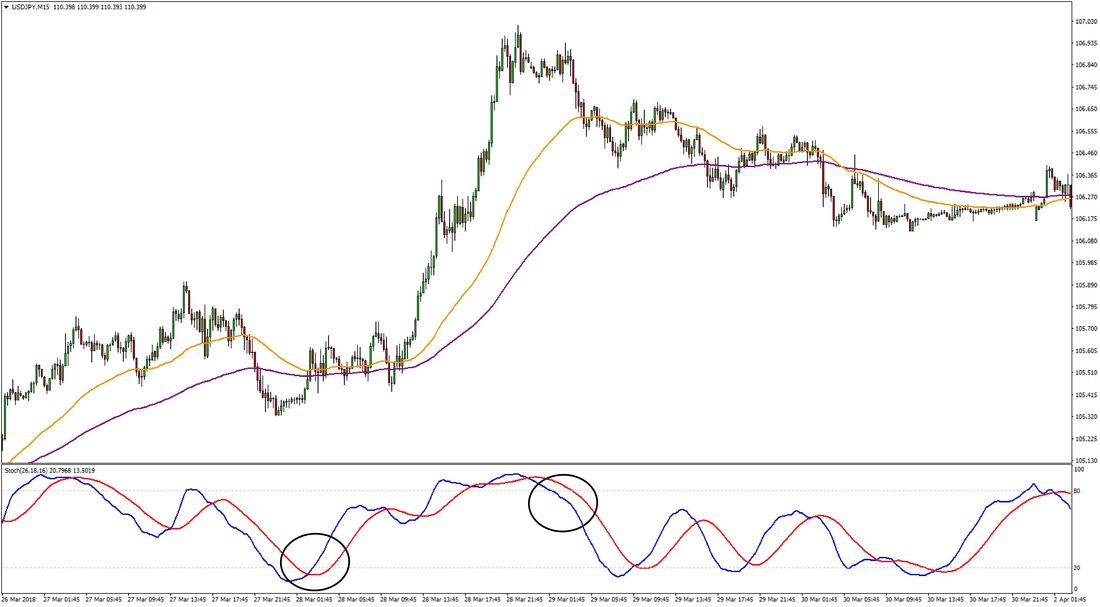
The Stochastic oscillator can also be used to get an additional perspective on the momentum in the market but is not necessary for this strategy. A “nice” bullish or bearish crossover from inside the oversold or overbought area on the Stochastic can be additional confirmation that a trade setup is a good opportunity to buy or sell.

Trading conditions of the strategy:

Long trade entry:

  • Wait for FxTR overbought/oversold indicator to fall in the oversold area and the line to turn green – this is an indication that buying opportunities will probably exist
  • Wait for price to be at the lower band of the Bollinger Bands indicator

Long trade stop loss:

  • Place the stop below the bullish reversal pattern

Long trade exit and targets:

  • 1st target – the middle line of the Bollinger Bands indicator
  • 2nd target – the opposite end of the Bollinger Bands indicator (upper line)

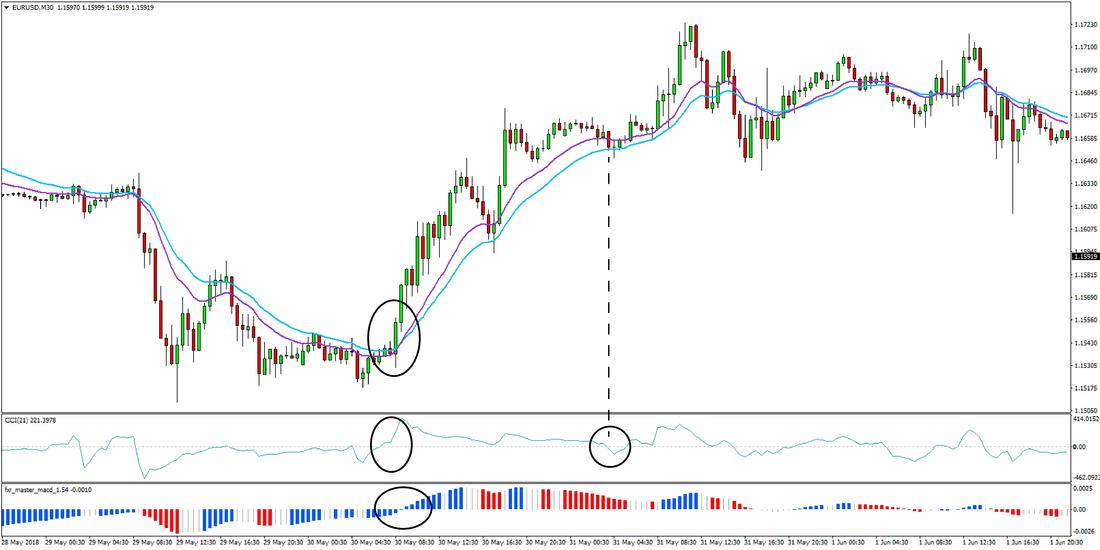
The chart below shows an example of a long trade taken with this Forex strategy

Forex strategy daily timeframe

Overbought/Oversold Forex Daily Trading Strategy

The two sections indicated by the vertical lines on the chart show two buy trades that were generated with this Forex strategy – GBPUSD Daily timeframe
Short trade entry:

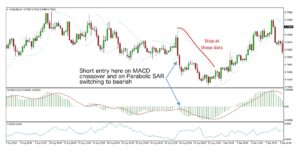
  • Wait for FxTR overbought/oversold indicator to enter the overbought area and the line to turn red – indicating that we should look for bearish trading opportunities
  • Wait for price to be at the upper band of the Bollinger Bands indicator
  • Enter when a bearish candlestick pattern forms on the chart

Short trade stop loss:

  • Place the stop above the bearish reversal pattern

Short trade exit:

  • 1st target – the middle line of the Bollinger Bands indicator
  • 2nd target – the opposite end of the Bollinger Bands indicator (lower line)

Here’s an example of a short trade:

Picture

Overbought/Oversold Forex Daily Trading Strategy

The section between the two vertical lines show a sell trade generated by this strategy – USDJPY Daily Timeframe

Things to keep in mind when trading with this Forex strategy:

  • Since this strategy is based on the daily timeframe it will need relatively larger capital due to the usual size of the stops. This has to be taken into consideration from a risk management perspective.
  • During strong trends in the market, the price can take a path of “walking the bands”. This can occur either with the upper or lower Bollinger Band and essentially, the price doesn’t reverse even though it stays at the Bollinger Bands for several trading sessions in a row. Such situations can be the cause for unprofitable trades with this strategy, however, even in such cases of “waling the bands”, the probability that a reversal candlestick pattern will form during a strong trend is very low, so essentially this is the advantage of the strategy. Thus, when a reversal pattern does actually form at one of the Bands, it will likely be followed by at least a few more candles of consolidation if not a full reversal.
  • The Bollinger Band is a dynamic indicator, so this is an aspect that must be taken into account. That is, the distance to the profit targets will change with every new bar, so that means that the profit targets should be updated accordingly. Sometimes this may result in trades with very small to near breakeven profit or no profit at all. What is important, however, is that the signals generated with this strategy accurately predict tops and bottoms, so in most cases, the trades will offer nice profits.
rfxsignals April 3, 2020 No Comments

Pullback Forex Trading Strategy

​Pullbacks are common occurrences in the forex market and they present profit-making opportunities for traders who know how to successfully trade them. A pullback occurs whenever a breakout occurs at a strong resistance or support level (trendline or any chart formation) and then the market moves in a direction that goes against the general trend (and the original breakout) to retest the level of the support or resistance level or chart formation once again.
Pullback Forex Trading Strategy

​The pullback may be downward or upward depending on the direction of the breakout and the general trend. If the general trend is downward, the pullback will be upward and vice versa. A pullback may also be referred to as a retracement. Traders who understand how pullbacks work can trade them profitably and avoid making unnecessary losses.

​How Forex Traders Can Benefit from Pullbacks

Forex traders may use pullbacks to lessen the risks of entering the market at a bad time. This is because pullbacks tend to occur at key levels of support or resistance which are areas at which the market is likely to turn and move in the opposite direction.

A pullback usually represents a significant move in the opposite direction to the general trend (and the previous breakout) which presents a profit-making opportunity.

​The likelihood of entering the trade at a good time is more likely to occur when the trade is entered at a possible pullback point (after the price retests the broken S/R zone and confirms the breakout). Since the pullback confirms the breakout, the potential to profit is great – like you can see below.

Pullback Forex Trading Strategy

Market Trend and Pullbacks

One of the keys to profiting from pullbacks is first ascertaining whether the overall trend is a strong one or not. The stronger the trend, the more likely a trader is to profit from a pullback.

​Once a strong trend is identified, the forex trader should then identify key levels of support and resistance and then look for any breakout points. Once a breakout occurs, a pullback is very likely to occur.

However, vertical price action is necessary if a pullback is to occur which means that the price must clearly move consistently upward or downward rather than sideways. This means that consolidation should not occur or that it should be short-lived.

Below is an example where GBPUSD slowed down after the breakout and moved sideways little bit. But still it is just unbelievable how the broken resistance zone reversed to a strong support zone. This is a nice example of the breakout followed by the pullbacks (retests of the S/R zone). Bullish pullbacks are also often referred to as throwbacks.

Bullish Pullback = Throwback

Pullback Forex Trading Strategy

Confirmation of a Pullback

Cross-verification is an important signal after the pullback is well underway. Cross-verification is verification of a pullback based on several different trading patterns or indicators such as Fibonacci retracements, and moving averages simultaneously confirming that a pullback is in fact underway. Especially the 50% Fibonacci retracement level is usually a good place to make an entry on a pullback. You should then trade in the direction of the general trend in order to profit from that trade.

Based on our experience, candlestick patterns usually work the best when it comes to confirming the pullbacks. A great example can be seen below. Note how EURUSD broke the support zone with the runaway gap – confirming that there is a strong bearish sentiment. Then absolutely accurate pullback together with the Outside Bar pattern followed. This was a great pullback opportunity.

EURUSD - Pullback, Outside Bar and Runaway Gap

Pullback Forex Trading Strategy

Once a pullback is confirmed, it indicates that the market will return to the general trend sooner or later (in the direction of the breakout). It is a good idea to place take profits at points where price faces a barrier after rapidly moving in the expected direction. Barriers could be points such as major swing highs or major swing lows (supports and resistances). Stop-Losses should be placed a few pips below or above a cross-verification level or a candlestick pattern.
​​
Pullbacks present great profit-making opportunities for forex traders. The key is to identify when a pullback is underway and to enter and exit the trade at strategic points.
rfxsignals April 3, 2020 No Comments

Best 4-hour RSI Forex Trend Trading Strategy

Best 4-hour RSI Forex Trend Trading Strategy

This is a powerful trading strategy that works very well during strong market trends and can offer excellent rewards.

Most importantly, due to the accuracy of the indicators used and the conditions under which they are used, this strategy enables traders to enter only the best and strongest Forex trends out of which the best trading opportunities are filtered out and considered for taking a trade. It may not generate as many trades as other strategies, but trades which are generated are with a higher degree of accuracy.

It’s easy to implement and to use this strategy. It doesn’t require expert knowledge of the markets or extensive understanding of technical analysis principles. The strategy can be applied on all currency pairs with pretty much the same performance/results. It also works well on different timeframes, but the 4-hour chart has shown the most profitable results.

On the chart below, we show a real Forex example of how this strategy based on the FxTR Improved RSI indicator and two EMAs looks on the charts:

RSI Forex 4-hour Trading strategy

Best 4-hour RSI Forex Trend Trading Strategy

The entry is at the vertical line on the left, while the exit is at the vertical line on the right (yellow MA starts to slope upwards) – A short trade example that resulted in a profit of over 300 pips on the CHFJPY 4h chart

Indicators to be used:

Three indicators are needed to trade this strategy:

  • 30 period exponential moving average (yellow on the charts)
  • 60 period exponential moving average  (blue on the charts)
  • The FxTR improved RSI indicator (Download for free here) – Created by the Fx Trading Revolution Team, this RSI-based indicator is very effective in predicting longer-term trends

Trading conditions and rules of the strategy:

Long trade entry:

  • Wait for the 30 period moving average (yellow) to cross above the 60 period moving average (blue)
  • Ensure that both moving averages are sloping upwards
  • The 30 period moving average (yellow) is sloped at an angle of 20 degrees or higher – No exact measurement is necessary here, but a subjective estimate is good enough
  • Look for a blue arrow to appear on the RSI indicator after the 3 criterions for the moving averages are met
  • Once all of the above conditions are satisfied, a long trade can be taken

 
Long trade stop loss:

  • Place stop below the 60 period moving average (blue)
  • Trail the stop behind the 60 period moving average as the market ascends higher

Long trade exit:

  • Hold trade for as long as the RSI shows a blue (bullish) signal
  • Close the trade if the yellow moving average starts to slope down
  • Or if the RSI turns bearish (red)
Forex 4-hour swing trading strategy

Best 4-hour RSI Forex Trend Trading Strategy

A long trade generated on the GBPCAD 4-hour chart – The entry signal is shown with the vertical line on the left and the exit signal is shown with the vertical line on the right
Short trade entry:

  • Wait for the 30 period moving average (yellow) to cross below the 60 period moving average (blue)
  • Ensure that two moving averages are sloping down
  • The 30 period moving average (yellow) is sloped down at an angle of 20 degrees or steeper – No exact measurement is necessary here, but a subjective estimate is good enough
  • Look for a red arrow to appear on the RSI indicator after the 3 criterions for the moving averages are satisfied
  • Once all of the above conditions are fulfilled, a short trade can be taken

Short trade stop loss::

  • Place stop above the 60 period moving average (blue)
  • Trail the stop behind the 60 period moving average as the market descends lower

Short trade exit:

  • Hold trade for as long as the RSI shows a red (bearish) signal
  • Close the trade if the yellow moving average starts to slope upward
  • Or if the RSI turns bullish (blue)
RSI EMA swing trading strategy 4-hour

Best 4-hour RSI Forex Trend Trading Strategy

The sell signal is shown with the vertical line on the left and the exit signal is shown with the vertical line on the right – EURUSD 4-hour chart

Core principles to remember for this Forex trading strategy:

  • Trading signals from the RSI should be ignored if the conditions of the moving averages are not satisfied first. That is, for a bullish signal of the RSI to be valid the 30 period (yellow) MA should be above the 60 period (blue). For a sell signal from the RSI to be valid, the 30 period should be below the 60 period moving average. This significantly helps to filter out noise moves in the market and reduce whipsaw signals that will result in bad trades. Thus, the overall performance of the strategy and the final results are improved by a marked level just by using this specific combination of the indicators.
  • It is recommended to lock in some profits from time to time. It’s not always necessary to wait for an exit signal from the indicators to close a part of the position. Since this is a trend trading strategy, the exit signal generated by the RSI and moving averages will tend to eat into the profits to some degree. Using some leading indicators like Fibonacci retracements or support and resistance zones from higher (like the daily or weekly charts) can help you to lock in partial profits at key technical levels just in case if the market suddenly reverses. In this way, the trader still gets to keep some of the profits in such cases.
  • This strategy doesn’t use profit targets because it tries to capitalize on trends which can last for an undetermined time and distance on the charts. Hence, for a trending market environment, it’s usually better to just trail the stop behind the price instead of using fixed profit targets. Very often the profit targets are exceeded in trending markets so constantly using them can actually reduce the profits for the trader in the end.
rfxsignals April 3, 2020 No Comments

Trading the Flag and the Wedge Chart Patterns

Trading chart patterns is about profiting from repeated occurrences in the markets that are known to yield a certain kind of results over and over again.

As with anything in technical analysis, it’s always good to combine chart patterns with other tools like support and resistance to filter out the best setups. The flag and the wedge are two very popular chart patterns among traders, and they both have their bullish and bearish versions.

Trading the Flag and the Wedge Chart Patterns

Continuation Pattern: The Flag

The flag is a trend continuation pattern and takes place during the consolidation phases of the trend, and therefore it gives traders a wonderful opportunity to join the trend in a high probability manner.

The flag is a formation on the charts with two horizontal or rising parallel trendlines in a bearish flag, and two falling or horizontal parallel trendlines in a bullish flag.

A falling flag (bullish) occurs during an uptrend and a rising flag (bearish) will occur during a downtrend.

Flags will usually form after a sharp move in the market and most often because of overbought or oversold levels. With the flag formation the market sort of digests the previous sharp move and is ready to continue the trend for another swing.

The breakout of the flag is our signal to join the trend and enter a trade.

Entry rules:

  1. Find a strong trending swing on the chart.
  2. Identify a flag (as shown on the chart) and wait for a breakout of the flag in the direction of the preceding trend.
  3. After the breakout occurs enter a trade in the direction of the previous trend.
  4. Do not enter if price breaks out in the opposite direction. In such cases, it’s better to stand aside and don’t trade.

Initial stop placement:    

  • behind the last swing high (in a bearish flag) or
  • behind the last swing low (in a bullish flag).

bullish-flag-h4_orig (1)

Bullish flag on EURUSD 4h chart
Managing the trade:

  • If price returns inside of the flag after breaking out then the whole trade idea would become invalid and the trade should be closed.
  • After price moves in your favor by the amount of the stop loss, move the stop to breakeven.
Bearish flag on EURGBP 4h chart

Trading the Flag and the Wedge Chart Patterns

Bearish flag on EURGBP 4h chart
​Profit targets:
To calculate profit targets measure the height of the most recent previous swing in the direction of the trend

  • First target is 1x the height of the swing
  • Second target is 2x the height of the swing
  • Third extended target is 3x the height of the swing

Note: If present, important support or resistance levels (especially from higher timeframes) on the way of the trade should be viewed as targets themselves.

Reversal pattern: The Wedge

When you spot a wedge on the charts pay attention because it almost certainly is a signal of the trend ending and a violent reversal coming.

The wedge is a formation on the charts with two rising trendlines in a rising wedge and two falling trendlines in a falling wedge.

A rising wedge forms in uptrends and is a signal of a bearish reversal, while a falling wedge forms during downtrends and signals that a rebound in prices is likely to occur soon.

So, the trend still continues in a wedge formation however at a slower rate. The trendlines that limit the price swings in a wedge are sloped in the same direction (up or down) and contract into one another hence leading to choppy price action inside of the wedge.

Most often the reason for a wedge forming is an exhaustion of the trend, an oversold or overbought market and change in underlying market sentiment. Volatility will also tend to drop in wedge before expanding again when the price breaks out of the wedge.

How to trade it?

Entry rules:

  1. Identify a wedge (as shown on the chart) and wait for a breakout of the wedge in the counter-trend direction.
  2. After the breakout occurs we can enter a trade either on a close outside of the wedge or simply open a trade at the market price as soon as the price breaks out.
  • Keep in mind though, the second tactic is riskier!
  • Note: It’s also a good idea to keep check of the fundamentals when the breakout occurs. Try to find out why the breakout happened and if a major shift in fundamentals caused it. This can help you avoid fakeouts which happen quite often in the Forex market.
An example of a rising wedge on AUDUSD 1h chart

Trading the Flag and the Wedge Chart Patterns

An example of a rising wedge on AUDUSD 1h chart
In the AUDUSD case on this example, the price violently broke through the lower trendline of the wedge. There were fundamental reasons for this breakout (a Fed rate hike) and that gives us greater confidence that the downtrend will last for a longer time, as was the case here.

Initial stop placement:

  • behind the last swing high (in a bearish rising wedge) or
  • behind the last swing low (in a bullish falling wedge).
Falling wedge on the EURGBP 1h chart

Trading the Flag and the Wedge Chart Patterns

Falling wedge on the EURGBP 1h chart
Managing the trade:

  • If price returns inside of the wedge after breaking out then the trade scenario of a wedge would become invalid and the trade should be closed.
  • After price moves in your favor by the amount of the stop loss, move the stop to breakeven.

Profit targets:

To calculate profit targets measure the width of the wedge at its starting point

  • The first target is 1x the width of the wedge
  • The second target is 2x the width of the wedge
  • The third extended target is 3x the width of the wedge

Note: If present, important support or resistance levels (especially from higher timeframes) on the way of the trade should be viewed as targets themselves.

rfxsignals April 3, 2020 No Comments

Trend Trading with the ADX and the Parabolic SAR

This strategy is designed to profit on joining already existing trends in the market and rests on two indicators developed by Welles Wilder – a great technical market analyst and inventor of technical indicators.

The indicators we will use for this strategy are the 14-period ADX and the Parabolic SAR, both widely popular and extensively used in trading the markets.

Trend Trading with the ADX and the Parabolic SAR

The ADX is a unique indicator that shows the characteristics of a particular trend. The ADX tells us when there is a trend and also when there is no trend, so we know when to use a trend following strategy and when to use a range trading strategy.

For this trend-following strategy, we’ll look for the ADX to signal trending market conditions.

First, it’s important to understand how the ADX works. The ADX line only shows how much the market is trending at the moment, regardless of direction. So whether it’s a bearish or bullish trend the ADX line will go up if the trend steepens. An ADX value of 25 or greater indicates trending markets while an ADX reading of 20 or below indicates ranging markets.

Now, the ADX has two other lines in addition to the ADX line, the +DI line and the –DI line. It is these lines of the ADX indicator that show the direction of the trend. When the +DI line is above the –DI line the trend is bullish and when the –Di line is above the +DI line the trend is bearish.

We’ll look at some examples below to show how all this works.

We will use the Parabolic SAR as the trigger signal alongside with the +DI and –DI lines to initiate new positions.

Of course, as with any trading strategy, it’s important to be aware of key support and resistance levels as well as any fundamental events that could affect the currency pair.

Entry rules:

Long:

  • ADX above 25
  • +DI line crosses above –DI line
  • Parabolic SAR reverses and gives a bullish signal

Short:

  • ADX above 25
  • +DI line crosses below –DI line
  • Parabolic SAR reverses and gives a bearish signal

As we can see on the 4-hour EURUSD chart, the ADX line (thick blue below the candles) tends to move above and below the 25 level (dotted gray).

We have marked the area on the chart where a signal occurred according to this strategy. The ADX was above 25, the +DI line crossed above –DI and the Parabolic SAR reversed at about the same time.

For a timely signal, it’s best for the crossover of the +DI and –DI lines to occur together with the reversal in the Parabolic SAR, with some 2 – 3 bars maximum lag between the two signals. Otherwise, the signal may be lagging behind price and it’s more likely that it will be too late for the trade.

An example of a long entry using Parabolic SAR and ADX forex trading strategy

Trend Trading with the ADX and the Parabolic SAR

An example of a long entry using this strategy

Initial Stop-Loss Placement:

We use the Parabolic SAR to place the stop at entry and also to trail the stop as the trade progresses.

An important support or resistance level can be used as a stop-loss if it doesn’t threaten the main conditions of the trade (as per the ADX).

​One of the great things about the ADX, and with it of this strategy, is that we can quickly reverse positions and make hefty profits in both directions as the market aggressively reverses and trends in the opposite direction.

On this 4-hour GBPJPY chart, we can see how we could have profited handsomely in both directions successively.

An example of a long followed by a short entry - ADX and Parabolic SAR Trading System

Trend Trading with the ADX and the Parabolic SAR

An example of a long followed by a short entry

Managing the Opened Trade:

As a rule, we stay in the trade for as long as the Parabolic trailing stop is not taken out. So even if the other conditions for the trade (the ADX line and the +DI and –DI positions) change for a brief time (2-3 bars) the trade should remain open.

However, if the ADX falls below 25, or the +DI and –DI lines reverse in the opposite direction and stay there for several trading sessions (4 – 5 bars or more) then there is no need to wait for the Parabolic trailing stop to be taken out, but rather it’s recommended to manually close the position even at breakeven or a small loss because trading conditions have now changed.

An example of such a case is shown on the following USDJPY 1 hour chart.

USDJPY 1h chart - ADX and Parabolic SAR Forex Trading System

Trend Trading with the ADX and the Parabolic SAR

Trend Trading with the ADX and the Parabolic SAR

USDJPY 1h chart
We can see how we initiated the trade on a reversal in the Parabolic SAR and the +DI line crossing above the –DI. However, immediately the next session +DI crossed back below –DI and stayed there for 2 sessions before crossing above again. However, the ADX kept declining and remained below 25 indicating there is no trend here anymore.

The right decision here was to exit the trade at breakeven or a small profit after the ADX stayed below 25 for 4 – 5 sessions.

This is a powerful trading strategy that works very well during strong market trends and can offer excellent rewards.

Most importantly, due to the accuracy of the indicators used and the conditions under which they are used, this strategy enables traders to enter only the best and strongest Forex trends out of which the best trading opportunities are filtered out and considered for taking a trade. It may not generate as many trades as other strategies, but trades which are generated are with a higher degree of accuracy.

It’s easy to implement and to use this strategy. It doesn’t require expert knowledge of the markets or extensive understanding of technical analysis principles. The strategy can be applied on all currency pairs with pretty much the same performance/results. It also works well on different timeframes, but the 4-hour chart has shown the most profitable results.

On the chart below, we show a real Forex example of how this strategy based on the FxTR Improved RSI indicator and two EMAs looks on the charts:

RSI Forex 4-hour Trading strategy

Best 4-hour RSI Forex Trend Trading Strategy

The entry is at the vertical line on the left, while the exit is at the vertical line on the right (yellow MA starts to slope upwards) – A short trade example that resulted in a profit of over 300 pips on the CHFJPY 4h chart

Indicators to be used:

Three indicators are needed to trade this strategy:

  • 30 period exponential moving average (yellow on the charts)
  • 60 period exponential moving average  (blue on the charts)
  • The FxTR improved RSI indicator (Download for free here) – Created by the Fx Trading Revolution Team, this RSI-based indicator is very effective in predicting longer-term trends

Trading conditions and rules of the strategy:

Long trade entry:

  • Wait for the 30 period moving average (yellow) to cross above the 60 period moving average (blue)
  • Ensure that both moving averages are sloping upwards
  • The 30 period moving average (yellow) is sloped at an angle of 20 degrees or higher – No exact measurement is necessary here, but a subjective estimate is good enough
  • Look for a blue arrow to appear on the RSI indicator after the 3 criterions for the moving averages are met
  • Once all of the above conditions are satisfied, a long trade can be taken

Long trade stop loss:

  • Place stop below the 60 period moving average (blue)
  • Trail the stop behind the 60 period moving average as the market ascends higher

Long trade exit:

  • Hold trade for as long as the RSI shows a blue (bullish) signal
  • Close the trade if the yellow moving average starts to slope down
  • Or if the RSI turns bearish (red)
Forex 4-hour swing trading strategy

Best 4-hour RSI Forex Trend Trading Strategy

A long trade generated on the GBPCAD 4-hour chart – The entry signal is shown with the vertical line on the left and the exit signal is shown with the vertical line on the right
Short trade entry:

  • Wait for the 30 period moving average (yellow) to cross below the 60 period moving average (blue)
  • Ensure that two moving averages are sloping down
  • The 30 period moving average (yellow) is sloped down at an angle of 20 degrees or steeper – No exact measurement is necessary here, but a subjective estimate is good enough
  • Look for a red arrow to appear on the RSI indicator after the 3 criterions for the moving averages are satisfied
  • Once all of the above conditions are fulfilled, a short trade can be taken

Short trade stop loss::

  • Place stop above the 60 period moving average (blue)
  • Trail the stop behind the 60 period moving average as the market descends lower

Short trade exit:

  • Hold trade for as long as the RSI shows a red (bearish) signal
  • Close the trade if the yellow moving average starts to slope upward
  • Or if the RSI turns bullish (blue)
RSI EMA swing trading strategy 4-hour

Best 4-hour RSI Forex Trend Trading Strategy

The sell signal is shown with the vertical line on the left and the exit signal is shown with the vertical line on the right – EURUSD 4-hour chart

Core principles to remember for this Forex trading strategy:

  • Trading signals from the RSI should be ignored if the conditions of the moving averages are not satisfied first. That is, for a bullish signal of the RSI to be valid the 30 period (yellow) MA should be above the 60 period (blue). For a sell signal from the RSI to be valid, the 30 period should be below the 60 period moving average. This significantly helps to filter out noise moves in the market and reduce whipsaw signals that will result in bad trades. Thus, the overall performance of the strategy and the final results are improved by a marked level just by using this specific combination of the indicators.
  • It is recommended to lock in some profits from time to time. It’s not always necessary to wait for an exit signal from the indicators to close a part of the position. Since this is a trend trading strategy, the exit signal generated by the RSI and moving averages will tend to eat into the profits to some degree. Using some leading indicators like Fibonacci retracements or support and resistance zones from higher (like the daily or weekly charts) can help you to lock in partial profits at key technical levels just in case if the market suddenly reverses. In this way, the trader still gets to keep some of the profits in such cases.
  • This strategy doesn’t use profit targets because it tries to capitalize on trends which can last for an undetermined time and distance on the charts. Hence, for a trending market environment, it’s usually better to just trail the stop behind the price instead of using fixed profit targets. Very often the profit targets are exceeded in trending markets so constantly using them can actually reduce the profits for the trader in the end.
rfxsignals April 3, 2020 No Comments

Double Bollinger Band, MACD, Stochastic Crossover Forex Strategy

rfxsignals April 3, 2020 No Comments

1-hour Bollinger Bands – CCI Forex Trading Strategy

The following strategy can be used on any of the intraday charts however it has shown the best results on the 1-hour timeframe and therefore it’s best to use it on the 1-hour chart. It is most suitable on the major Forex pairs, although there are no limitations regarding the Fx pairs it can be applied on.

This Bollinger Bands – CCI strategy is not a day-trading strategy, meaning trades can be held for as long as the conditions for the trade remain true regardless if that means holding the position overnight.

The main goal of the strategy is to profit on the acceleration of trends and their continuation in the direction of the trend in force.

Below is an example of how the strategy looks on the charts:

forex 1 hour trading strategy

1-hour Bollinger Bands – CCI Forex Trading Strategy

A long trade as generated by this strategy shown on the EURUSD 1-hour chart

Indicators to be used:

For this strategy, we’ll apply 2 main indicators which are necessary.

  • 1st Bollinger Bands with the custom settings as follows: period – 100 and a standard deviation of 3.
  • 2nd the FxTR Improved CCI (Download for free here) – developed by the Fx Trading Revolution team – this indicator accurately identifies trends and trend reversals.

Additionally, you can also place the Master MACD and the ADX indicators below the chart to help you determine the momentum of the trend. Weak momentum may be an indication that a potential trading opportunity is not good and the trade will not work out well.

While placing the Master MACD and the ADX are not a requirement for this strategy, they are often helpful as both of those are very useful indicators.  Avoiding trades where the ADX is below 25 will result in better trading signals and trades with a higher probability for success.

But, the reason for using these two indicators is only to aid the trader in reading the primary indicators and signals of this strategy which are the crossing of the middle line of the Bollinger Band and the CCI. So, just because the ADX not exactly at 25 doesn’t necessarily mean you should avoid taking the trade altogether if, for example, the other conditions look good.

For illustrating the strategy in this article, we have placed both the ADX and the Master MACD indicators.

Long trade entry:

  • Wait for price to cross above the 100 moving average of the Bollinger Band (that is the middle line of the indicator).
  • Wait for the CCI indicator to turn blue (bullish).
  • Initiate long trade.
  • Additionally, it is better if the ADX is above 25 and the Master MACD is showing a bullish trend.

Long trade stop loss:

  • Place stop behind the most recent low below the middle line of the Bollinger Band indicator (100 moving average).
  • Make sure the stop is smaller than the destination to your profit target (the upper band of the BB).

Long trade profit targets and exit rules:

  • Target the upper band of the Bollinger Band
  • Or exit when the CCI turns red (bearish)
An example of a long trade is shown on the chart below which resulted in a nice profit.
Bollinger CCI Forex trading strategy

1-hour Bollinger Bands – CCI Forex Trading Strategy

Buy signal indicated with the up arrow on the left and the exit signal shown with the down arrow on the right – USDJPY 1-hour chart
Short entry rule:

  • Price is below the middle line of the Bollinger Band.
  • The CCI indicator is bearish (red).
  • Enter a sell position.
  • In addition, look for the ADX to be above 25 and the Master MACD to show a bearish trend as verification of the trading signal.

Short trade Stop Loss:

  • Place the stop above the middle line of the Bollinger Band.
  • Make sure the potential trade comes with a good risk-reward ratio. The stop should be smaller than, or as large as the distance to the profit target (the lower band of the BB).

Short trade Profit targets and exit rules:

  • Target the lower band of the Bollinger Bands
  • Or exit when the CCI turns blue (bullish)

A short trade generated with this strategy is shown on the chart below.

Forex 1 hour strategy CCI Bollinger

1-hour Bollinger Bands – CCI Forex Trading Strategy

Sell signal (down arrow on the left) and the exit signal (up arrow on the right) – EURUSD 1-hour chart

General guidelines for the strategy

  • Aim for at least a 1-1 risk-reward or higher – This goes to managing risk properly. It is very important because many potential trading opportunities may look perfect by the setup but may not fulfill this crucial condition (an acceptable risk for the potential reward). Such trades should not be taken despite the bullish signals and the good-looking trade setup.
  • There is no need to exit when the CCI turns neutral as this can only be noise and then the indicator can just turn bullish again. The ADX and the Master MACD can, however, confirm that a change to neutral in the CCI is something more important and that a possible reversal is coming.
  • Avoid closing a trade on small fluctuations of the CCI if sufficient profit has not been achieved yet – This is where the ADX, the Master MACD and just reading the price action can help you in staying with a trade during sideways price action.
  • Obviously, paying attention to support and resistance on larger timeframes will be important when using this strategy as is in most cases when trading Forex. A strong resistance or support on the way to the profit target is a serious obstacle for achieving the target and, therefore, it’s better to avoid taking such trades.
rfxsignals April 3, 2020 No Comments

MACD Trend Forex Trading Strategy

The MACD is a technical indicator designed for trend trading the markets and as a result, there are many trend trading strategies based on the MACD indicator. In our strategy here, however, we will use a few other indicators in addition to the MACD in order to ensure a higher rate of profitable trades.

So, there is no need to do much price action reading with this strategy, although that is certainly always beneficial. The set of indicators used in this strategy provide all the information needed for it to work.
Forex MACD Trend Trading Strategy

The indicators we use for this strategy are:

  • MACD (with histogram) – the default indicator in MetaTrader 4
  • Parabolic SAR – also included in MetaTrader 4 by default
  • ATR (Average True Range) – A volatility indicator also included in MetaTrader 4

The Parabolic SAR was specifically created to provide better stop levels and better stop management. In this strategy, we use it for placing the stop and also as a confirmation tool for entering trades.

Entry rules:

  1. Enter long when the MACD histogram (in these examples shaded area with green vertical lines) crosses above the zero level and when the signal line (red line in these examples) enters inside of the histogram.
  2. At the same time, the Parabolic SAR indicator should be bullish. That is the blue dots on the charts shown here should be below the price at the point of a long entry. If the parabolic SAR gives a contrary signal with the dots being above the price then there are no conditions for a trade to be taken according to this strategy.
  3. Always keep an eye on important support and resistance levels on higher timeframes and make sure there are no significant obstacles in the way of the trade. For example, if you take the trade from the 4h chart, check where important support and resistance levels are on the daily, weekly and monthly timeframes.

    For best results, the MACD histogram should be above the zero level and the crossover of the signal line should happen at the same time as the Parabolic SAR reversal from bearish to bullish.

    ​The same applies for short entries only in the opposite direction.

Forex MACD Trend Trading Strategy

MACD Trend Forex Trading Strategy

Examle of a short entry using this strategy – AUDUSD 4h chart

​Stop Loss Placement:

The default stop for this strategy is placed according to the Parabolic SAR. What’s important is that this stop changes with each new session hence it becomes a trailing stop. So, as soon as the trade moves into some profit we start to trail the stop.

In order to avoid whipsaws and premature stop outs, it’s even better to use the dots of the Parabolic SAR as a stop on the close of the session, rather than simply to be taken out if price touches this level. However, currently, there is no such default feature in the popular MetaTrader 4 platform, although it can be done by using an expert advisor.

In the case of a stop out because of a volatility spike, it is acceptable to reenter again in the trade if the entry conditions are still in place.

Additionally, you can use the MACD indicator to aid your trade management.

Forex MACD Trend Trading Strategy

MACD Trend Forex Trading Strategy

An example of locking in profits on the trend losing momentum – AUDUSD 4h chart

Targets and Take Profits

Take partial or full profits if an important support or resistance zone is hit.

If there is a strong price reaction off a support or resistance zone it is wise to close the full position.
Additionally, if there is no support or resistance zone on the way you can use the ATR to take profits based on the average trading range for a given timeframe. 1xATR, 2xATR and 3x the ATR are good profit targets.

It’s best to take partial profits for example 1/3 at 1x ATR then 2/3 at 2xATR and the last third at 3x the value of the ATR.

Make sure there is at least a 1:2 risk-reward ratio where the risk is the stop according to the Parabolic SAR and the reward is the target based on support/resistance or the ATR.

To see how we can combine support and resistance we’ll use a zoomed-out 4h chart to demonstrate this situation. The support level was an important technical zone on the daily and weekly timeframes.

Forex MACD Trend Trading Strategy

MACD Trend Forex Trading Strategy

MACD Trend Forex Trading Strategy

An example of combining support with this strategy – EURUSD 4h chart
rfxsignals April 3, 2020 No Comments

30-Minute MACD Forex Trading Strategy